BCON moving higher i think.

Posted by downtowntrader | 8/19/2005 01:40:00 PM | 0 comments »


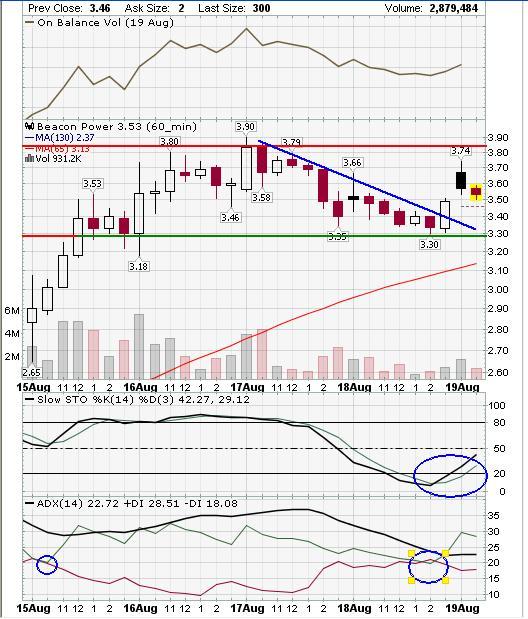
This is BCON's 60 and 5 minute charts. Notice the downtrend has ended and support at 3.30 was held. Resistance over head is at 3.80. Stoch gave a buy signal at yesterdays close. Notice 10 day ema or 65 bar ema is catching up to price to add support. There is some resistance on the 5 minute chart at 3.60. Notice the stock came back and filled the gap on lower volume. My guess is that if BCON clears 3.60 again on strong volume, that it will test highs again and possibly hit 4. A stop can be set below 3.30. Good luck. DT

Welcome to my Blog

Posted by downtowntrader | 8/19/2005 10:23:00 AM | 0 comments »

This is my blog dedicated to technical analysis of stocks. I will post charts and analysis of stocks i am interested in. This site was created so that I could have a place to post my ideas for my fellow trading friends. Please feel free to comment on anything you see here and as always, please do your own due diligence before ever buying or selling short any equity. Hope you like my blog.

DT