Looks like money is flowing in to SCLN late today. I posted my chart a few posts below. The 50 day was at 5.88 this morning, so let's see if there is enough strength to take it out.
DT
BCON has volume coming in today.
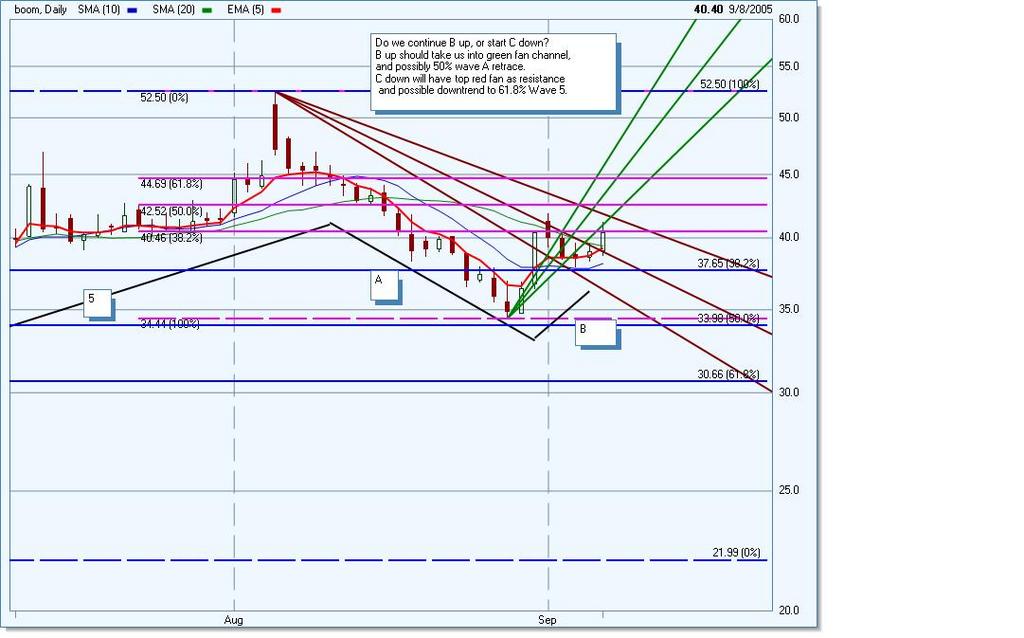
OK, I know this chart is messy, but all the lines are important. The pink lines are the fib retrace of Wave A down. The Blue lines are the Fib retrace of Wave 5 up. Red Fans are for Wave A down, and Green Fans are Wave B up. Black lines are to outline waves. If Boom makes a higher high tomorrow, then we can be in 3 of B and still see the 50% or 61.8% pink retrace lines of Wave A. If Boom makes a lower low, then I think Wave C may have started and Boom could see the blue 50% or 61.8% retrace of Wave 5. Just my 2 cents.
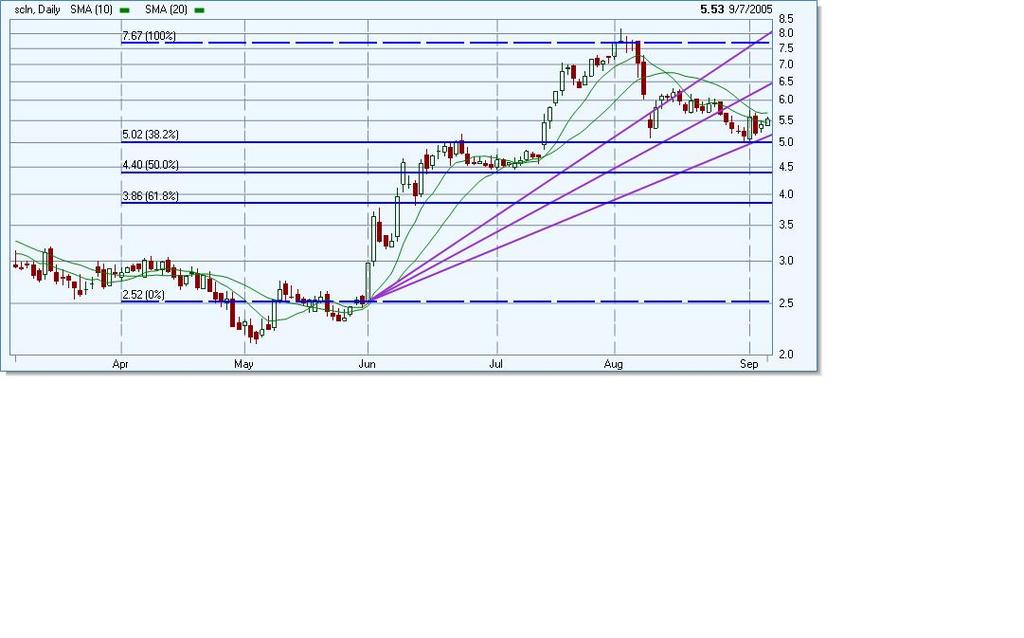
SCLN may be interesting here. They closed over the 10 day sma for the first time since the pullback from their recent run up. They tested the 38.2% retrace (which also happens to be a support line from the breakout point) twice, so we have clear support at 5.00. This provides a nice risk / reward ratio if you target previous high, but it could also continue on to new highs. Right now 50ma is resistance at 5.86, but if it breaks that, then it may resume the previous uptrend. Good Luck.
DT
note: I own shares from the low 5 level. Please do your own DD before investing any money.
I sold my topt earlier today and doubled down on aapl at 48.46. I will keep a tight stop on the second half of aapl due to where I got in.
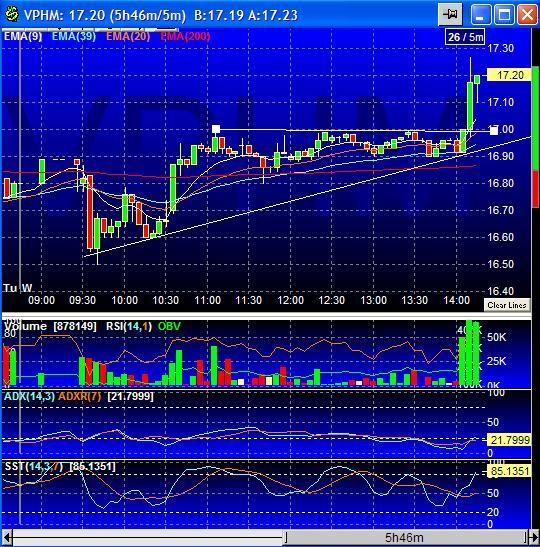
This is a beautiful ascending triangle breakout on the 5 minute chart. Should lead to a new high for vphm.
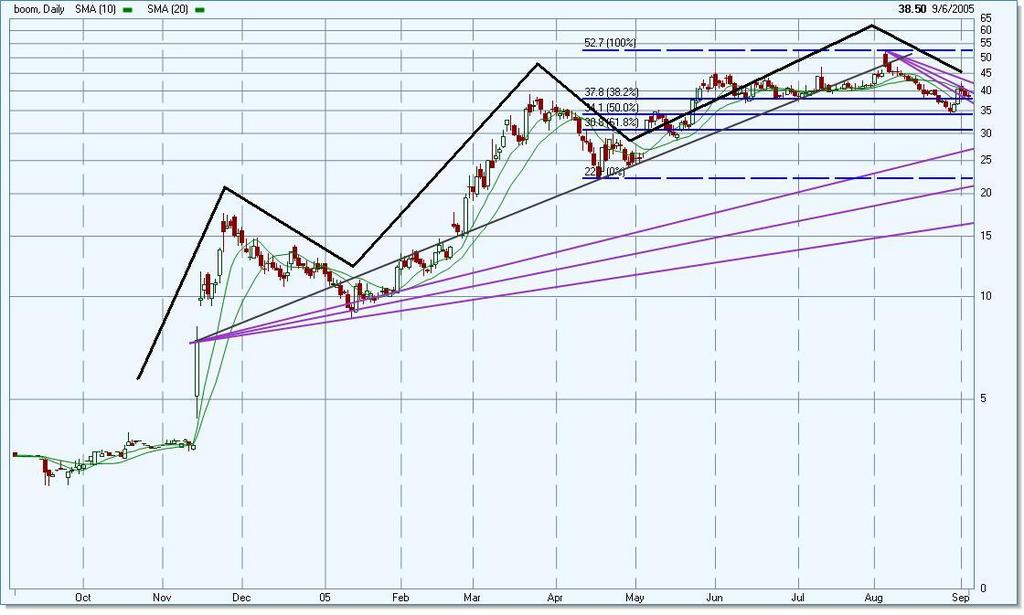
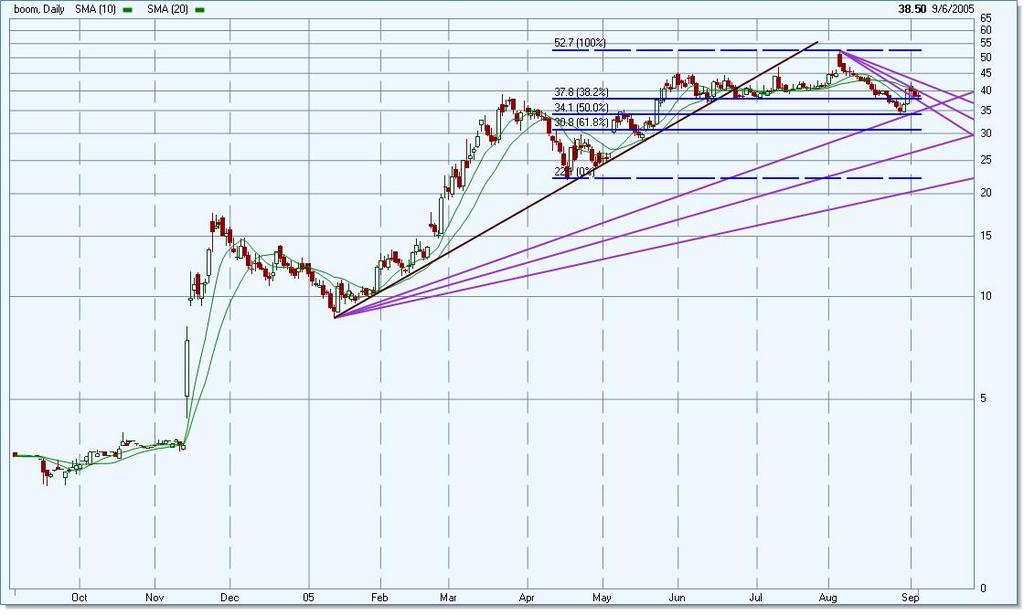
I drew a chart with an internal trendline boom has been using long term. It has acted as support and resistance at different times in BOOM's life ultimately reclaimed and broken on the most recent earnings day. Typically stocks end up coming back to an internal trendline. I tried a fib fan of the trendline to see if it lined up. I'm not sure if this type of fan retrace is common, but it has held up for me before on intraday charts. If so, the 38.2% retrace of the trendline will take it to approximately 29-31. I have drawn what i think may be the current wave count, which was 5 up with a 5th extension and we are now in either A down or B up. My wave knowledge is very basic, so my count may be off. More recently, BOOM looks like it held the 50% retrace of my wave 5, and is currently testing the 38.2% as support. I am neither bullish or bearish BOOM, as I don't have any position in it yet. If indeed we are in B up, then I may swing it, if not, then I will just stand aside. I also posted an option 2 scenario, using a different trendline. This is a newer trendline, and therefore may be more valid, but it wasn't in play for last earnings date. Option 2 certainly paints a nicer retrace picture, but still could end up near 30. Ultimately chart reading is an art, not a science, and I could be way off but I think this is a very interesting scenario.
Please do your own DD. Good Luck.
DT
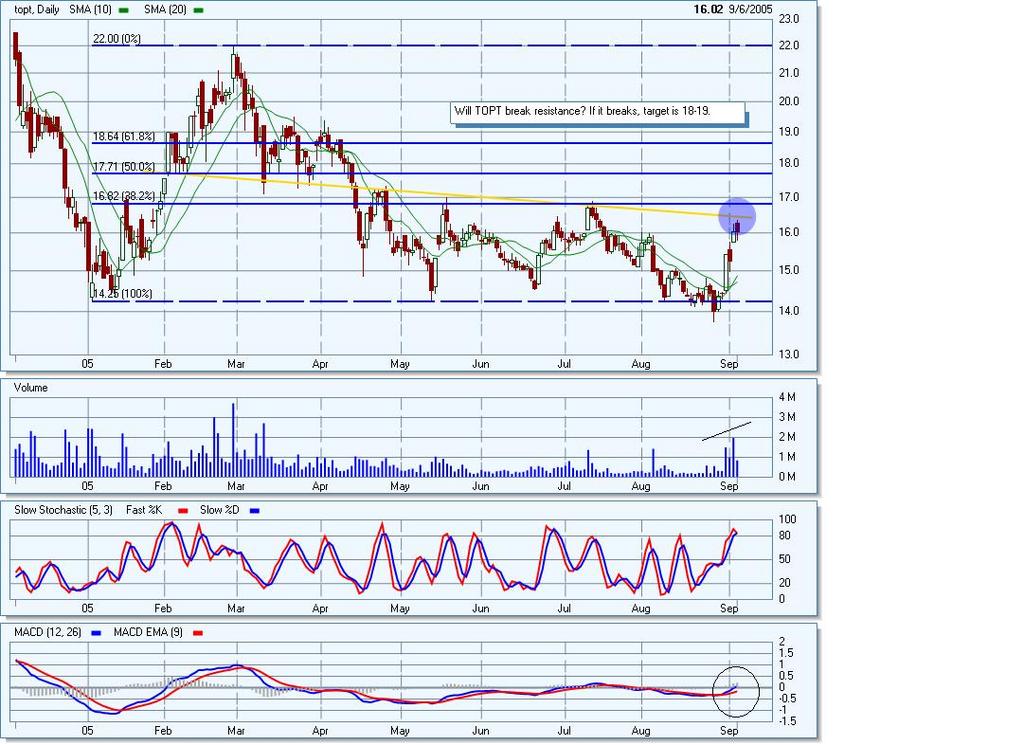 TOPT feels tired but MACD crossed and volume has been higher for this little run.
BCON ended the day sandwiched between 10 and 20 day MA's. TOPT looks to be getting a little tired and technically hasn't broken out of the triple bottom base. I may take profits near resistance and buy back if it clears the base over 17. Will post some new charts tonight.
DT

BCON has pulled back to the 50% fib retrace , 61.8% fan retrace , and 3.30 support trendline and found support. It failed to move into next fan so could retest lower fan line. Right now it's also sandwiched between 10 and 20 sma's. Tuesday should provide some clues as to where BCON will go next.
DT
Subscribe to:
Posts (Atom)


