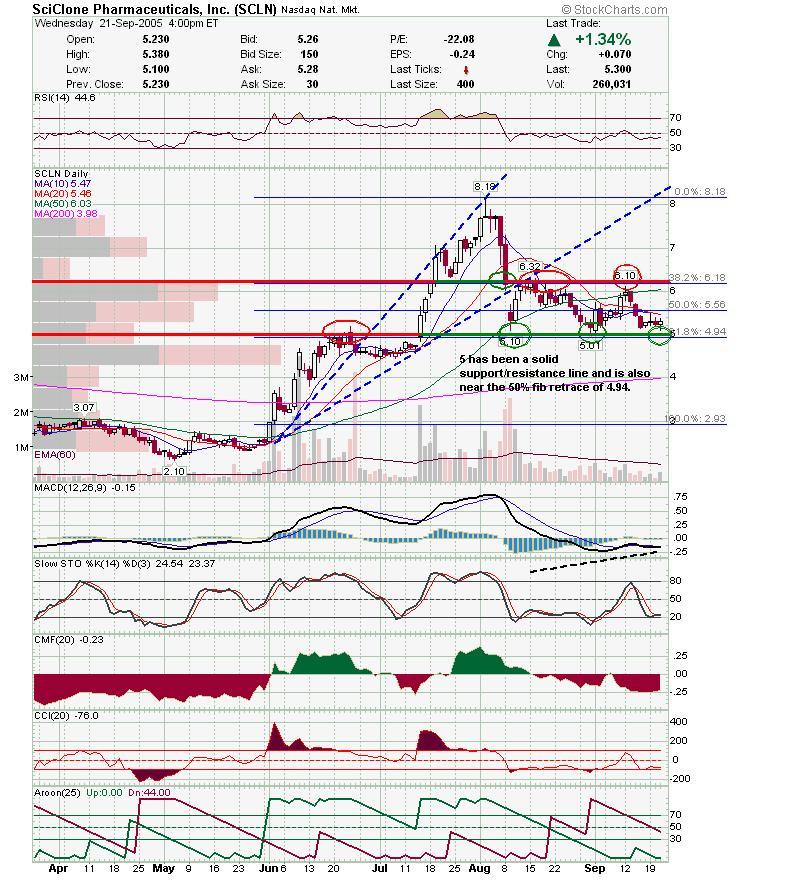
Although the market has been pretty crappy the past few days, I think it is due a bounce soon. Both the nasdaq and small cap 600 are close to fairly strong support levels. Right now the Hurricane and Oil are dominating the headlines, but I think there are still some chances to go long. I've been holding SCLN for a couple weeks now and it is very near strong support. Today it was up slightly in a pretty bad market. In my opinion, this is a good risk / reward play. Good Luck.
DT
5 Day 15 minute chart.
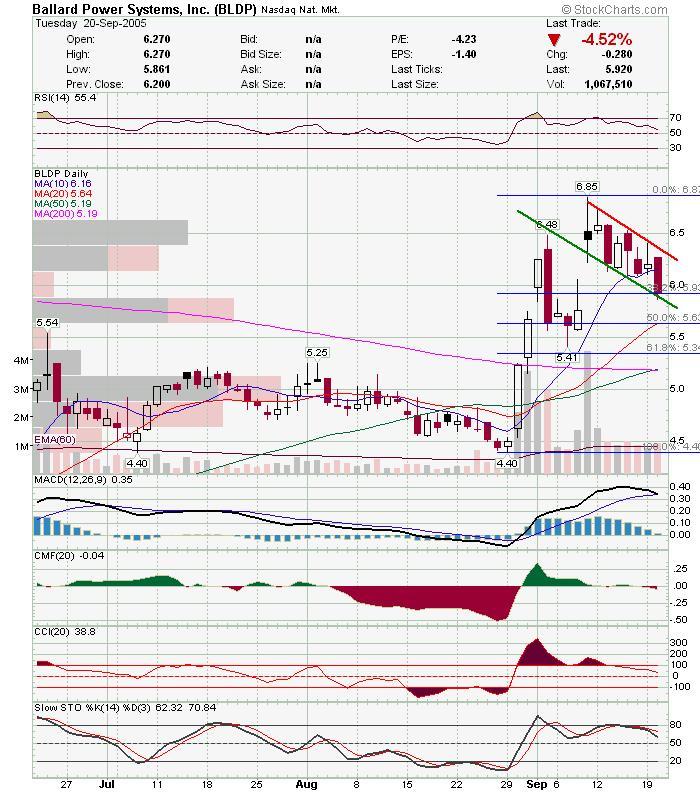 BLDP almost fell apart yesterday as it tested the bottom of the pennant. It may of been saved and break out of the pennant today, on news of China's president visiting the company for a meeting. See link below.
http://biz.yahoo.com/bw/050917/175010.html?.v=1
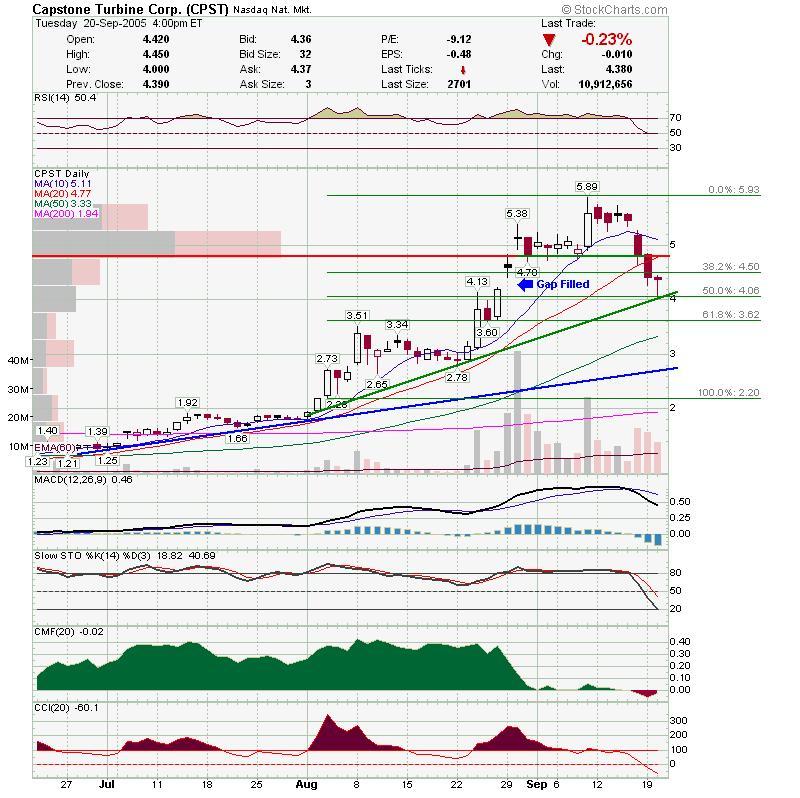
CPST may be setting up for a bounce. It bounced off double support today (trendline, 50% retrace), and filled the previous gap. It ended in a doji which could signal a reversal as well. The key is how it follows through tommorrow. I know about the bad news, and I'm not sure fundamentally where they stand, as I'm only looking at the technicals here for a short term move. If CPST makes a higher high (>4.45) tommorrow, then I believe it can be traded for a quick gain. If it makes a lower low then the 61.8% retrace may be the next stop.
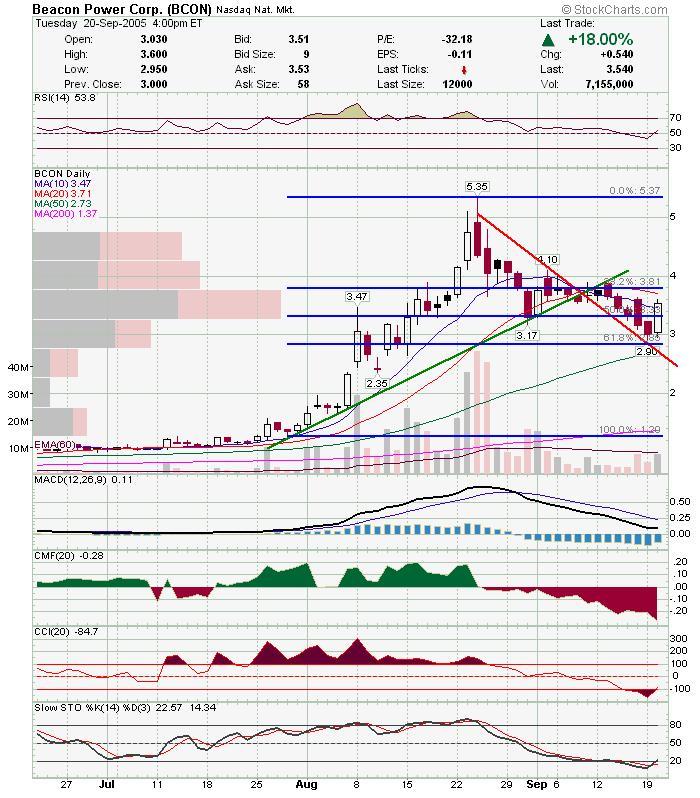 Here is the chart I've been using for BCON. BCON touched the 50% retrace and seems ready to move back up. 3.80's has been pretty stiff resistance, so be careful trading it. Good Luck.
DT
Another day in the fan. Boom has been holding the current fan for the past week. It bounced off the lower line today (see earlier post with intraday chart). Not sure where this will end, but I still think the path of least resistance is down. 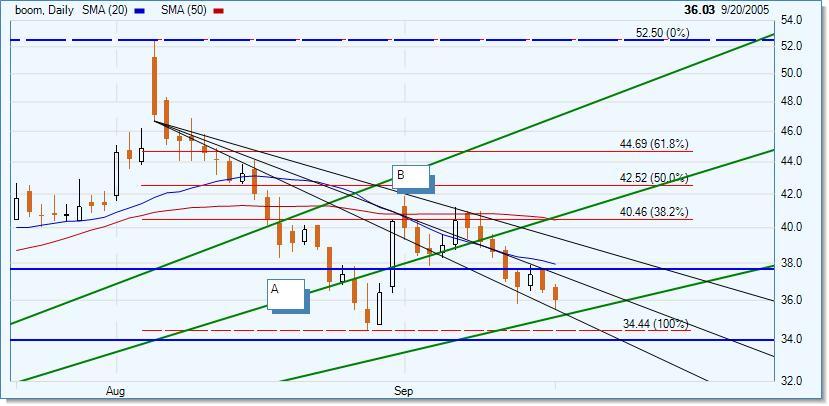 Zoomed in on ABC down. Boom has been trading fairly reliably within the common fibonacci retraces. The blue lines are the fib. retrace for wave 5 (or last movement up). The fans are retraces of the same move up and the move down from 52.50 to 34.44. See 6 month chart below to gain a better perspective of the recent move up and the following correction.
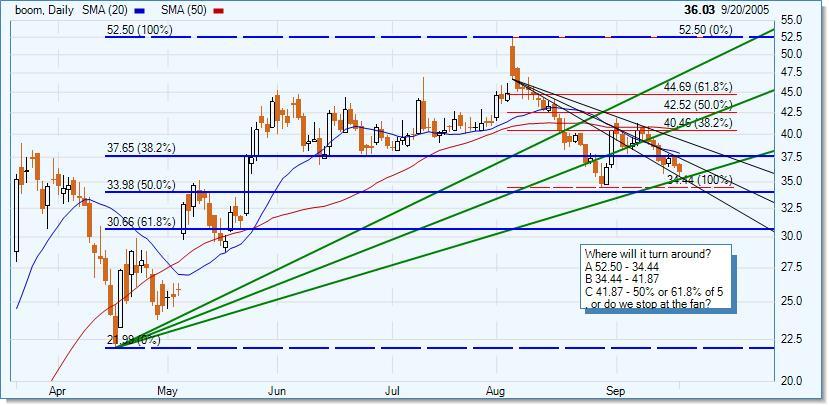
6 Month Chart showing wave 5. See full chart in previous posts below. Good Luck.
DT
Looks like we got lucky here in Miami as Hurricane Rita stayed below us. We are and will experience Tropical Storm conditions, but barring a tornado, we should not experience anything major. I am posting another boom update highlighting a downtrend channel on the 5 minute chart and how it relates to the overall picture. Boom may give an early entry if the 5 minute channel is broken to the upside. On the daily chart, it still looks as if we are headed to the 61.8 fan line at a minimum, although that remains to be seen. Good Luck.
DT
ps. As I was finishing up this post, Boom fell to the lower 5 minute trendline at about 35.60 which is also close to the lower downtrend fan line on the daily chart.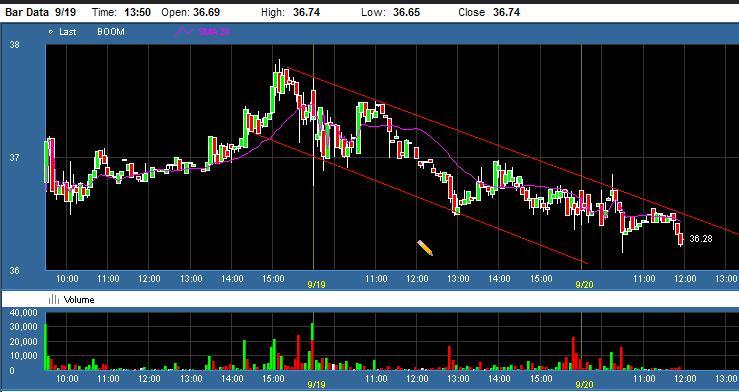

Well, here we are under another Hurricane warning in Miami. I may not be posting tomorrow depending on whether we have power or not. Right now the storm seems pretty benign for us, although they were saying we may get some flooding again. I'll post an update tomorrow if I can.
DT
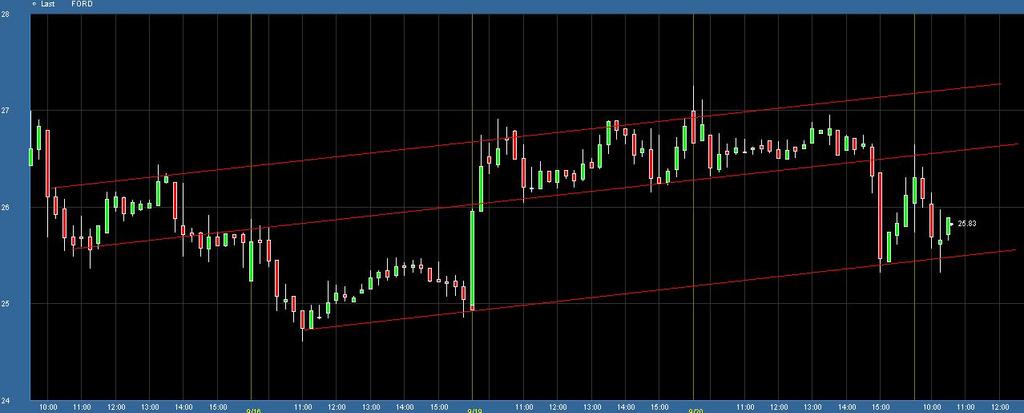
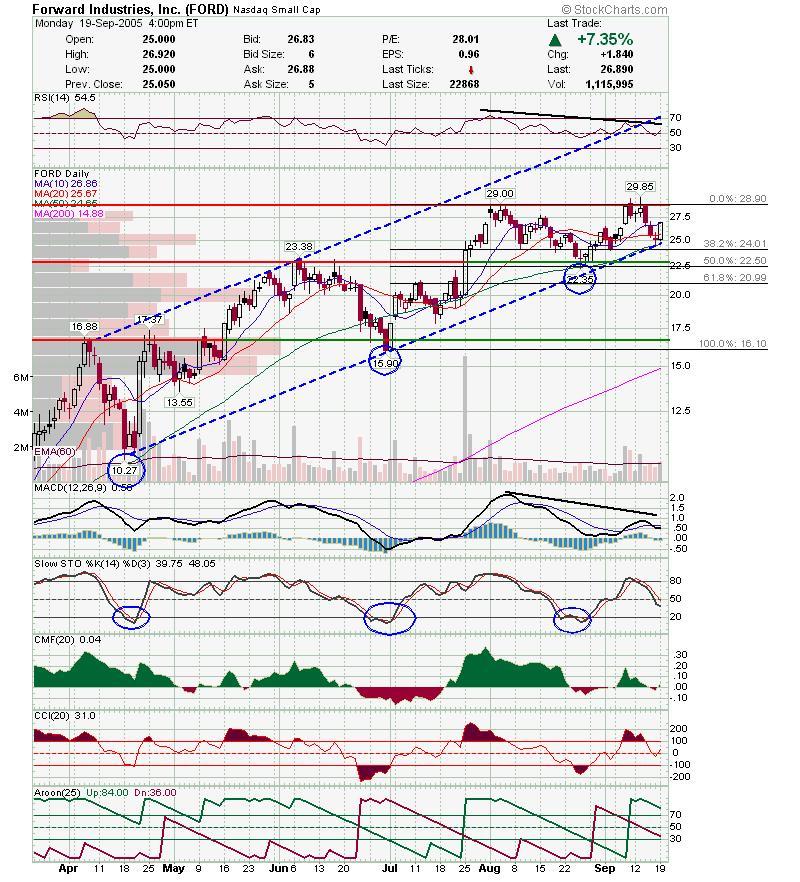 Dave, This ford's for you. We have a well defined uptrend line that has been tested when slow stochastics drops below 20. Each has been a strong buy signal. Looks like Slow Stochastics cross down from above 80 has been a reliable sell signal. Most recent candle was very bullish completing a morning star. Right now there is support at the trendline and 50 ma. If that breaks, look for possible support at 24 or more likely 22.50 (50% retrace and former support). I have a $36 target if it can close above $30. Good Luck.
DT
Boom tested the 38.2% retrace and the current fan's upper trendline and failed to move up. It ended up making a lower low on virtually no volume. Still waiting for Boom to decide it's next move, but the path of least resistance remains down IMO.
DT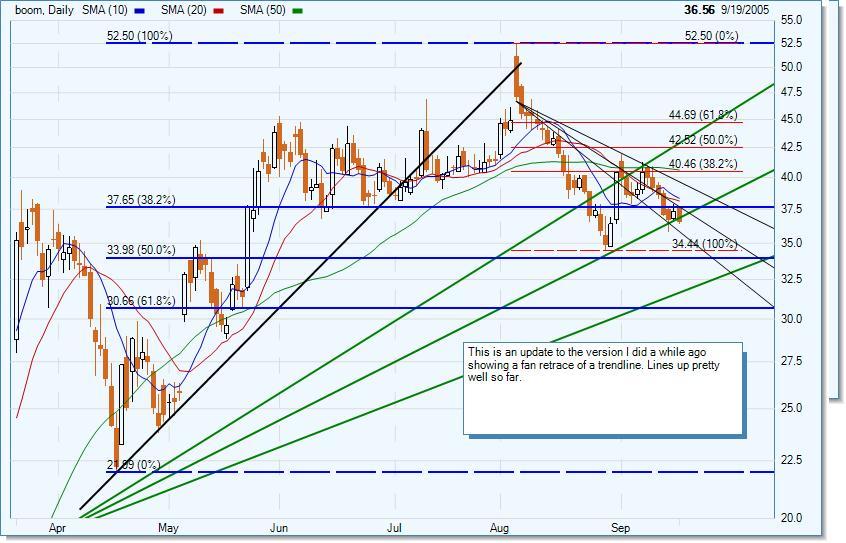
Subscribe to:
Posts (Atom)


