I was traveling all day today and the only thing of note I can say is I bought some BOOM at 40.20 this morning before boarding my plane. I got stopped out of a few positions, and I will remain on the sidelines for the most part. I have three positions right now, and I will be out of town (and not trading) till Wednesday. I will set a stop on them and hope for the best. I was a little surprised that we didn't get a dead cat bounce today, since most of the indices were at support. We are kind of stuck in no mans land right now... Too oversold to initiate new shorts, and too risky to bottom fish most stocks right now.. Looks like I'm traveling at the right time. Good Luck.
DT
This is an example of the type of charting I do with quotetracker. This is a 15 minute chart of HANS.
Sold all my boom traders this morning for small profit. Looking for 40.46 to buy.
Shorted HANS after morning POP.
BLDP Showing strength, while ENG and HOM are being pressured.
I will be bargain hunting for VPHM as well. Good Luck.
DT
I was happy to see some pockets of strength today. Keep an eye on these three stocks tomorrow as they did not wilt in the face of todays pullback. Actually, all three went up towards the end of the day. I like to look at intraday charts to look for strong or weak finishes. I watch these three closely, as they are holdings right now. All three had one thing in common today. They all closed strong and near high of day.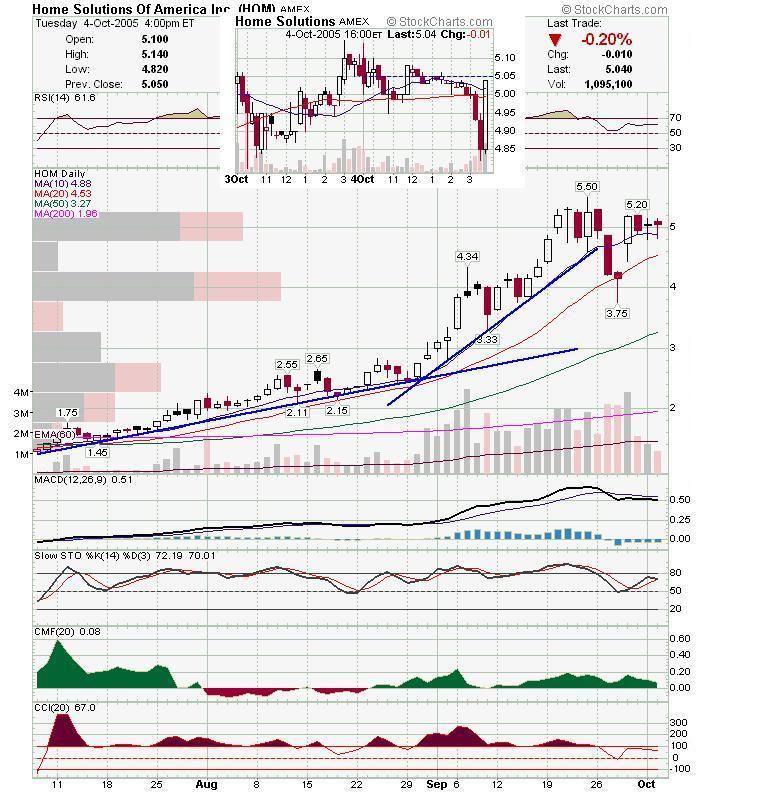 HOM had pulled back with the rest of the market, but look at the last 15 minute bar. Although they ended the day pretty much unchanged, the last 5 minutes may be a preview of what's to come. I will look to get out on a lower low, but I fully expect them to trade higher.
 I had planned to take profits on ENG when they challenged the broken downtrend line, however, they also had a very powerful 15 minute candle to close the day at the high. I will watch tomorrow closely.
 BLDP built up volume througout the afternoon and also closed with a nice 15 minute candle. I daytraded this stock a couple days ago, but bought it back when it broke the resistance line. I am swinging it now, and will continue to move up my stops based on intraday support levels. Good Luck,
DT
The Markets have looked a little toppy lately (see post from this morning below), so there should be money to be made on the short side the next few sessions. Here are some short possibilities.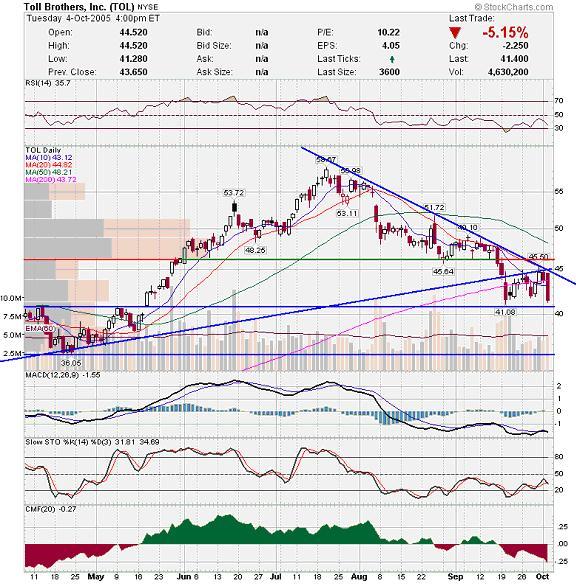
TOL was a nice play at the down trendline, however, it looks like there is more downside here. If it breaks below the horizontal trendline it should be shortable. I had HANS on my short list last night, but I had my hands full today managing some open positions, so I never initiated my short. Too bad as it had a perfect evening star reversal. There is plenty of downside here in the channel. I will look for a morning pop to short near the trendline on the 15 minute chart, or on a break to lower lows.
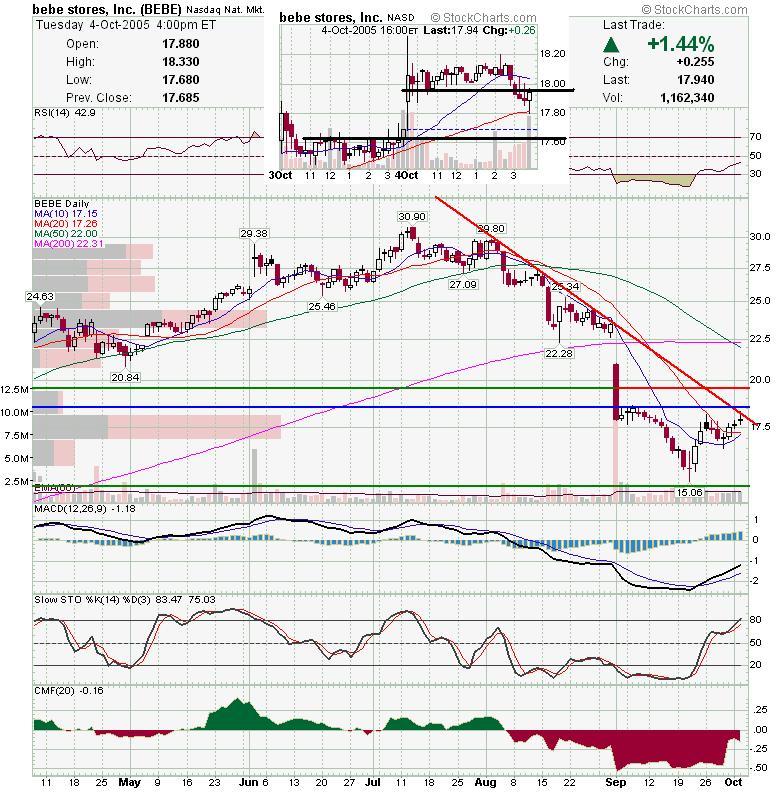 BEBE is right up against resistance and the 50 just crossed below the 200. However, it does have a little support with the 10 and 20 ma just below price.
Good Luck.
DT
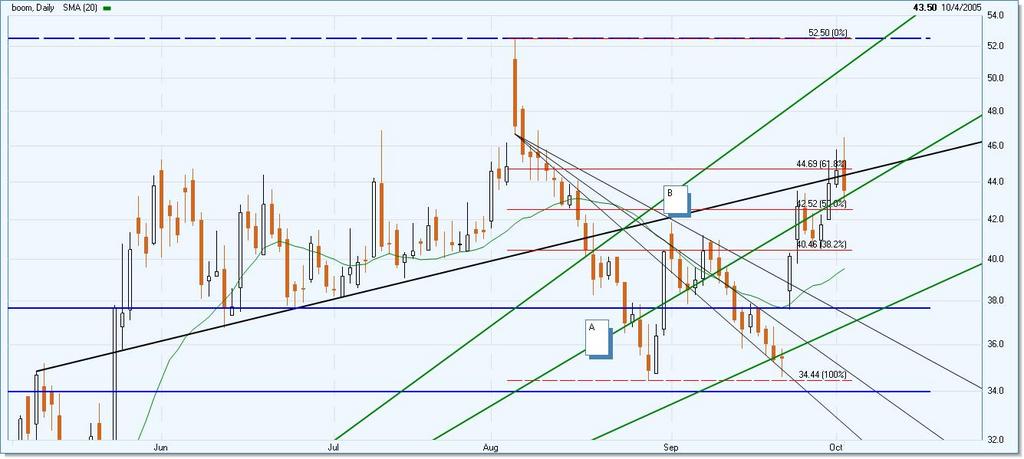
Boom reversed hard today and failed to hold 44.69 for the third time. It stopped at the fan line at least and may trade around the line for a few sessions. I had a near term target of 46.46 for the double bottom breakout and it hit 46.49. Let's see what happens tomorrow with the split.
DT
Keep on your toes today as the Nasdaq Composite and SP600 (small cap index) are both at or near resistance. Could pull back later.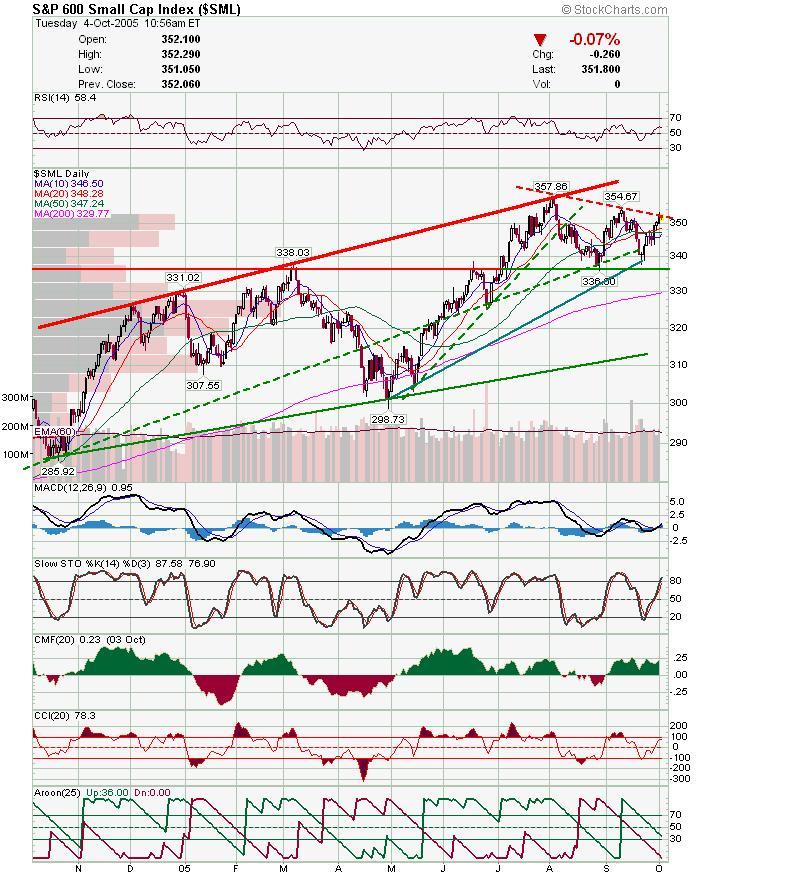

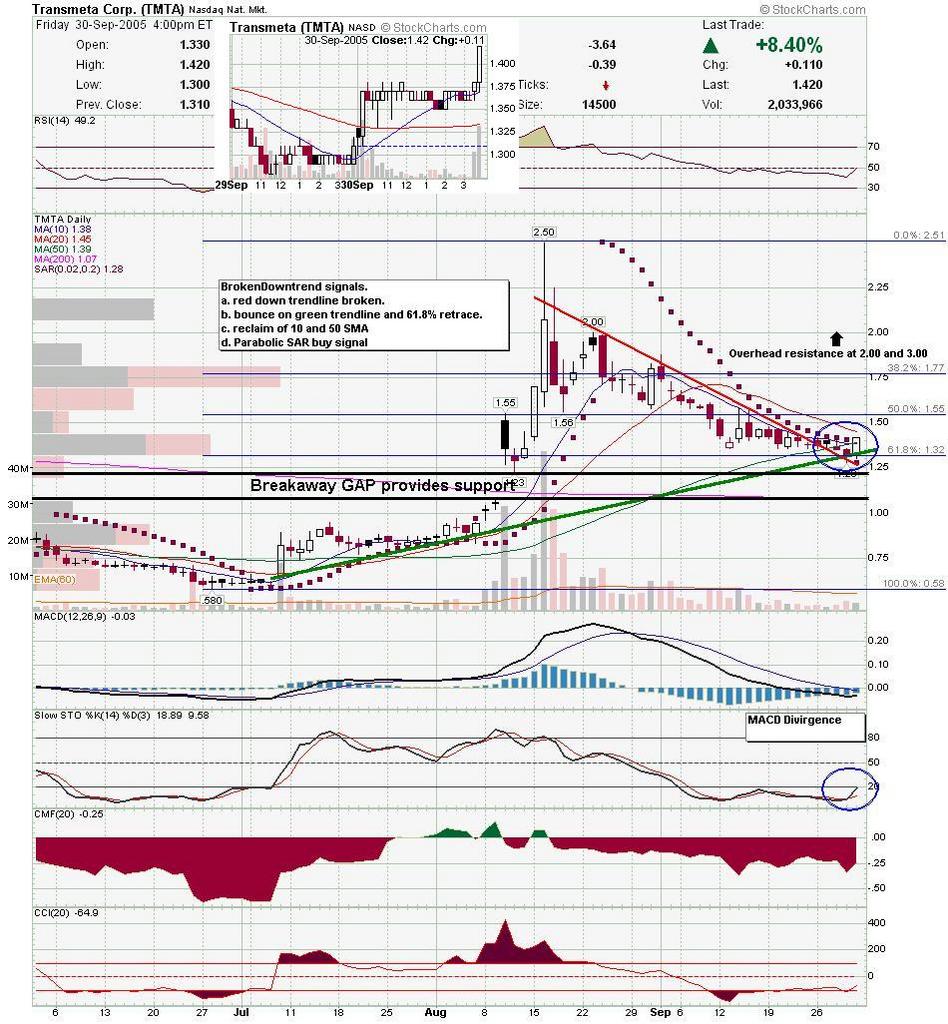 15 minute chart confirms what the daily chart is showing. TMTA should head higher from here, and at worst, provides an entry with very little risk. There is one thing I don't like here, and that is that the break of the downtrend was not accompanied by a volume surge. This may mean that there will be a retest of the trendline soon. But, volume HAS receded very nicely during the pullback. There are a lot of buy signals here, or near signals. In addition to the signals described on the chart, Slow Stochastics is about to cross from under 20, and MACD looks like it will cross over soon. I'm liking this chart, so I will probably go long tomorrow.
DT
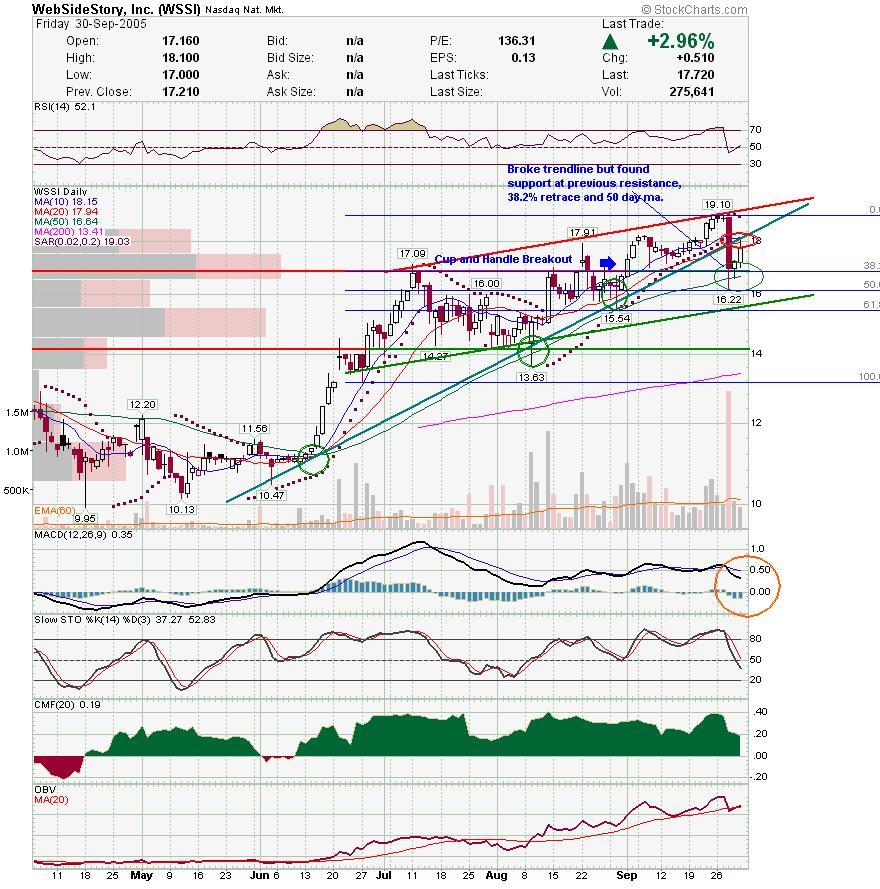 At first glance, this looks like a pretty easy short. There were massive insider sells, which caused a break of the uptrend line and the the volume is decreasing on the way up to retest the trendline. But, it did find support and is within another newer trading channel. I will look for weakness as it approaches the trendline again, or wait to see how it plays out. If it breaks back in over the trendline and therefore the 10 and 20 sma's, then that is a very bullish sign. Good Luck if you choose to play it either way.
DT
link to insider sales: http://finance.yahoo.com/q/it?s=WSSI
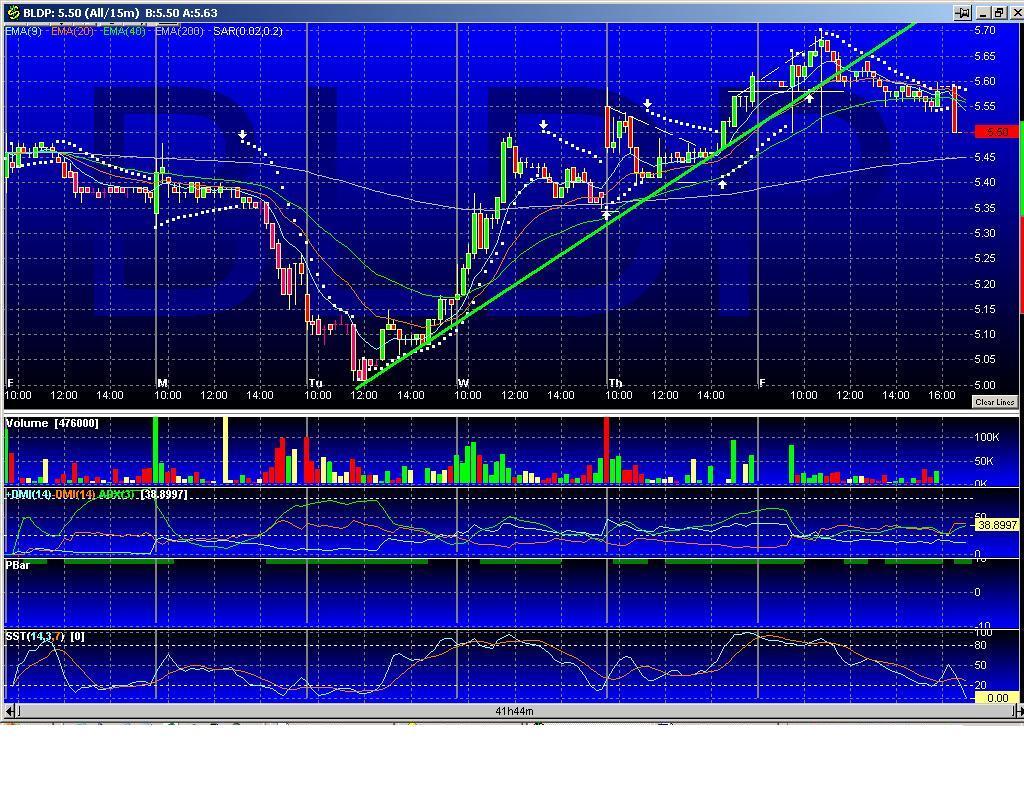
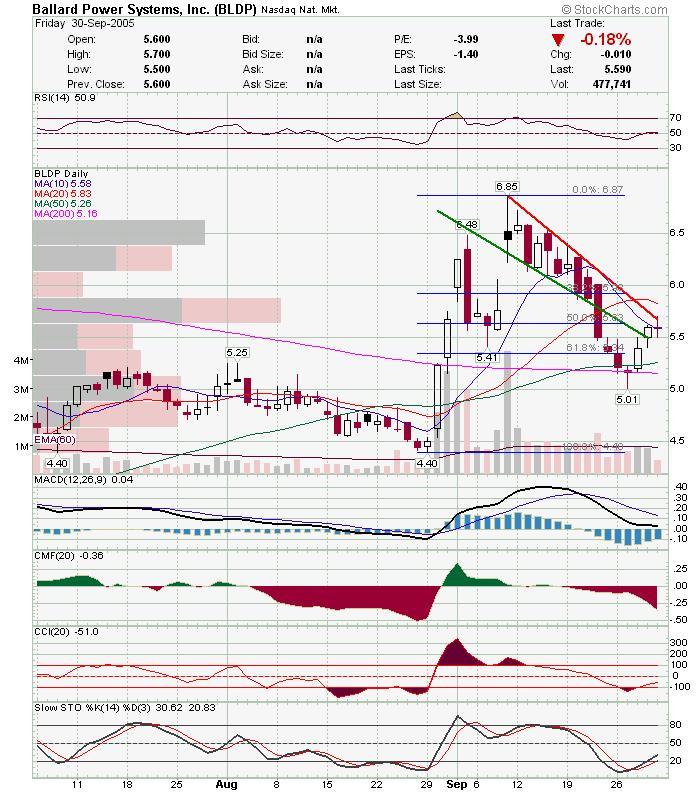
These are the BLDP charts I was looking at while daytrading it the past two days. I mentioned what I was looking at a few posts below, but I was having problems with the blog. This is also a good example of what a quotetracker chart looks like. I will keep an eye on BLDP, cause if they can break the daily resistance trendline then there is more upside to be had in a swing trade. They did break the uptrend line on the intraday, so there may be a pullback to the 5.40 area again. Good Luck.
DT
Subscribe to:
Posts (Atom)


