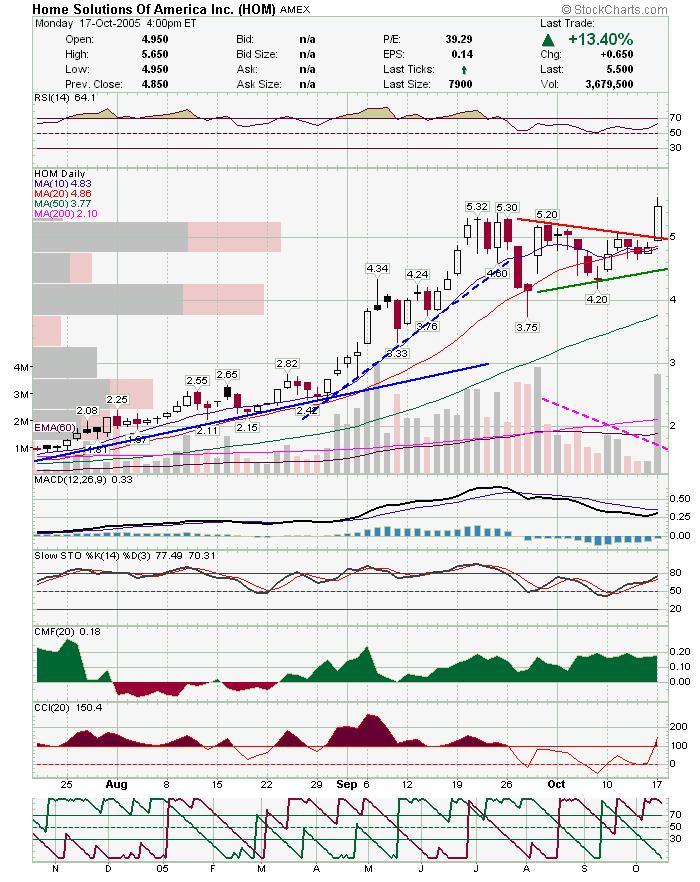
I've had my eye on these two for a while now. Take a look at both of these charts and it's funny how many similarities they have. Both have been extremely oversold, they have divergences on all the indicators and might be forming double bottoms. If we have a little rally here, i would expect these two to trade to their next resistance levels. Good Luck.
DT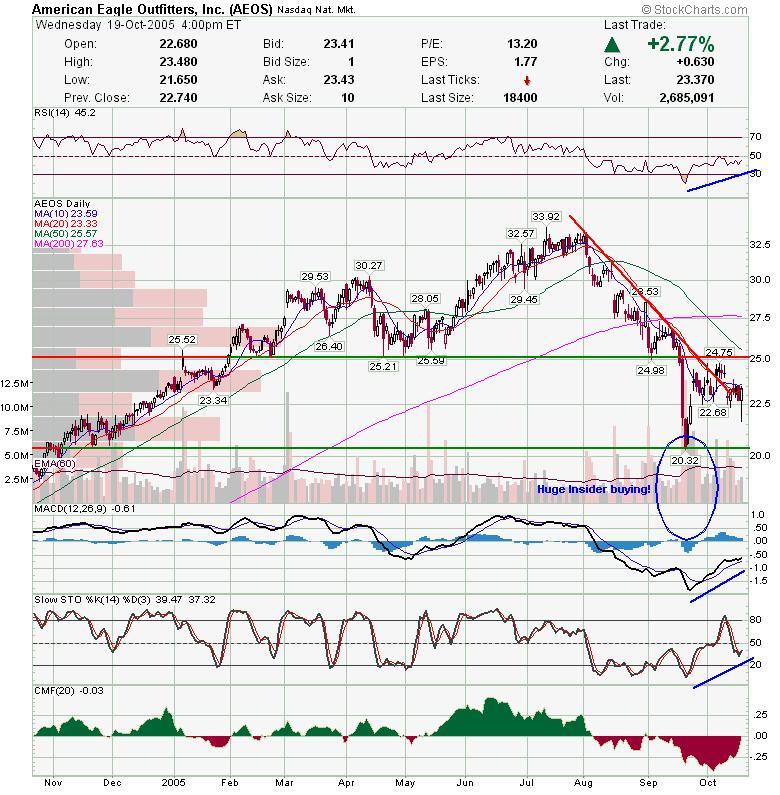

Ford got a little attention today after MOT's impressive numbers yesterday. I've been trading FORD that past two days as I mentioned previously on the blog. Here is my updated chart. I think we see 21.70ish before any trouble. This is the 38.2% retrace and close to 20 day sma. Slow Stoch crossed back over 20 and CCI back from under -100 (see previous post for my signal).

IPII finished very strong although volume was quite choppy today. Wilma looks like it will become a hurricane so IPII has a good chance of continuing to run. Careful near 20.
I decided to play HOM today which worked out well. I think we get follow through tomorrow as HOM will turn up on a lot of stock scans tonight. Hit a new 52 week high and finished higher on strong volume. Below are the intraday 5 minute and daily charts. Volume is in all the right spots on the intraday and look how well it held the 9 and 20 period ema's. Very solid and clear signals.

Ford is about to give a buy signal based on previous CCI, and Slow Stochastics. Previously, CCI gave an early buy signal on the dip near -200. Then slow stochastics completes the buy signal by hooking back from under 20 to over 20. There have been fake outs on the slow stoch signal before, and FORD did it again on this pull back. Also, FORD has been a little frisky lately so shorts may be getting antsy. However, THERE is a big difference right now that should not be minimized. FORD was in a healthy uptrend on all previous buy signals, as they coincided with bounces off the trend line. This time FORD is in a down trend and is bouncing near 200 day sma. There are a lot of people underwater here, so trade carefully.
DT
I think the market tone has improved a little, however, this is still a very precarious environment. The Nasdaq and SP600 climbed back into their previous channels, however, there is still a lot of resistance overhead. Also, volume has been pathetic. I think we may see an up day tomorrow on the NAS due to the way it finished today. It was down all day and closed green with no real catalyst. Here are the charts I'm looking at. I have been daytrading mostly and will continue to cash in earlier then normal until the market either resumes it's downtrend (more likely), or breaks higher.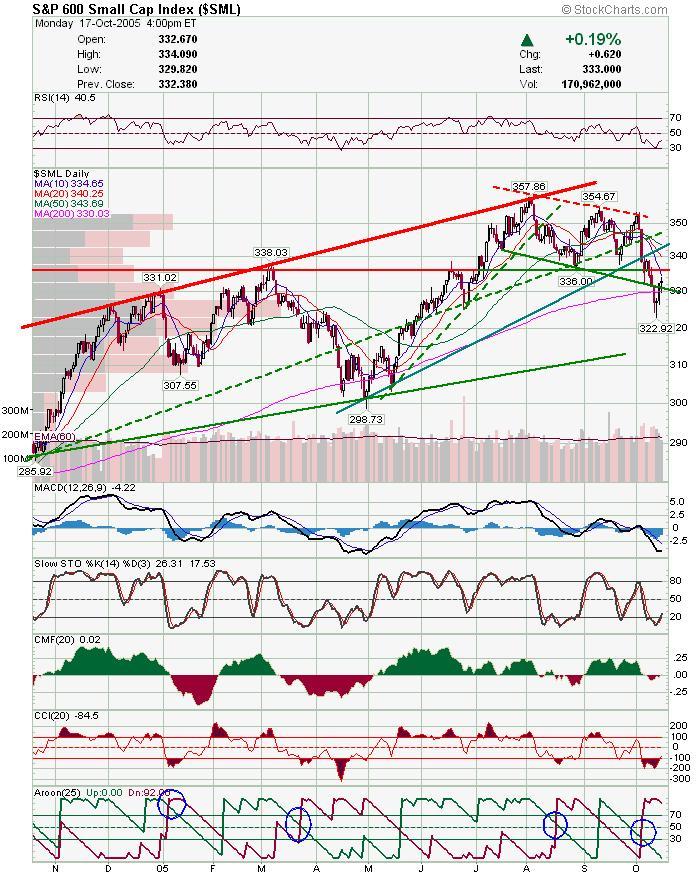

Boom's last two daily candles have had long lower shadows, and the intraday chart shows a possible reversal. This is a 5 minute chart showing consistently higher lows and boom never closed a 5 minute bar below the 20 period ema after 11:15am on Friday. Volume has been very light though.
DT
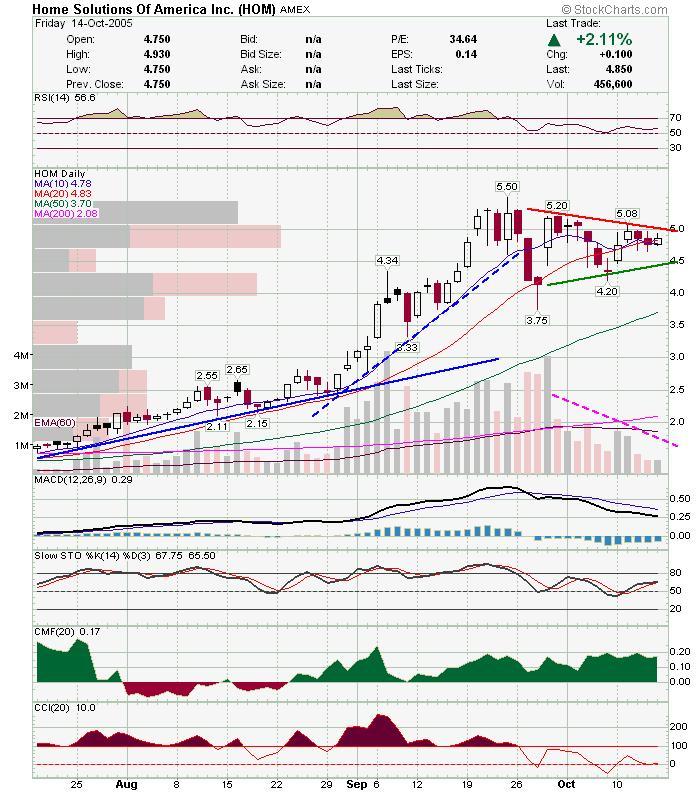
HOM Chart is looking decent, and hurricane plays may be back in vogue this week. Daily chart drifting in a consolidation pattern and 60 minute chart may be giving a preview of a triangle break.
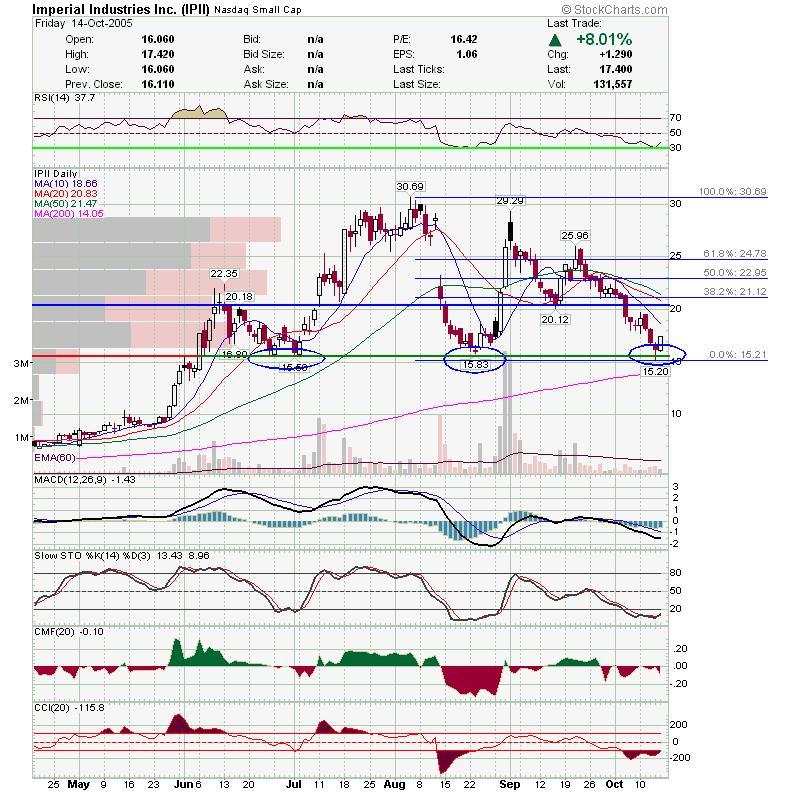
This chart is a little messy and resembles a head and shoulders (volume doesn't confirm it), but it looks like it has found major support again. May be a possible daytrade with a target near 18-20 on a squeeze. The only reason I mention it, is cause of the possible hurricane brewing and the interest it may garner.
Subscribe to:
Posts (Atom)


