Here are a few pictures I took of what Hurricane Wilma left us in South Florida.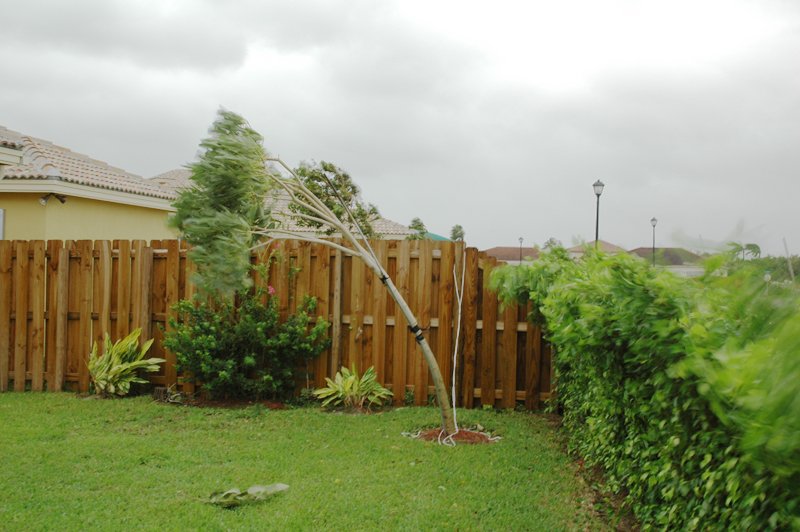 This tree is just being held in that position by sustained winds. It's a small tree, so I guess that's why it held up.
 This is a construction trailer that rolled over twice before stopping on the electric post. Somehow, it didn't knock down the post.
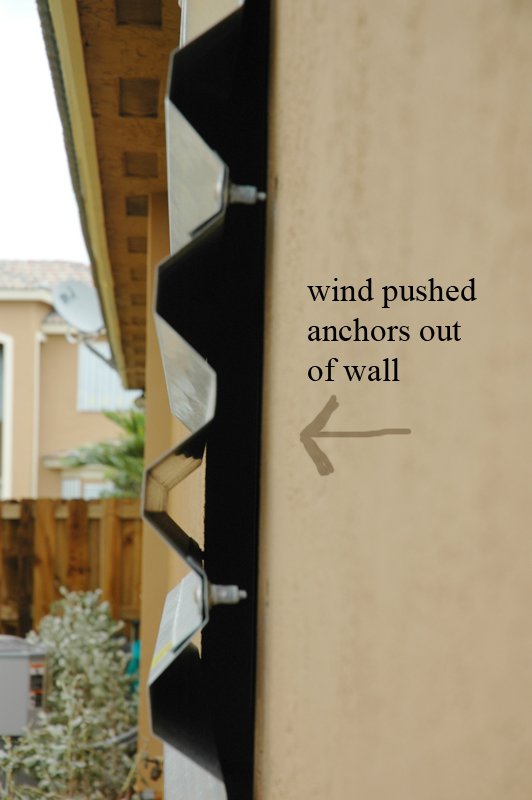 I took this during the storm. The wind is holding the shutters away from the wall here.
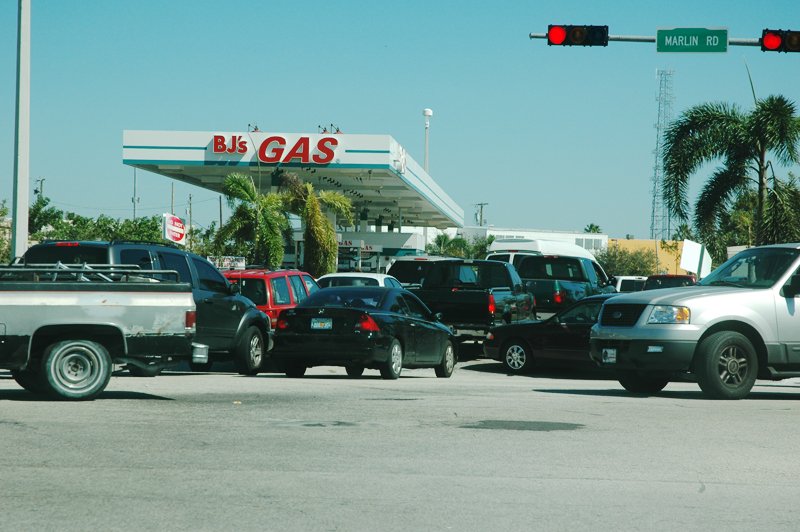 Always get gas before a storm or you risk ending up in total mayhem after the storm.
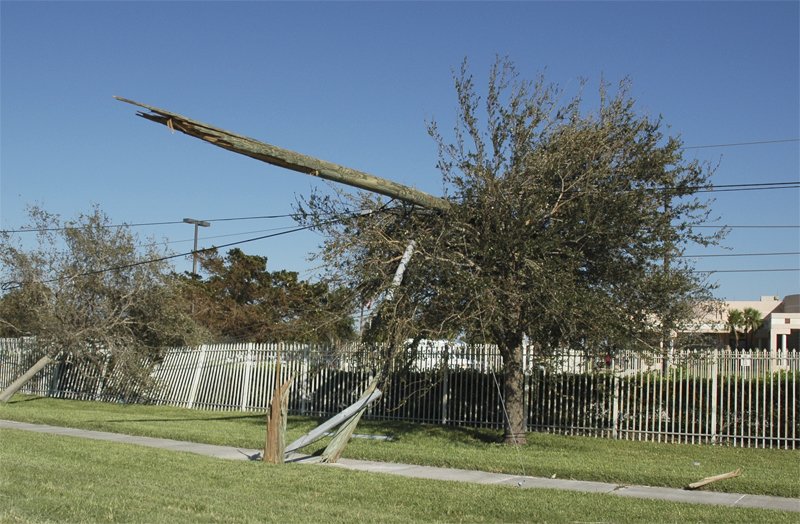 This is an electrical post that just snapped near the bottom. I don't know how the post snapped and the tree right next to it managed to stay rooted.
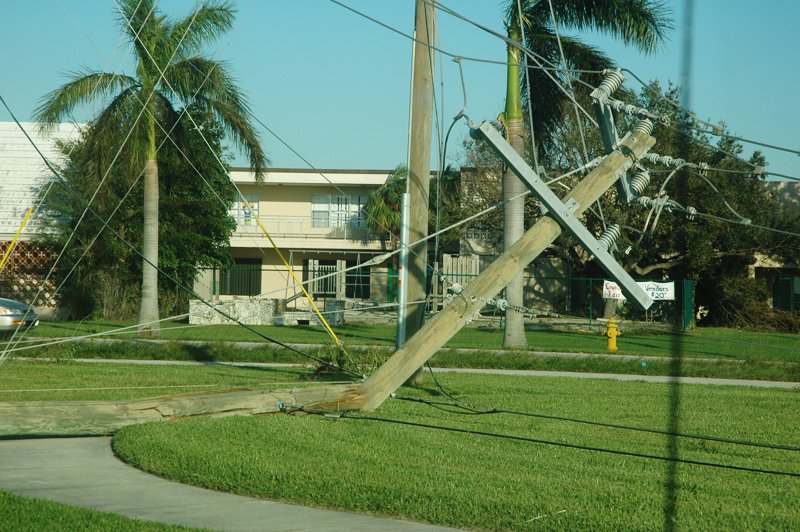 This is another electrical post that fell over. It's amazing how strong the winds are to be able to knock down these kinds of objects that don't have huge wind fields.
I may not be posting tomorrow or the next few days depending on whether I lose power due to the hurricane we are expecting here in South Florida. Good Luck to all of those caught in the storms path.
DT
I don't know if bird flu will dominate the press again this week, but I do know that this chart looks promising. Classic three bar pullback to support. 60 Minute chart show break of downtrend. There is resistance here, and I would tread carefully taking profits wherever I could, but this still has a chance of exploding. Also, I hadn't noticed before what a pretty uptrend this stock was in before the recent volume expansion.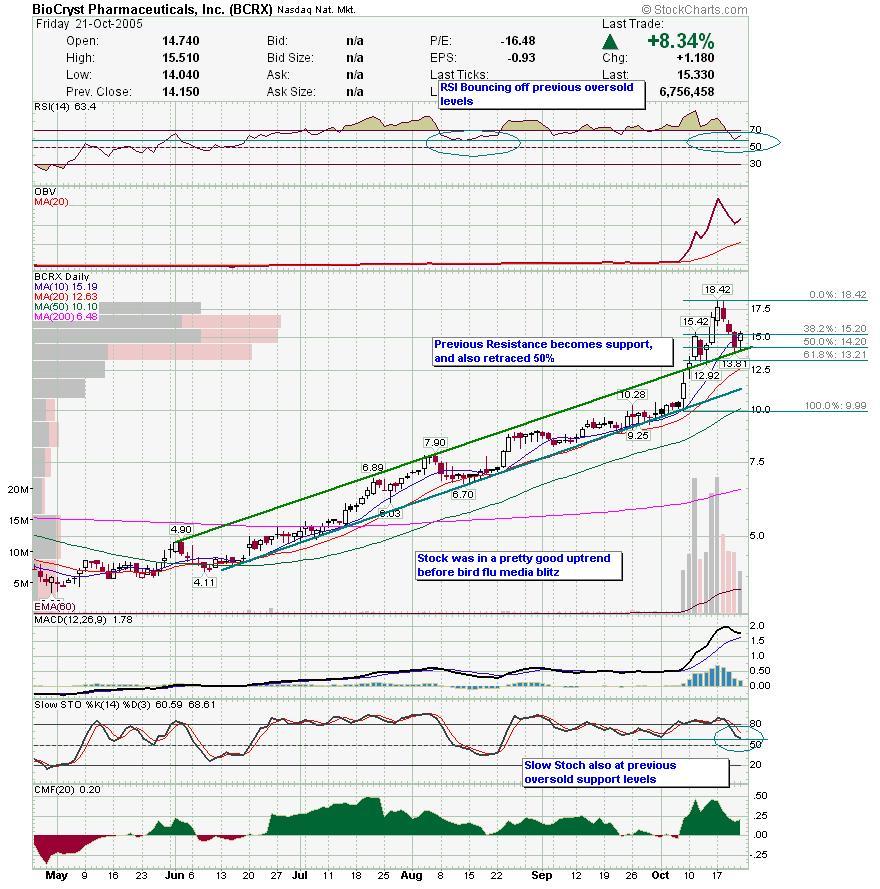

This is a perfect example of why it is important to look at different timeframes to increase your odds of making a succesful trade. At first glance, the VPHM chart doesn't really look that exciting. Yeah, it's on support and volume is diminishing, but MACD is bearish and stock looks like it may go either way.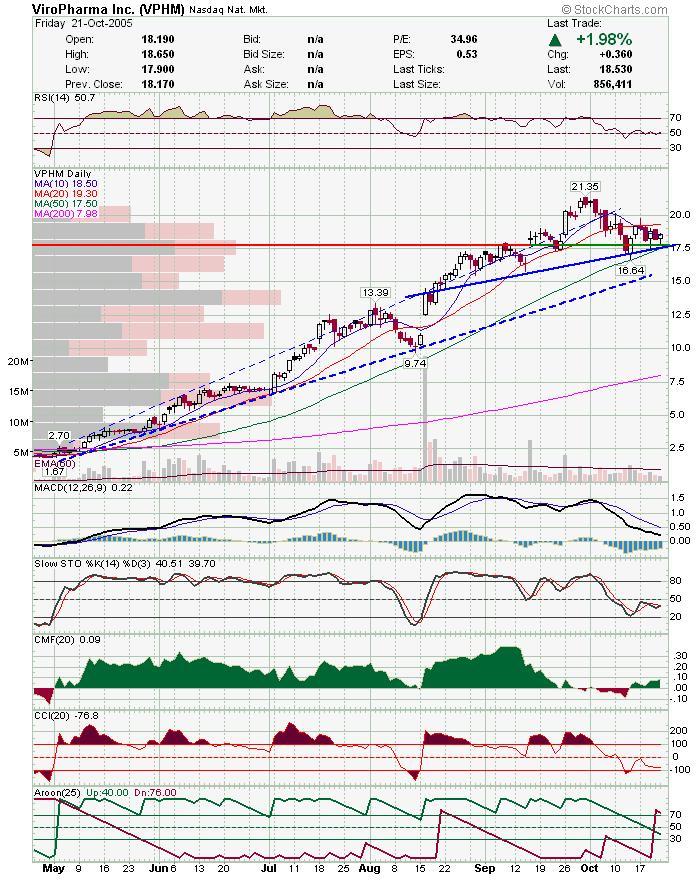 If you look at the 60 minute chart over the last ten days, it starts to look a little more promising. That's a beautiful contracting triangle and it's testing the upper trendline for the third time. A lot of things in this market work in threes and usually the third test of resistance is the most important. Also, triangles are resolved in 5 waves several times, and this looks like it may be ready break the trendline.
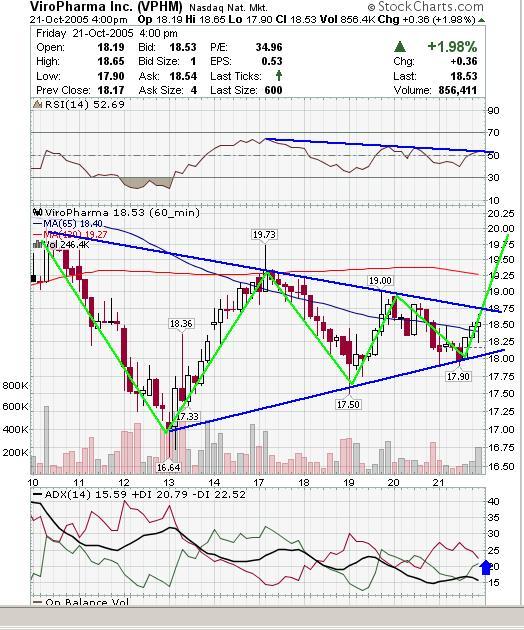 When I look at the intraday 5 minute chart... I see a downtrend channel that was finally broken. Look at how the volume finally increased towards the bottom of the channel, and then after breaking the 200 bar ema, it came back for a retest, and then the volume really kicked in helping it reclaim the 200 and close near HOD.
I think if you put these three charts together, the evidence suggests that the probability for vphm's next move should be up. However, there are clear places on the 5 and 60 minute charts where you can see a breakdown before having to wait for a test of the 50 day sma, etc. Good Luck,
DT
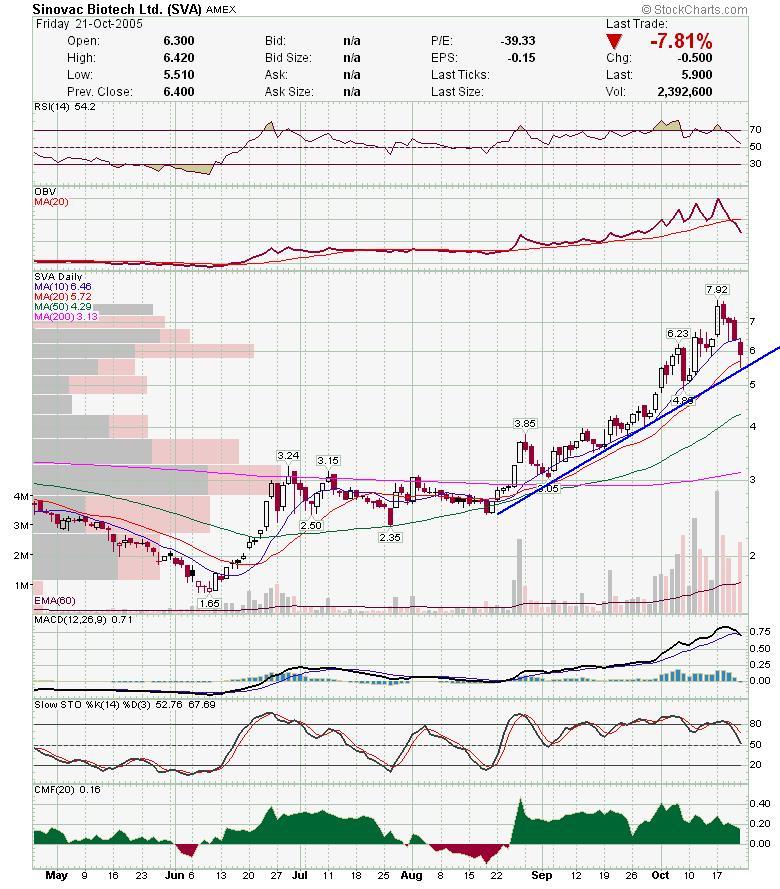
Here's a quick chart on SVA. Could be a nice bonce on support. I would wait for confirmation though that the bounce is for real.


