SNDK came down to the trendline and reversed to close over the 38.2% fib retrace. I think it's headed up from here as the tech's should lead if we have a rally to close out the year. Keep an eye on aapl and goog too. As we head in to window dressing season, jealous fund managers will drive some of these stocks.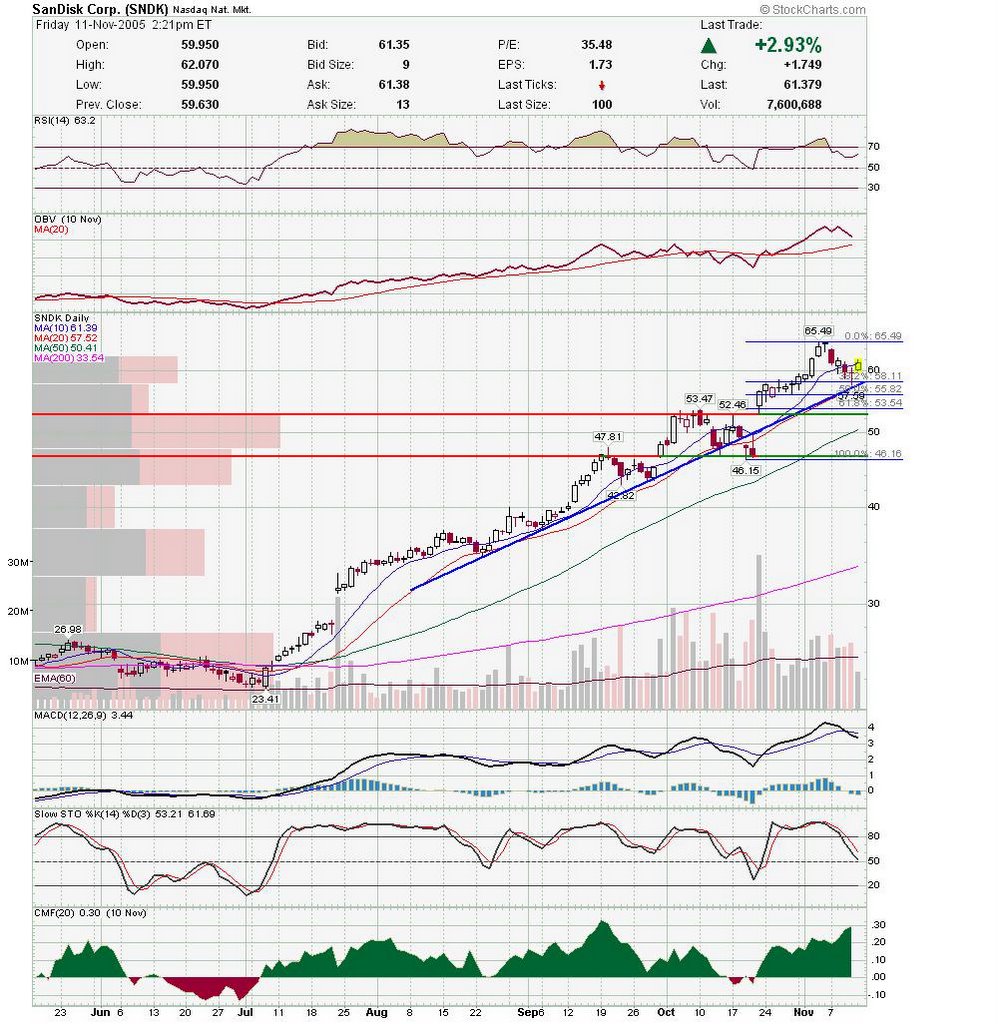
AOB continues to act well. Earnings are Monday, so this may run through then.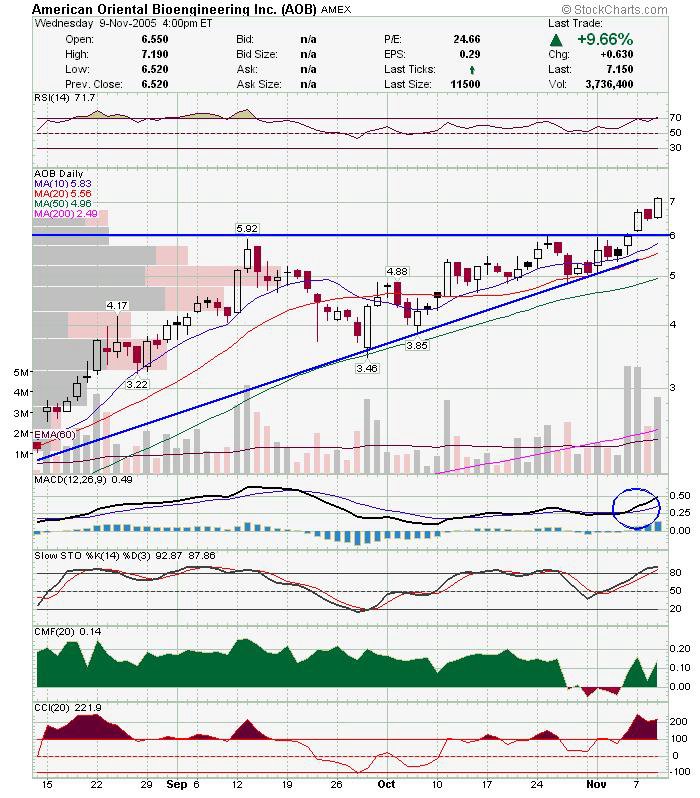 AIZ also continues to act well. Trading in a pennant formation right now, and closed at an all time high today. This is a long term winner.
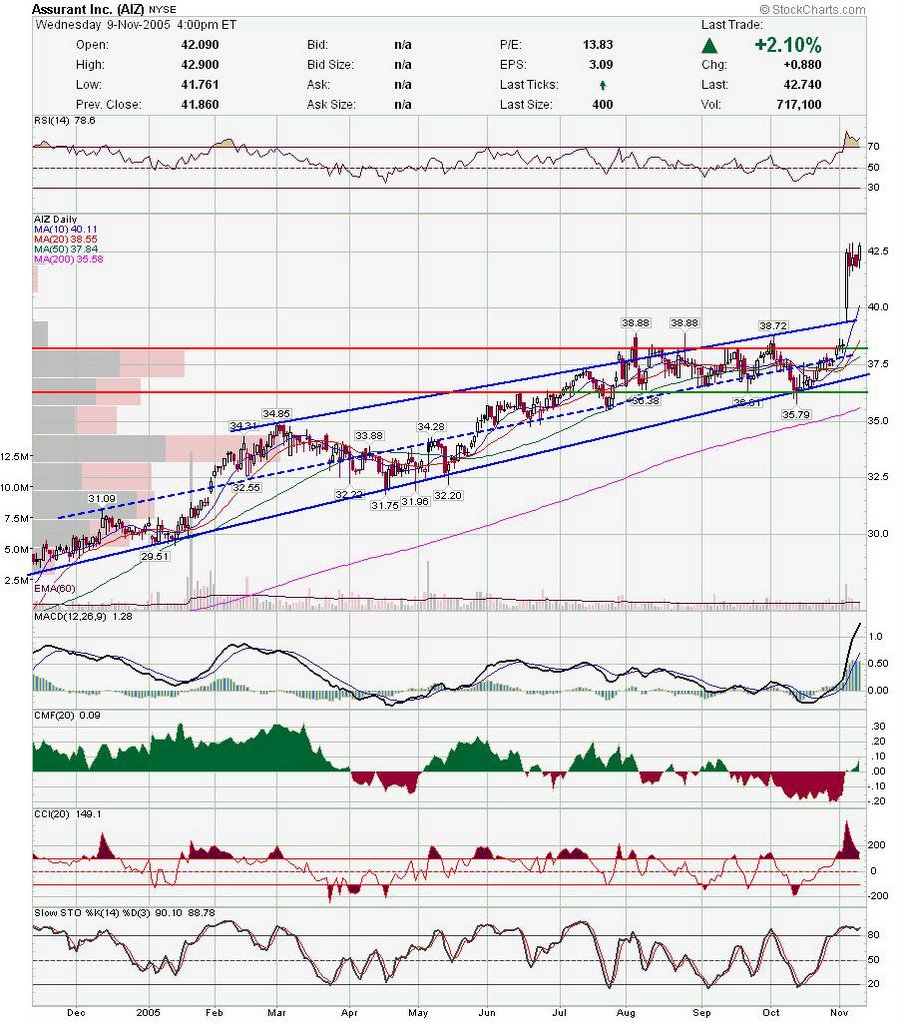 I'm not sure what to make of VPHM at this point. Today the stock closed lower, but the real issue happened after hours. VPHM traded down to low 20's on what i think was news related to future competition. It is unclear what sparked the selloff, and at least there were enough buyers to push it back to 21, but the bottom line is that it settled down a point lower then the official close. I won't pretend to tell you that I know what will happen tomorrow, but I expect a very volatile pre market and open. What I will say, is that Market Makers are the best traders in the world and are ruthless. They will try to exploit this, so be on your toes. If it runs up for some reason, it will probably be to unload excess shares, and if it tanks, it will probably be to snatch your shares cheap. There is no easy way to trade this if you are a short term holder. If you are long term, then buy shares where you think is cheap, as VPHM will probably trade higher in a weeks time. Good Luck,
DT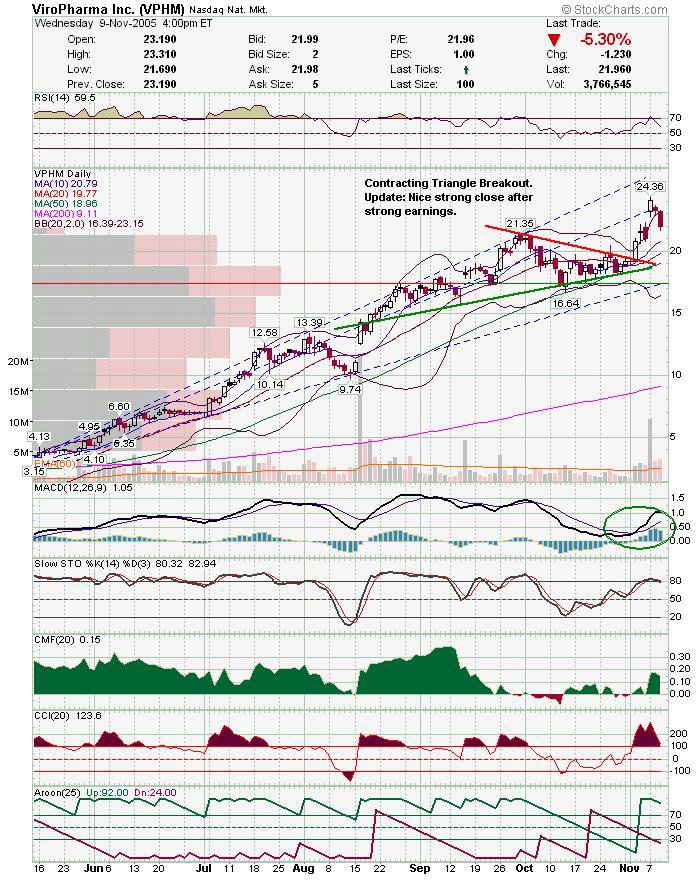
As promised earlier, here is an IVN chart. IVN has support at 200 sma and trendline and is at a very low risk entry. If it breaks down, it will probably be soon, if not, it would be the third test of the triangle which is usually the one that breaks higher. This is a longer term trade.
VPHM broke intraday support today and filled the gap. It looks like it is trying to put a bottom in at just under 22 and the markets look like they want to rally. Wouldn't be surprised to watch this close near 23.
AOB broke to higher ground today. Looking good.
Daytrading AAPL today as well. I think Nasdaq may finish strong and that would help aapl move.
Closed out HOM for now, will look to buy back.
Also, entered a long position in IVN. I will post a chart later on tonight, but looks like a nice bounce off the 200 sma and a trendline.
Good Luck.
DT
VPHM finished a little weak today, weaker then I expected. As I drill down in time frames, I see some things I don't like, but I can't deny that there is still strength here. My current plan is to hold my core, which I've held since 9.90 and continue day and swing trading it when it's trending. The daily shows a day of consolidation. Tested previous low, but reversed before touching it.
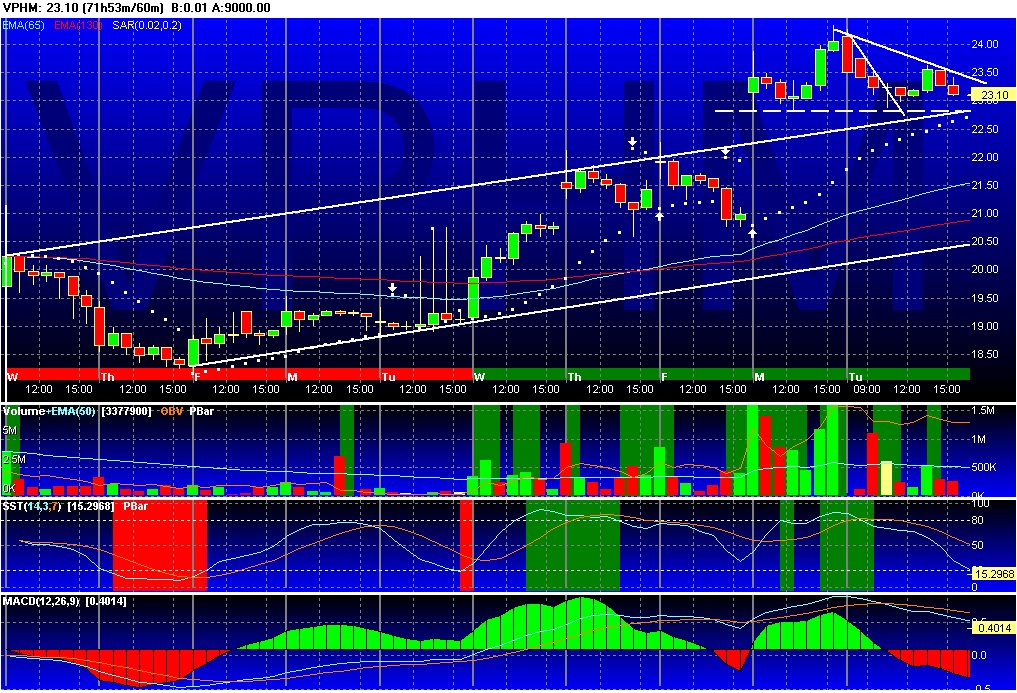 The hourly above chart is also still fairly healthy. It is still above the previous channel and volume was lower on todays pullback.
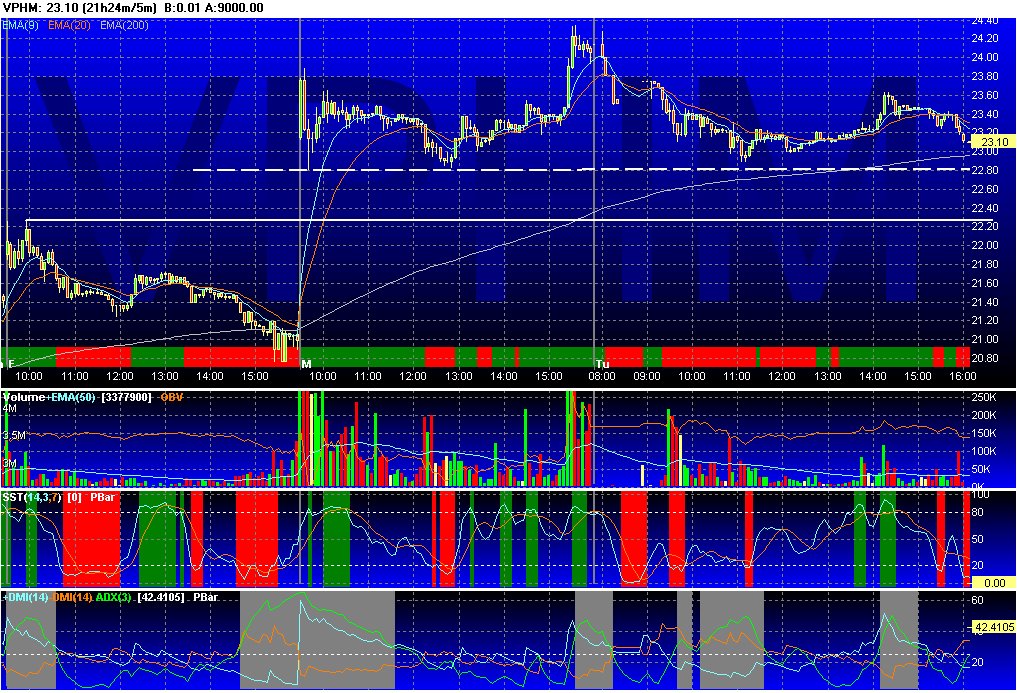
The 5 minute chart above is the one that has me the most nervous, as it is a possible head and shoulders. Keep in mind, that this is an intraday chart, and a breakdown would imply a closing of the gap. If you are swing trading or hold a longer term position, this would be a minor move. But if you day trade large blocks (like I do) then it may be prudent to exit on a breakdown and buy back in at support. Another important thing is to wait for confirmation to either side. The head and shoulders, could actually be a double or triple bottom forming as well. Good Luck.
DT
Here are updated charts for AOB and HOM.
Disclosure: I own shares in both. I took some profits on this trade and will walk my stop up to follow it as it trades this channel. I expect a small pullback at some point before it hit's the top of the channel. My current plan is to trade the channel only and sell at resistance. I can always buy back above the channel if it does rally.
 AOB traded down a little today. It had a failed triangle on the intraday, which it then reclaimed. I think it was just soft on the general weakness today. I think this stock has good potential for a strong move, but will trade it carefully.
I noticed a lot of charts that look tired today. While I'm not really bearish yet, it looks like the market is digesting it's recent gains. The smallcap index has fared worse then it's big brothers which could be signaling a sector rotation. I am looking at Tech being the leaders if there is to be a sustained rally to close the year. With that in mind, here is a chart of one of my favorite tech's lately, SNDK.
The daily chart looks like it may come down to the trendline and 38.2% fib retrace. However, it did cross below the 10 day ema and reversed to finish above it. The intraday chart looks a little more promising. Watch for a break of the pennant formation. If it breaks higher, I think it is a playable move. If it breaks down, I will wait and watch for a bounce on support from the dail chart above.
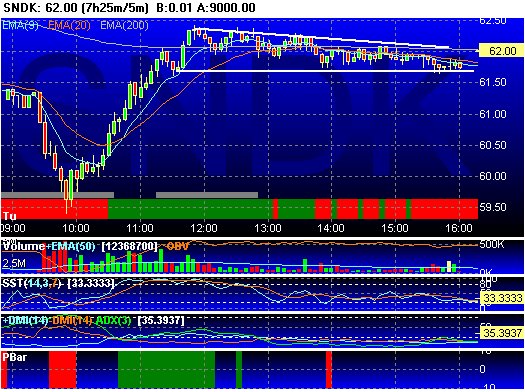
VPHM is setting up for a possible bounce off 23. Looks like a morning star pattern developing right at double support. I think near 23 is a solid entry into VPHM with a stop near 22.70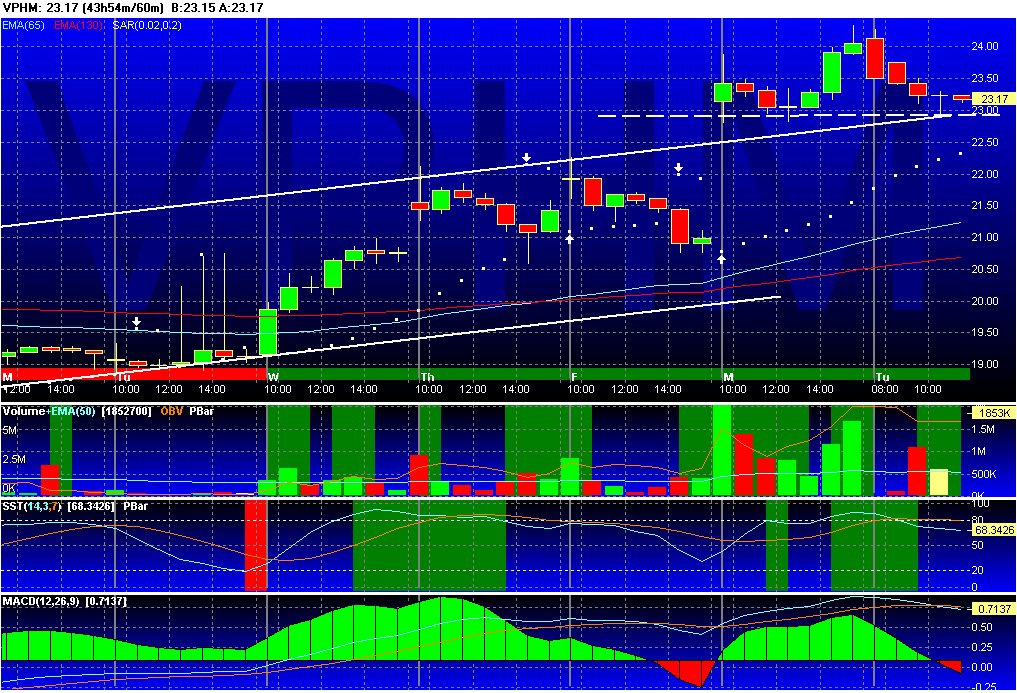
AOB may be breaking out of a triangle base. Keep an eye on it, cause if it breaks, it should be a decent move.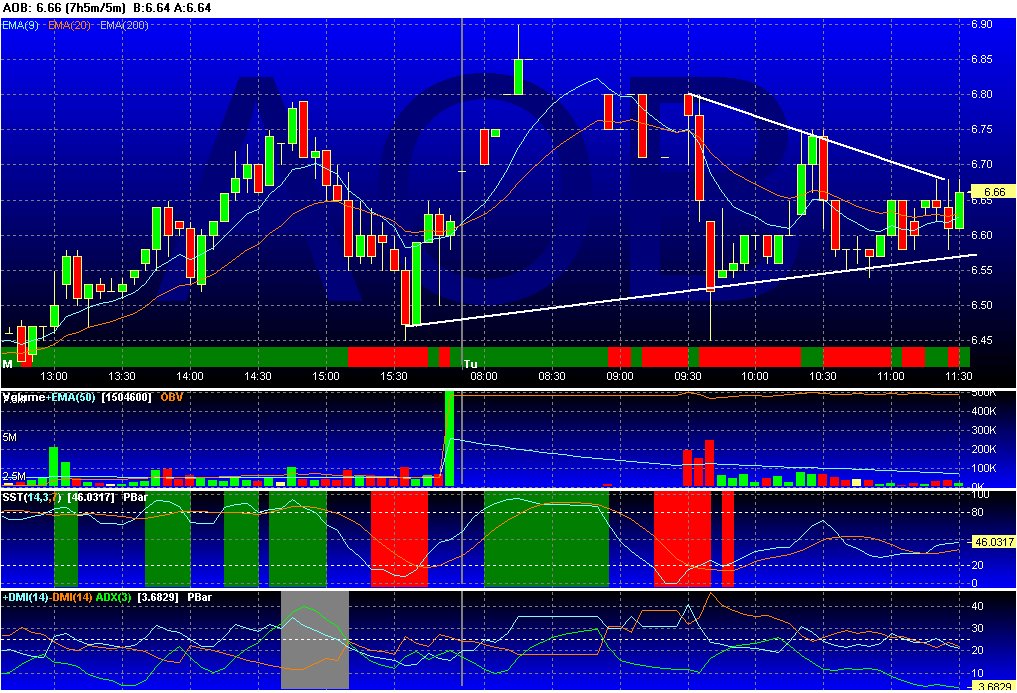
BOOM Earnings are tomorrow and the big question it seems, is not whether earnings will be good, but whether the huge run to earnings will be sold off or not. BOOM is at a 52 week high, but the base has been choppy at best, and had a failed breakout last earnings. BOOM has been pretty strong lately, and RSI shows it, as it is breaking above 70. If BOOM somehow dissapoints, the trendline at near 23 could be support. If BOOM has great earnings, it could see 30+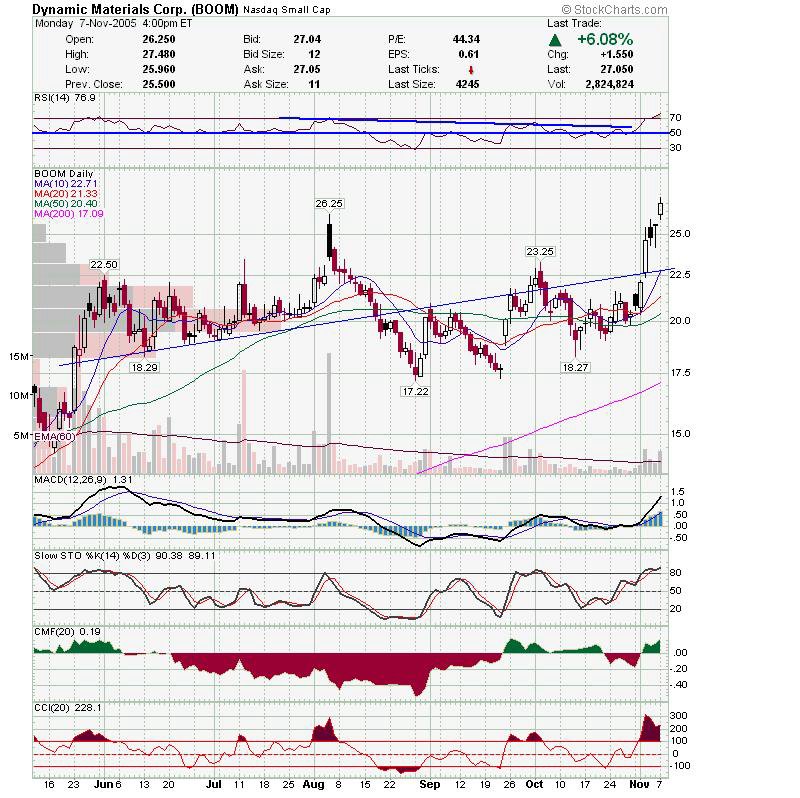 This is the 5 minute chart which show a nice cup and handle breakout today. The bottom of the handle provided a nice stop area for daytraders. The fact that BOOM came back after the sell off late in the day, shows how optimistic traders are about earnings tomorrow. Looks at volume at end of day.
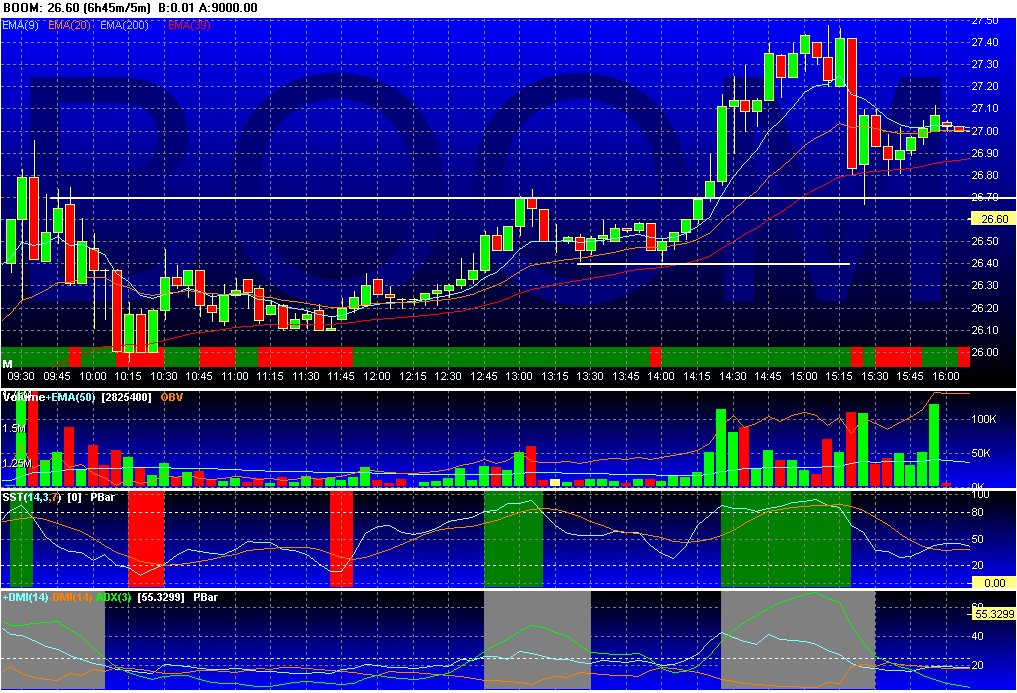
I've tried to post an hourly chart for BOOM to try and show two gaps on the daily chart that have not been filled, but blogspot is having problems i guess, cause i can't upload the chart. If BOOM breaks down, look for the first gap to get filled, but the second may be a reach. Here is a link to an hourly chart.
http://stockcharts.com/h-sc/ui?symbol=BOOM&period=INTRADAY_60&years=0&months=0&days=10&id=p11644051435
Good Luck tommorow for those holding BOOM over earnings.
DT
VPHM never came close to violating the trendline on the hourly chart. It had a very strong close and although there was distribution early, there were signs of accumulation near 23.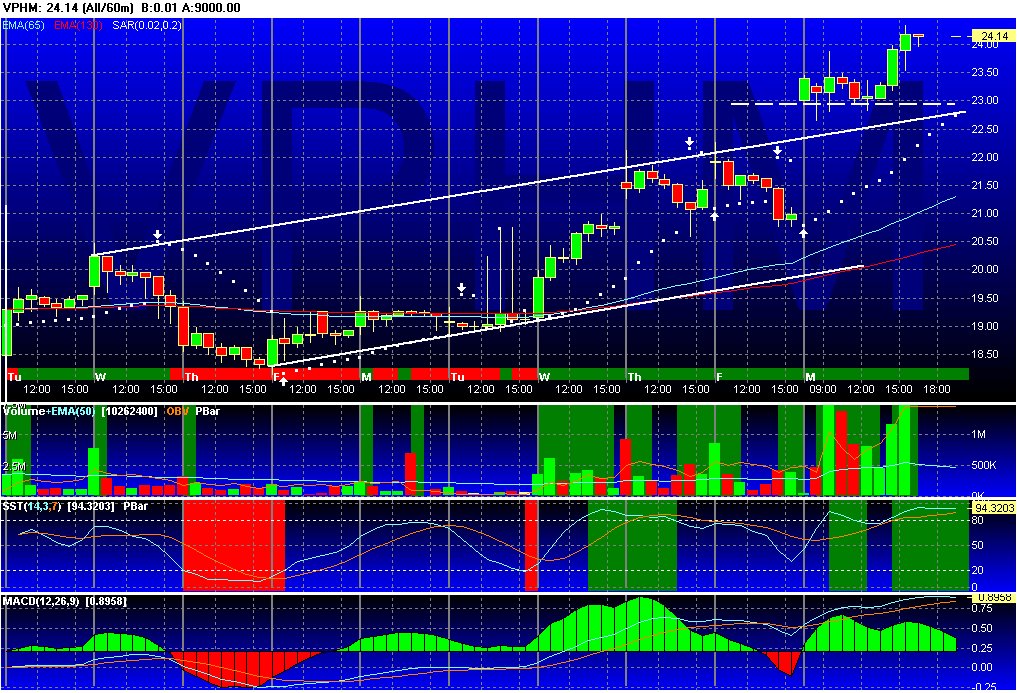 The daily chart shows a nice breakout on huge volume. They reclaimed the mid-line which implies that it may trade to the upper trendline. There is pretty good momentum here, although there was a lot of profit taking today.
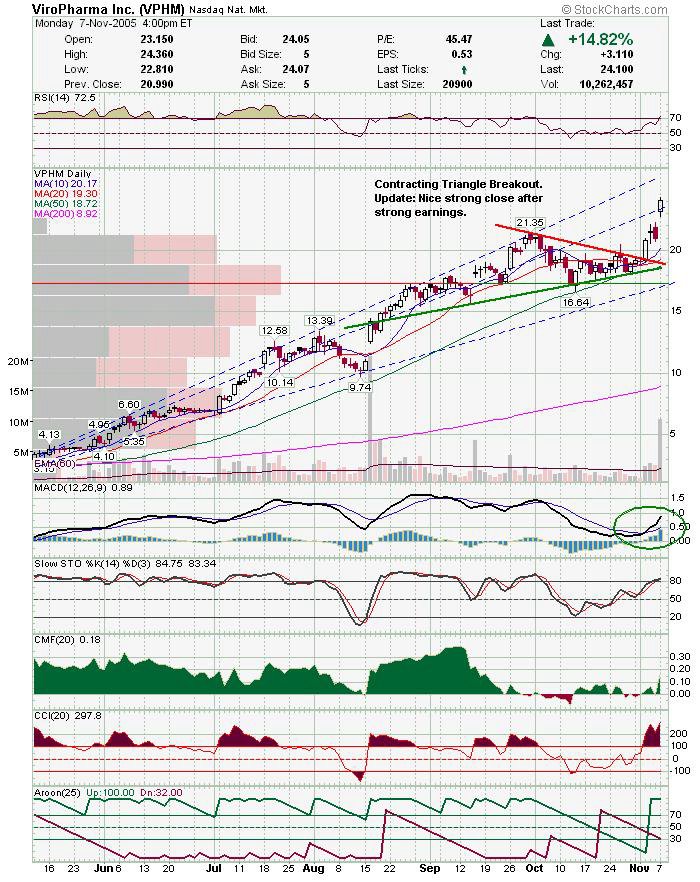
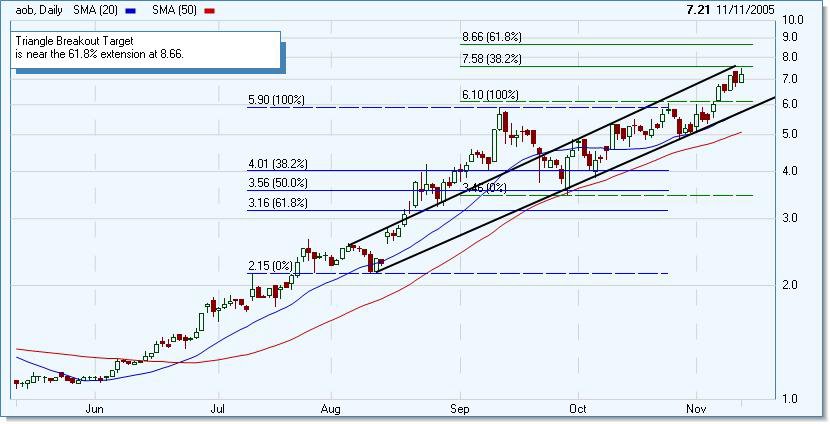
Here are two looks at AOB. First picture shows fib. extension of triangle breakout and the current trading channel. I believe AOB can break above the trading channel near term as there may be a substantial earnings run.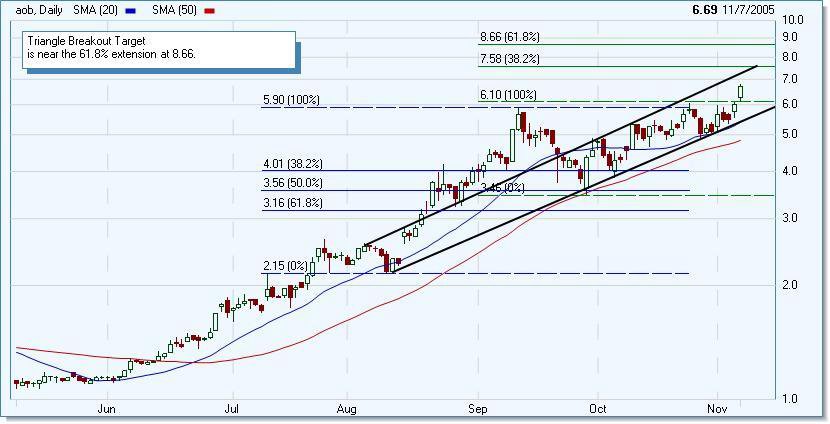 This second chart is my standard chart. Look at the nice volume on the breakout. MACD crossover to.
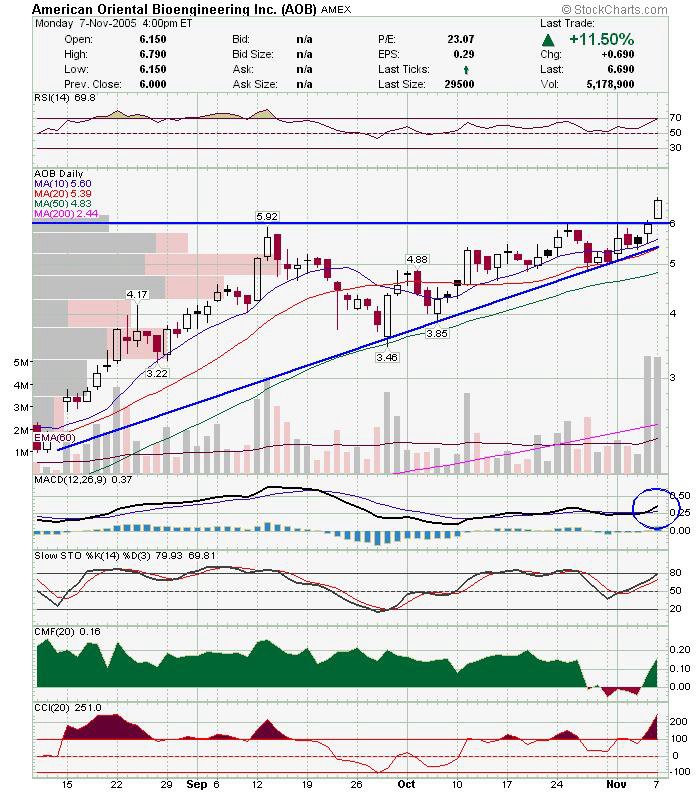
VPHM beat estimates on EPS, revs, and raised guidance. Stock is gapping above all resistance, and will make new 52 week high today. It will be interesting to see what happens leading up to the conference call, but I can't expect anything bad to come out of it, as VPHM has been one of the strongest stocks on the exchanges this year. Path of least resistance is up!! Good luck,
DT
VPHM earnings are out tomorrow morning. VPHM broke out of a contracting triangle suggesting it would trade upwards of 23-24, but earnings tomorrow will decide if the breakout fails or not. I lightened up considerably, as I don't usually play earnings, but there is still some good upside here, so I decided to hold some shares. MACD crossed over and AROON shows new uptrend.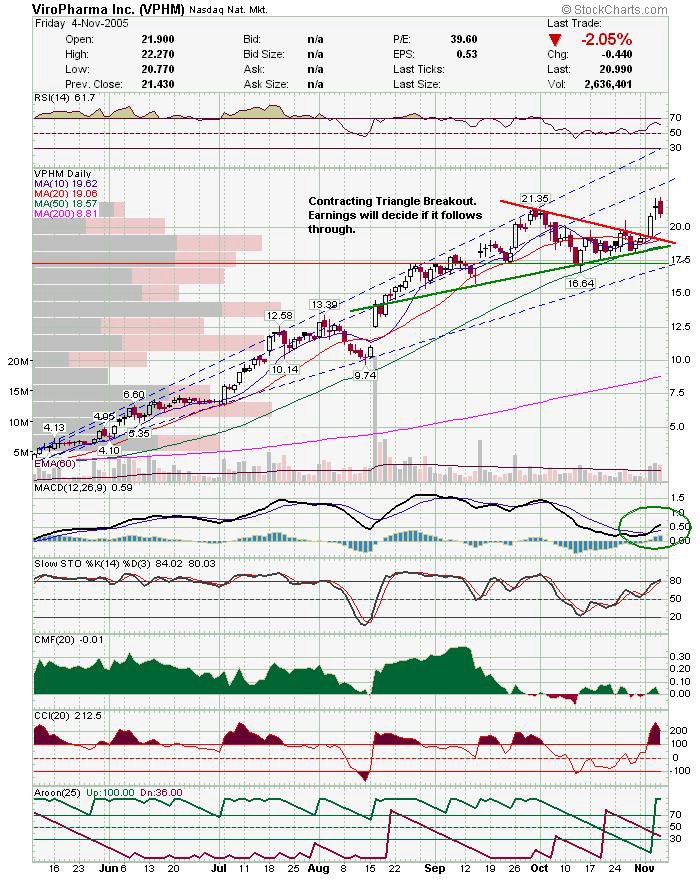 This is an hourly chart that show the current trading channel. If VPHM breaks through the upper range, then I will probably add more shares. If it starts to break down, I will sell at the dotted line, and wait to see if it hold the channel.
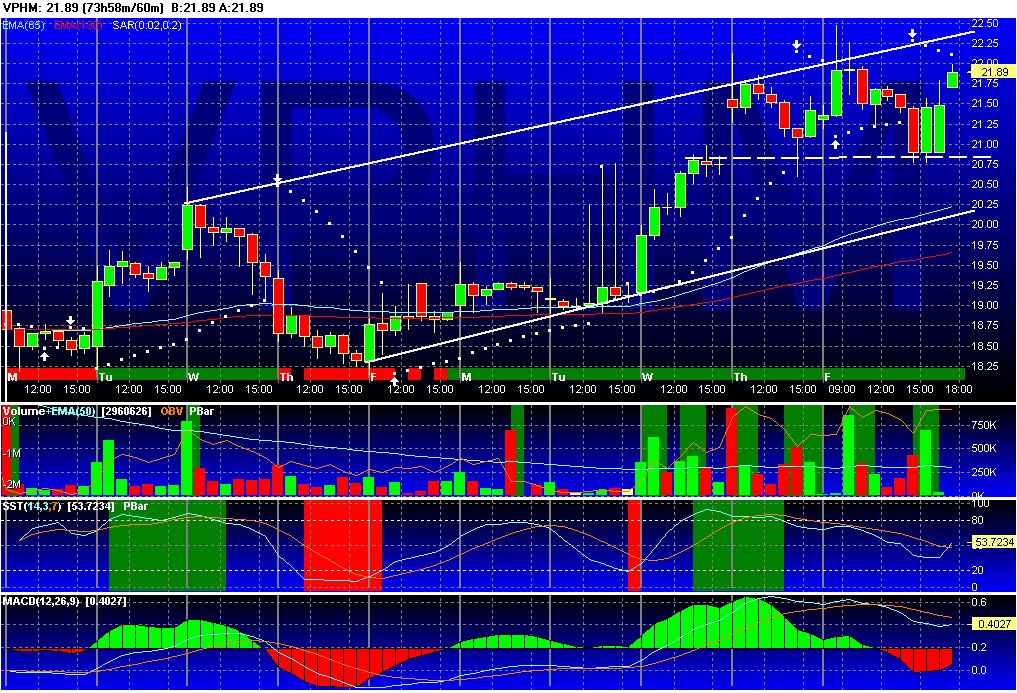 I will post an update tomorrow, as soon as we have some indication of which way this is headed.
Good Luck,
DT
This was recommended on the Boomer's Private Board. Long term uptrend was broken, but looks like new uptrend is starting. Looks like it will come down a little more IMO, but would be a solid buy anywhere near the blue dotted line.
Subscribe to:
Posts (Atom)


