MCX finally closed over 15 and should debut pretty high on the IBD100. I've been posting on them quite a bit lately and the past 2 days have shown a remarkable increase in volume. Not only did they close over 15, they almost challenged their 52 week high. If they make it high on the list, 16's should be eclipsed rather quickly. Here are my updated charts.
Daily looks great and MCX clearly broke a nice base on strong volume.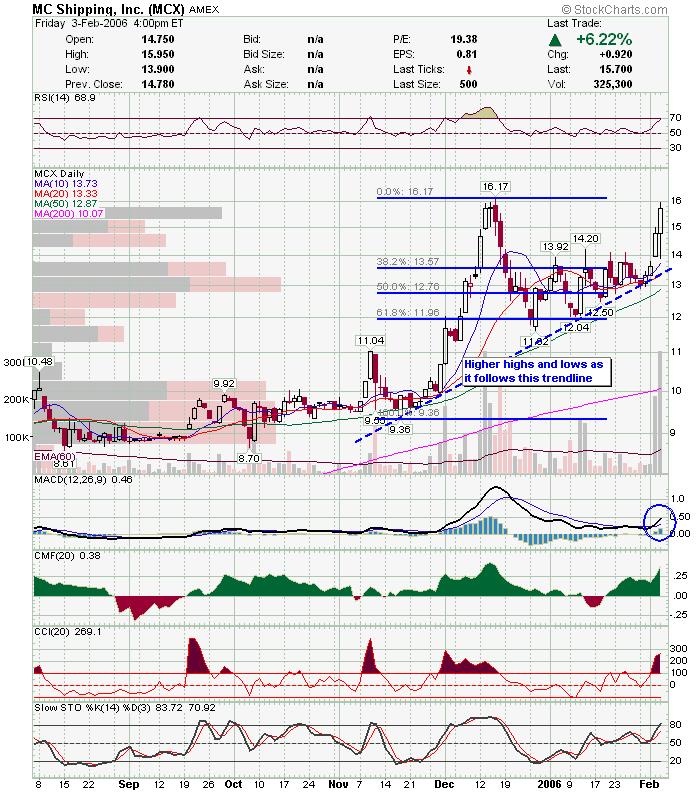 Weekly looks nice with increased volume in the second base.
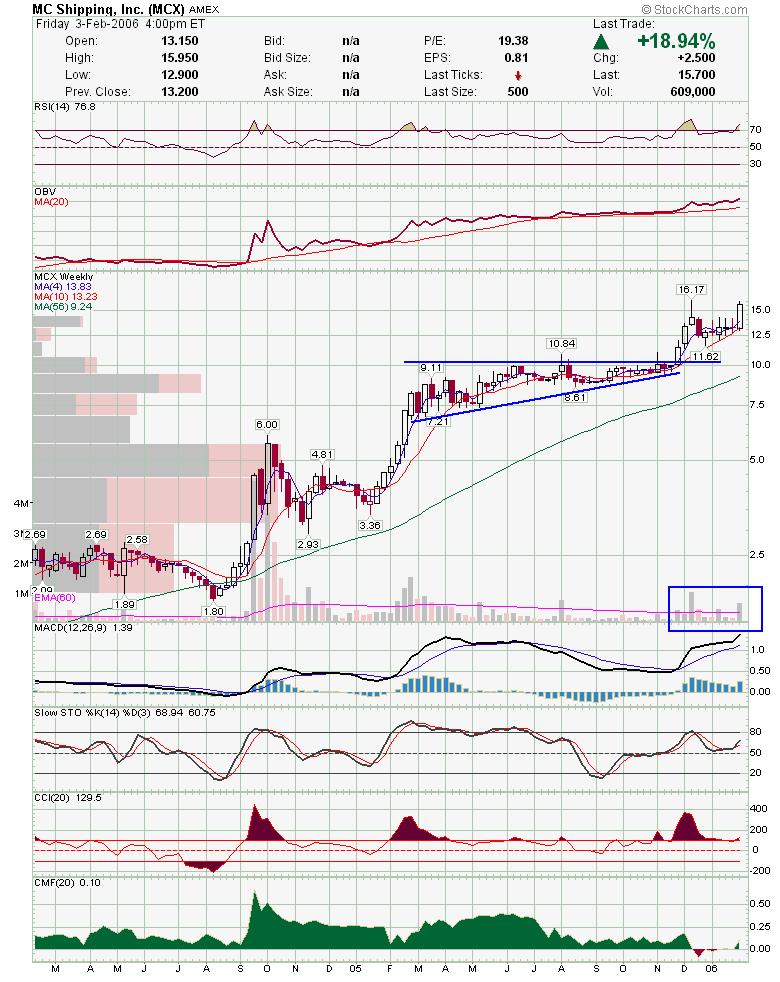 Congrats to those who played MCX with me and good luck in the coming week.
DT
Keep an eye out for stocks holding up on negative days. Today was pretty ugly and almost every breakout failed. Trader Mike posted the best explanation I have seen from briefing.com.
http://tradermike.net/2006/02/are_we_topping
Here are some charts of stocks holding up in the face of the larger decline.
CKCM was down early and retested support, but finished well.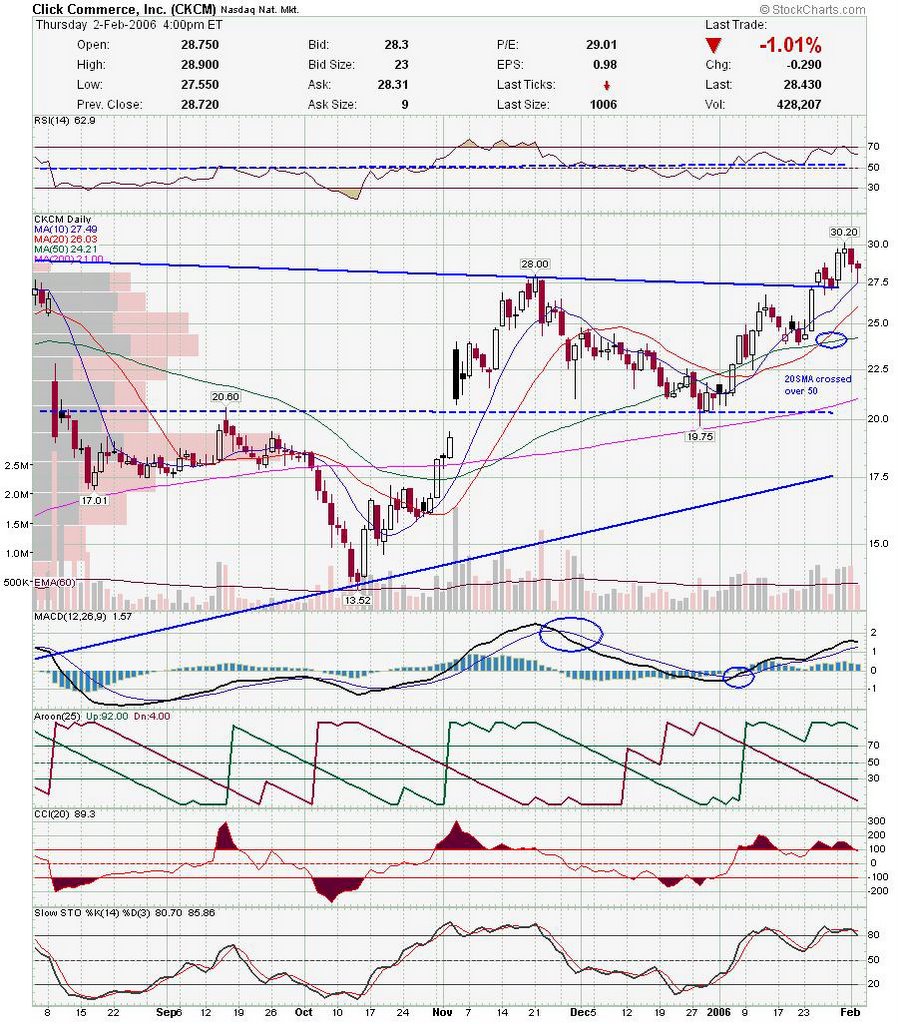 MCX was up all day.
 ABAX has been finding support in low 19's. Watch for next higher high.
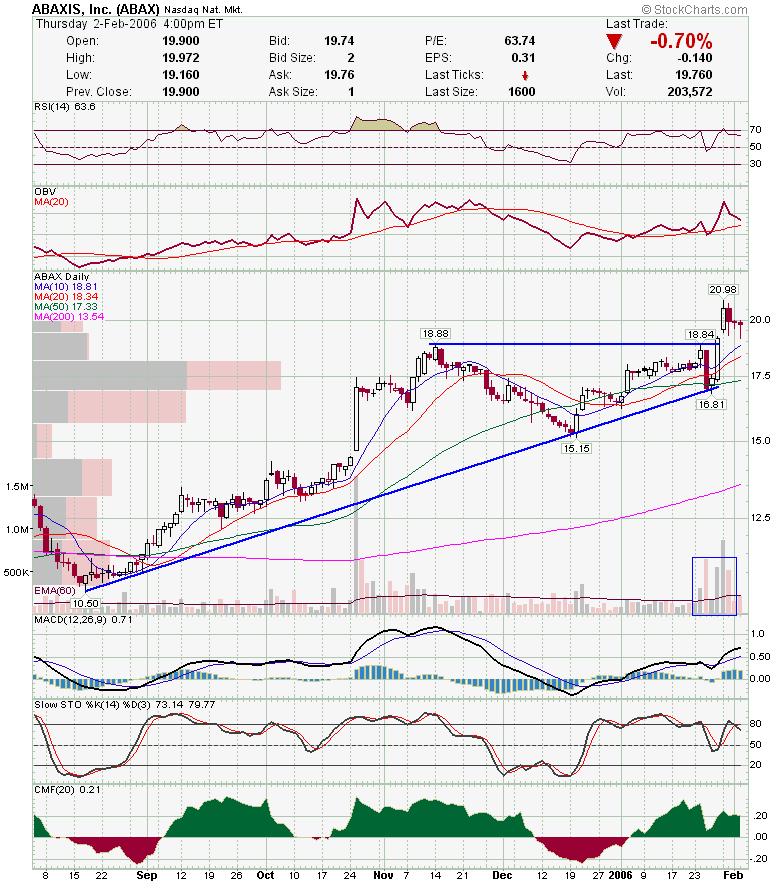 CRI tested support and reversed pretty good.
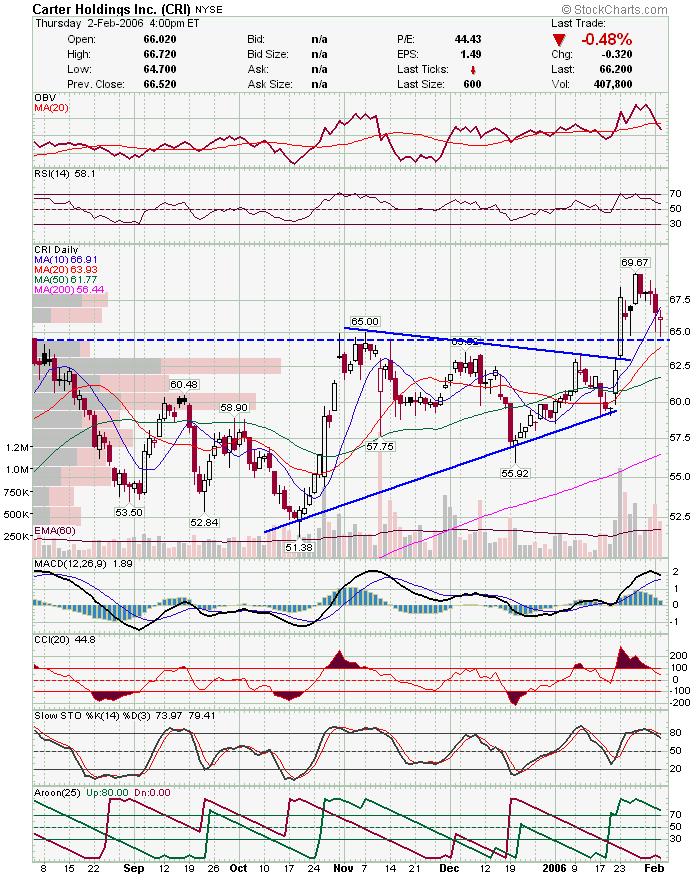 ESRX is absorbing a lot of profit taking.
 GOL is pulling back to support. Held up today and may be ready to resume uptrend.
 GILD gapped lower and held up. It is holding over the breakout point.
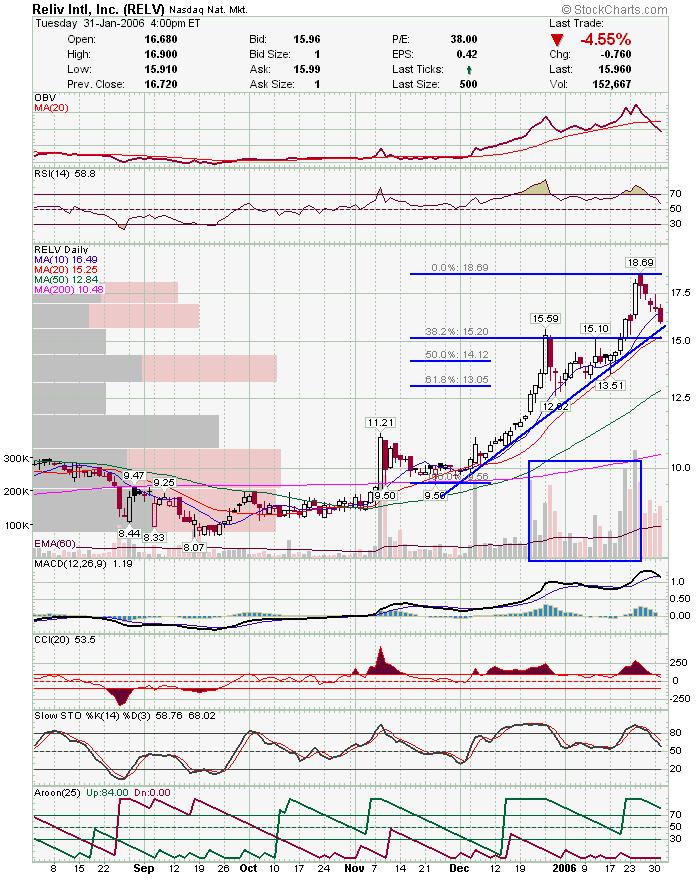
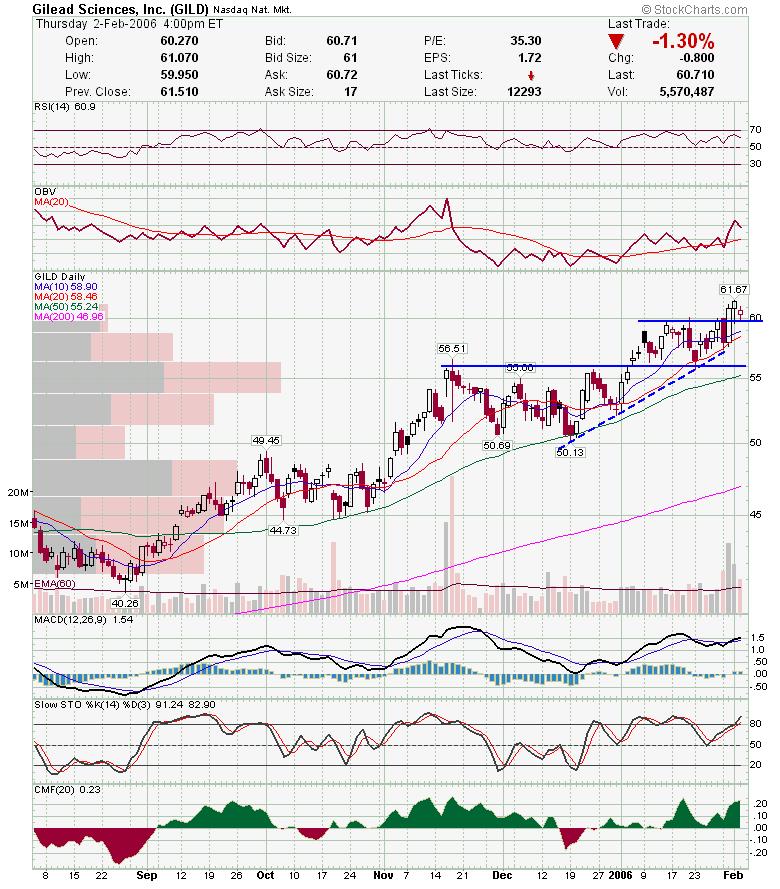 RELV did not want to go down today and is holding the ascending trendline.
Good Luck,
DT
Nice day for indices today. I am seeing more and more good looking charts lately which may be telling us there are more good times ahead. Be sure to read my previous post's as I posted intraday for a change today.
ERS is too over extended to recommend as a swing trade, but it may present decent opportunities for trades the next few days. They were profiled on IBD tonight and should remain #1 on the IBD100. FFIV looks good if nas can break out.
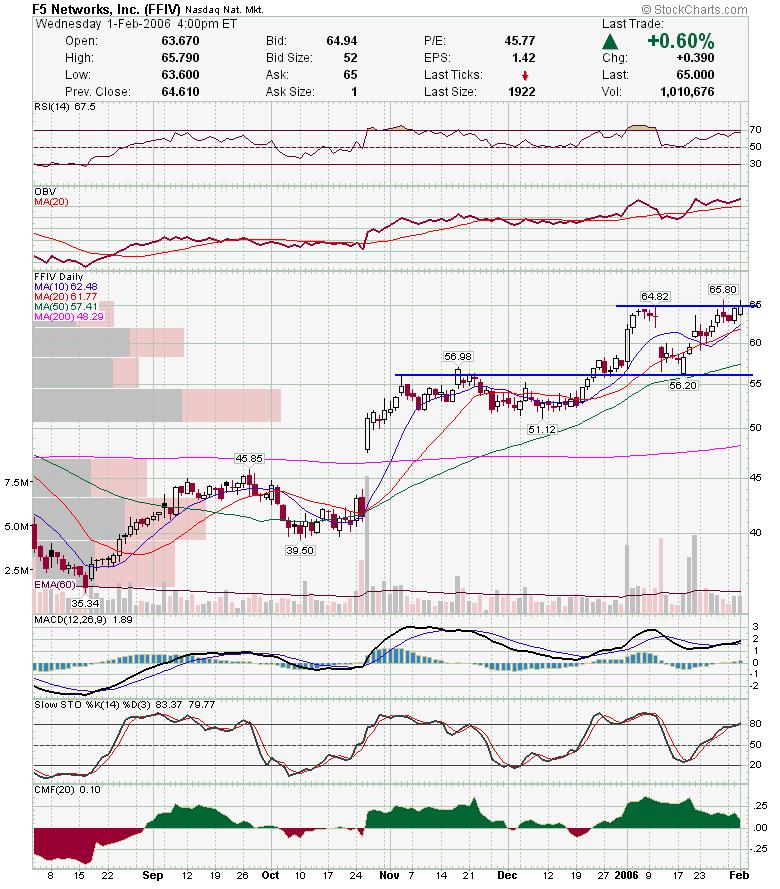 FDRY also looks good if nas holds up.
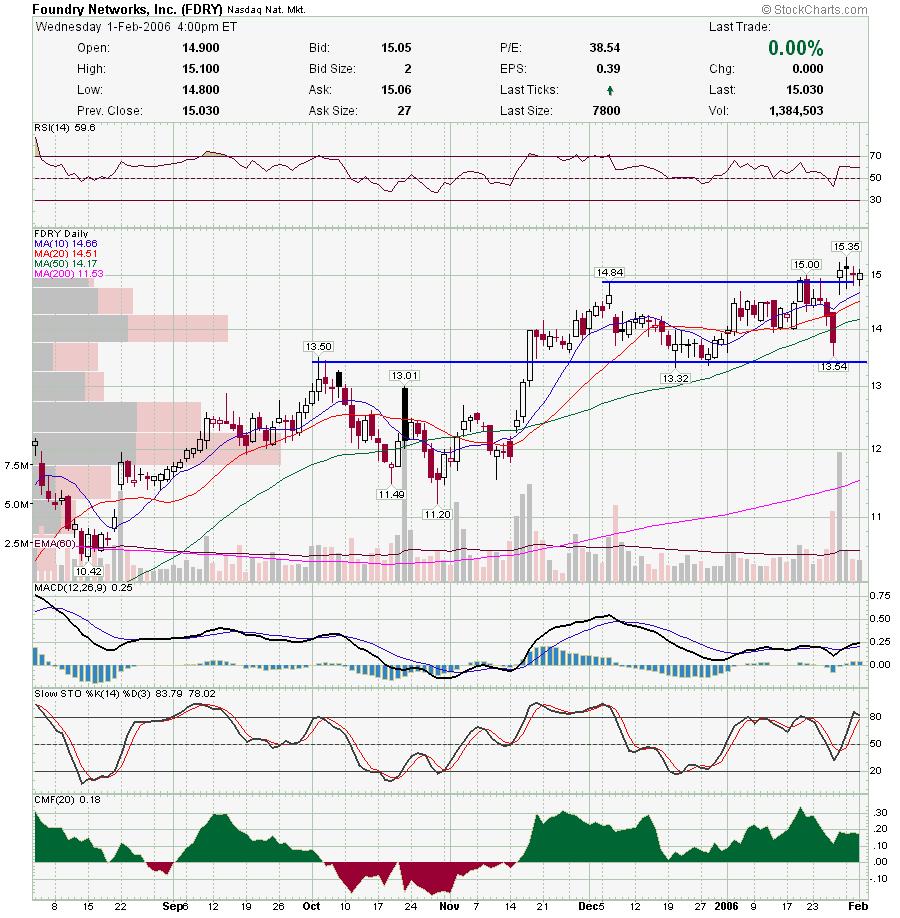 HANS pull back may be done.
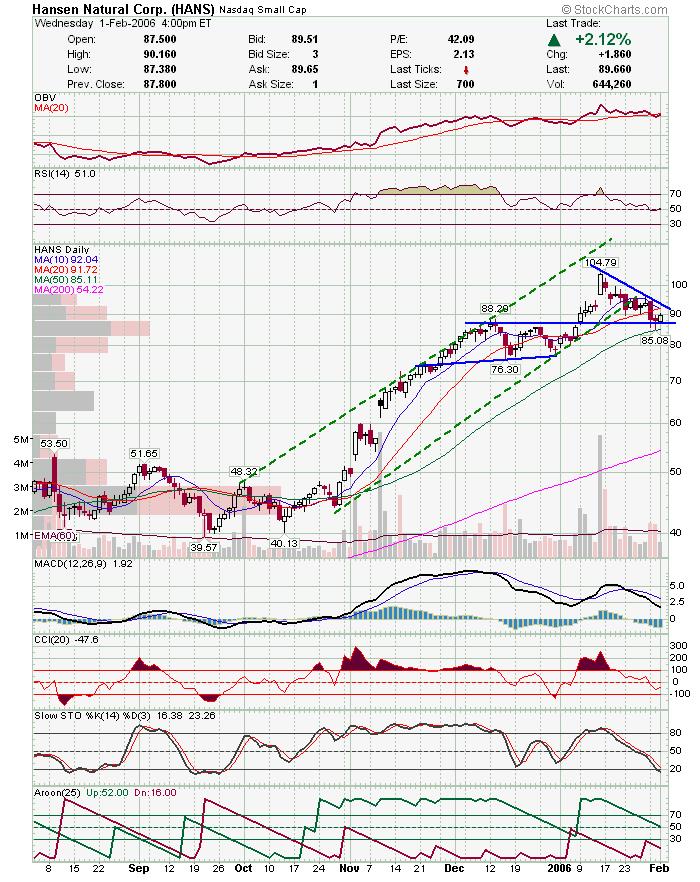 MRVL is setting up for the next leg up. Doji today near expected support.
 RELV is setting up for a bounce off the trendline.
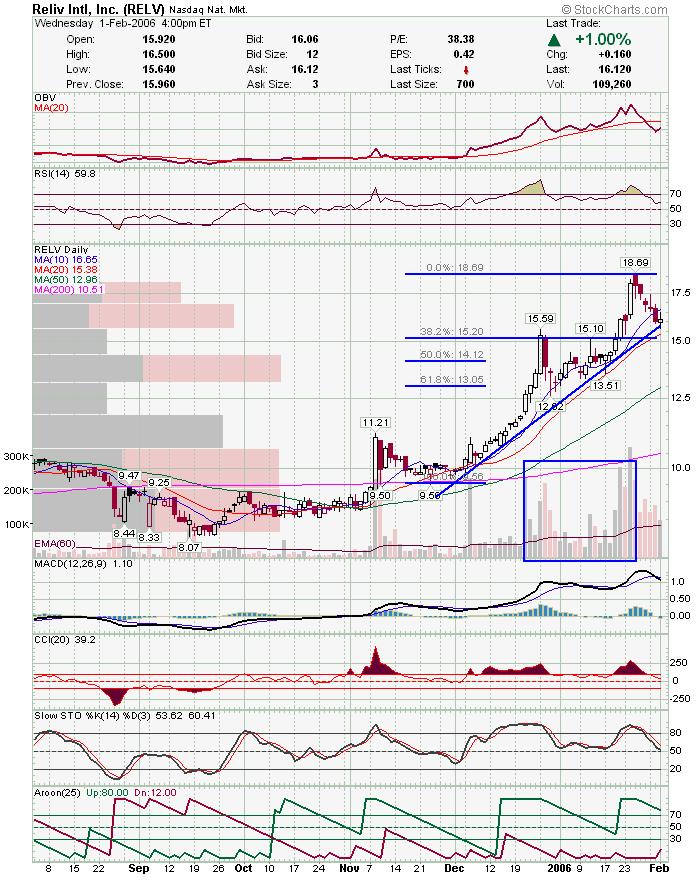 CTSH Profiled on IBD tonight and close to breaking out of this base.
 ADAM broke a pennant type triangle and may retest or overtake highs.
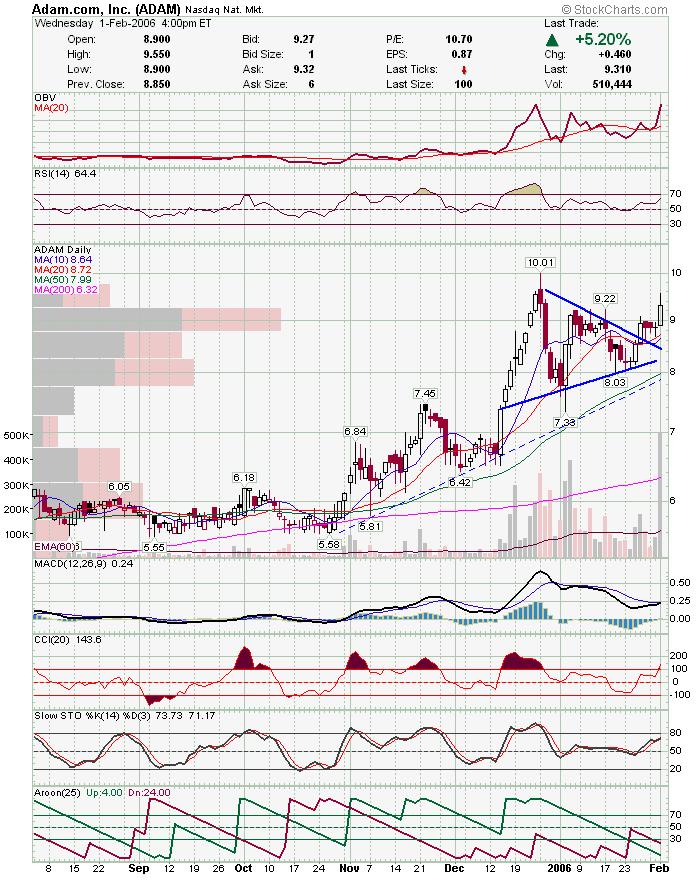 This chart looks good but may be a little extended from the breakout area.
 APLX looks good breaking out of channel on high volume. Careful as earnings are 2/3.
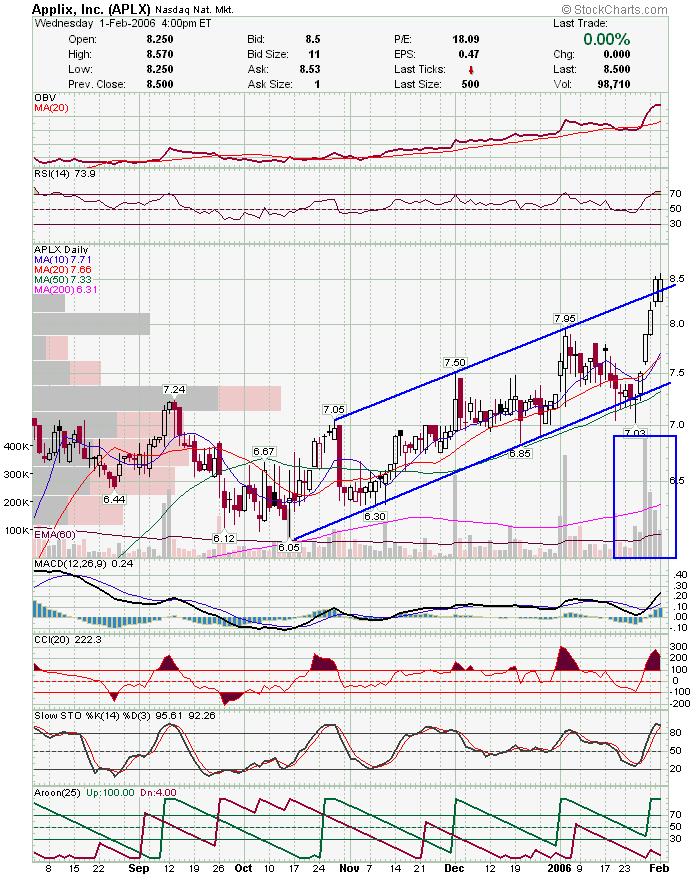
Good Luck,
DT
Starbucks handily beat estimates and was trading higher in after hours trading.
http://biz.yahoo.com/rb/060201/leisure_starbucks_earns.html?.v=1
Here are my updated charts on SBUX. I've recommended SBUX on a few occasions as I felt it would break out this sideways consolidation based on the support it was getting near 30. Looks like earnings are enough to break out of this consolidation and take SBUX to it's first target of 36.
Here is the daily chart. RSI downtrend is broken and MACD has crossed over. Look at last MACD cross.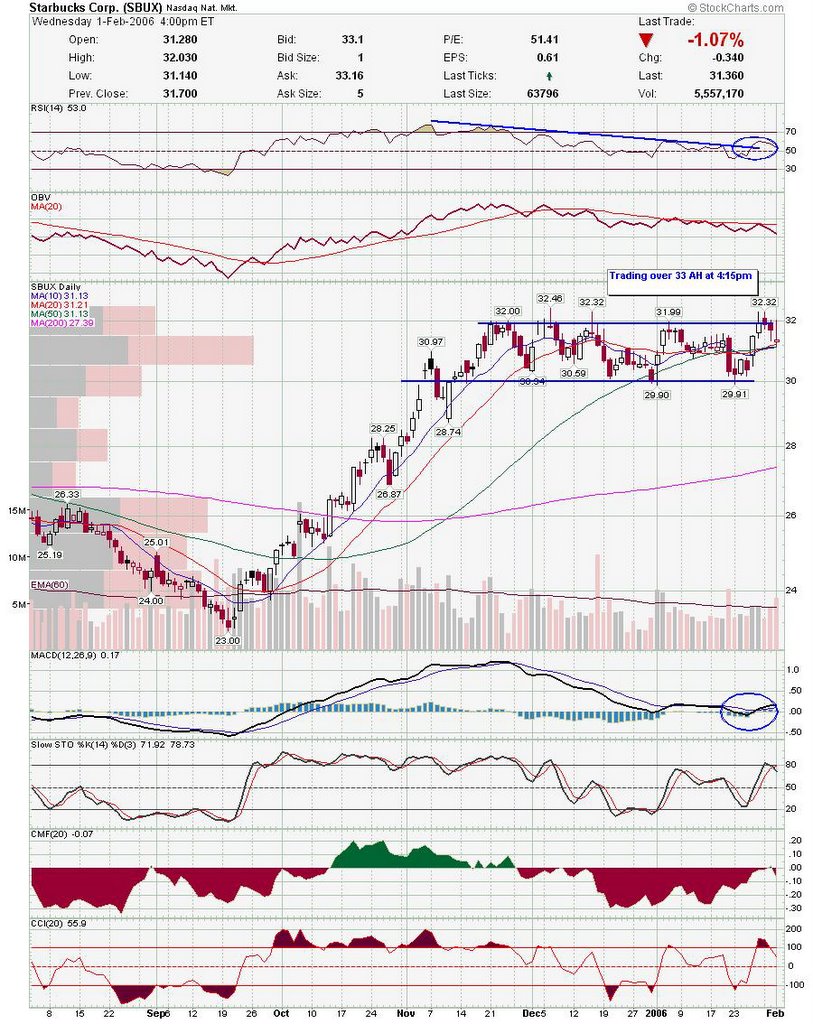 Weekly chart yields a much larger target of 43.
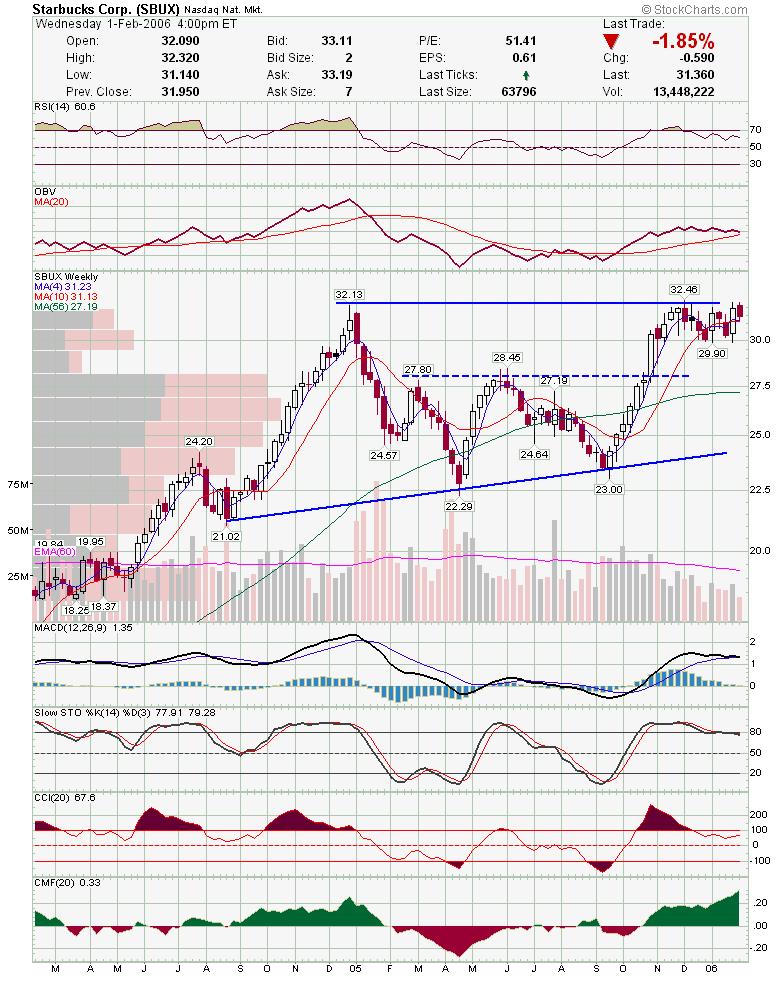 Here is a snapshot of SBUX's short position. It would take 4.4days for shorts to cover at average volume.
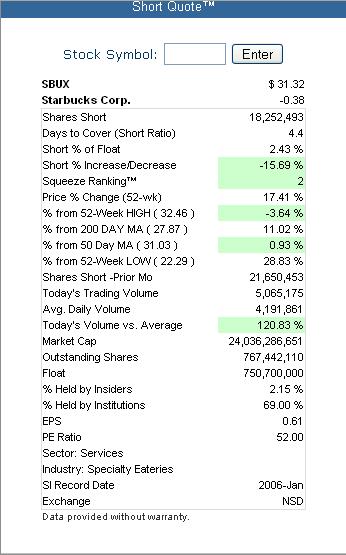
Please do your own DD before initiating a position.
Good Luck,
DT
MMUS looks like it is forming a cup and handle base and today touched near the 50% retrace of the right side of the base. I think, this presents a buying opportunity for those willing to be aggresive. Others may wait for the next higher high. MACD is crossing over, so I expect it to trade more sideways for a bit. But this could be the bottom of the pullback.
QDEL is coming off a bottom and may be headed back up. Looks like a double bottom with a break of the down trendline. This looks like a play that will take a little time to develop, but ultimately should prove profitable.
On the daily, I am looking for a rebound to the 38.2% retrace and 50sma as a minimum. The 50% is also in play, before waiting to see how it shakes out. Every indicator is diverging with the second test of support, and Slow stoch has crossed back from oversold. AROON also is holding it's crossover.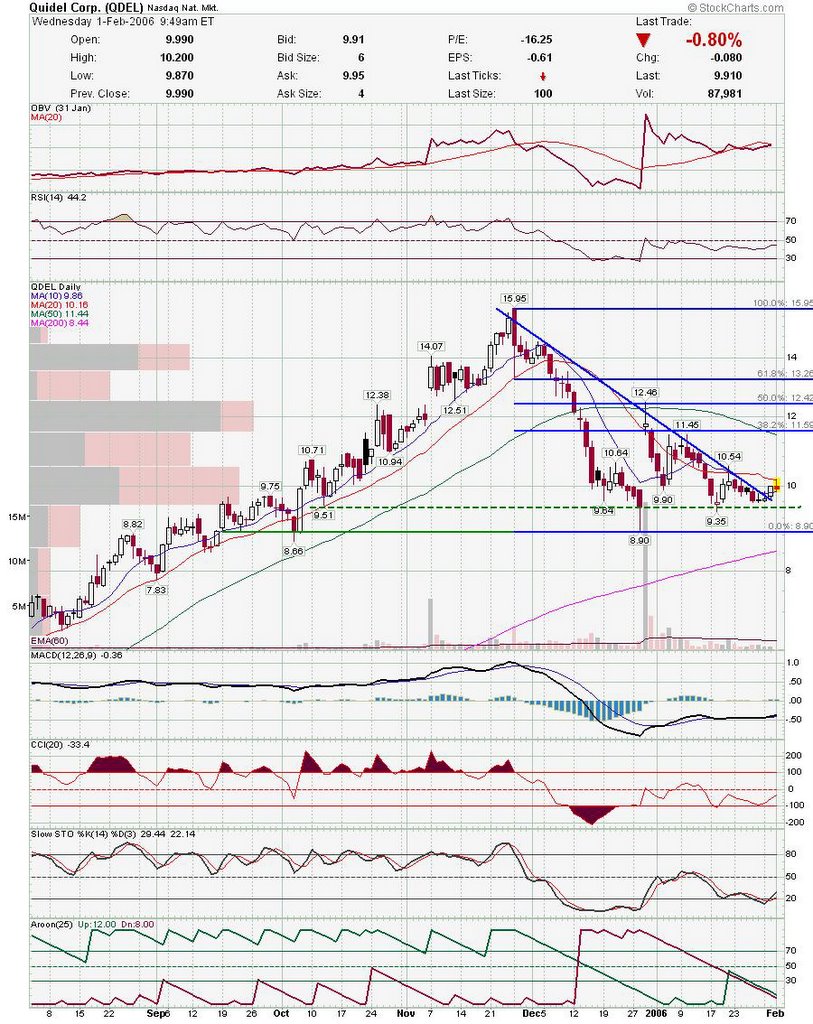 The weekly seems to support my theory of a bottom being put in. QDEL stopped on the 50% retrace of the larger leg up. Look at past big winners and you will see they ALL had these types of pullbacks. In the grand scheme of things, these shakeouts are healthy for a stocks longer term uptrend.
This is only my opinion, but I think QDEL makes a low risk / high reward play right now. Please do your own DD before commiting money to it.
Good Luck,
DT
Just a few charts tonight. Not sure what tomorrow will bring with most stuff down after hours with GOOG disappointment, but a few stocks still look decent. A lot of what I have been mentioning still looks good such as CKCM,CMED,SLW,CME and most of the gold stocks I mentioned. Keep an eye on the indices tomorrow for a retest of support. Also, looks like Bush will focus on Oil tonight and the need to use alternative energy sources. This could cause a run in the alternative energy stocks.

 Good Luck,
DT
If anyone remembers my natural gas post (http://downtowntrader.blogspot.com/2006/01/natural-gas-plays.html), i mentioned that I thought natural gas was bottoming. Looks like it may start moving higher, and most of the charts I posted back then are looking good. Read back on that post for more charts, but I have listed a few below. Be careful as tomorrow will probably be choppy with FED meeting, Goog earnings, President's speech, etc. Lot's of disruptive forces at work.
I also posted a Gold update previous to this post.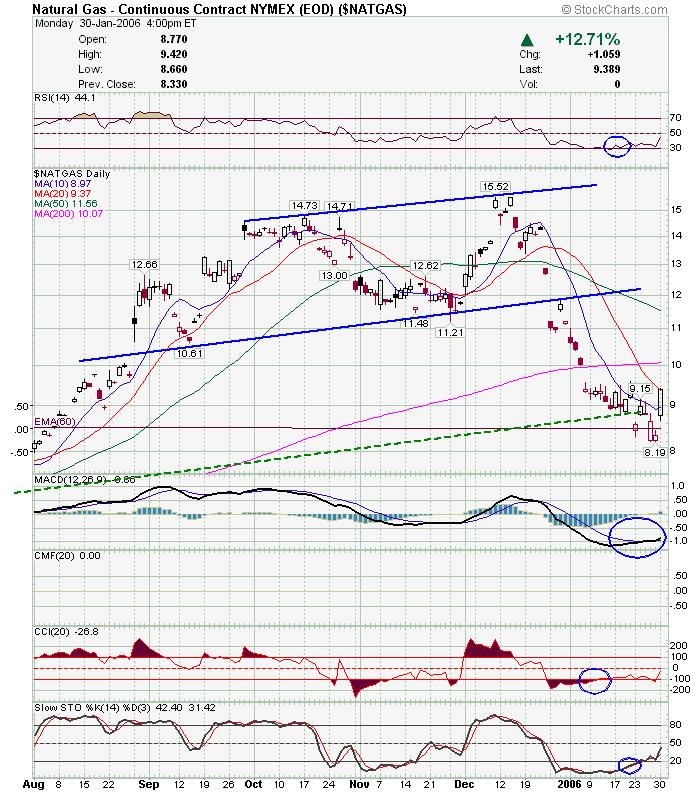 Nice Triangle. Target would be around 19.
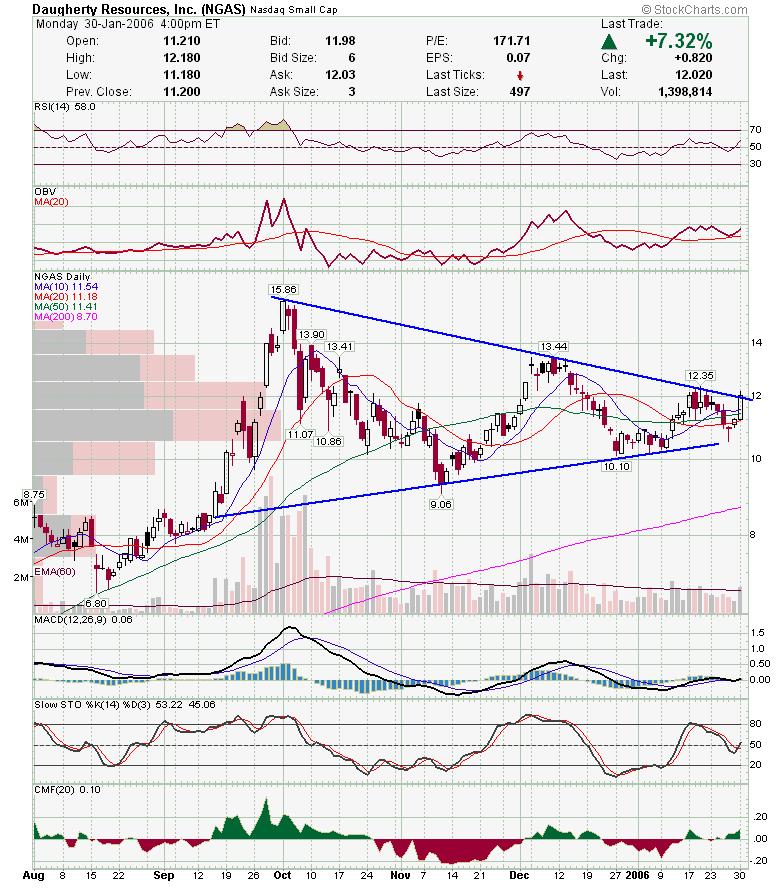 ABP has been fighting with a trendline for months. Looks like it may follow through.
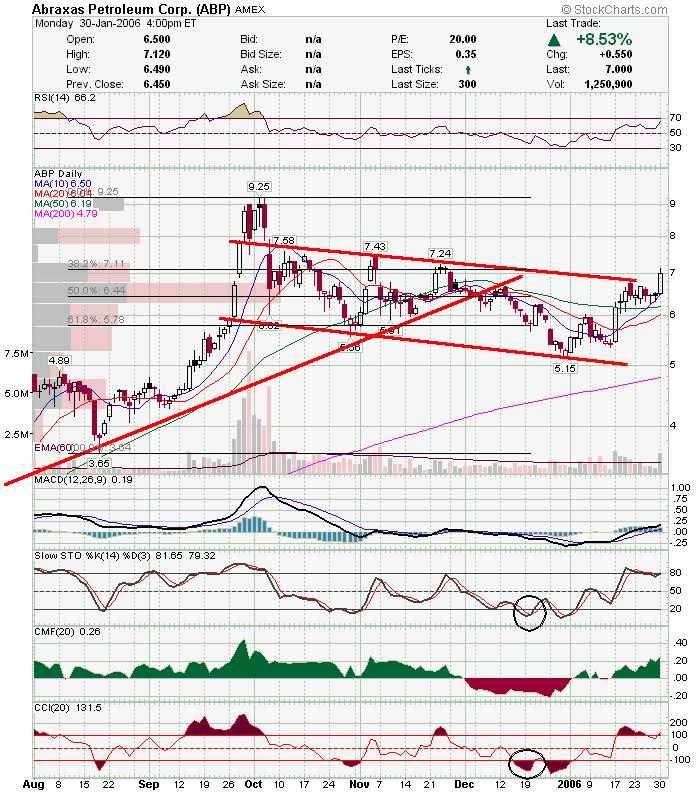 XTO held above breakout level and hit a new high.
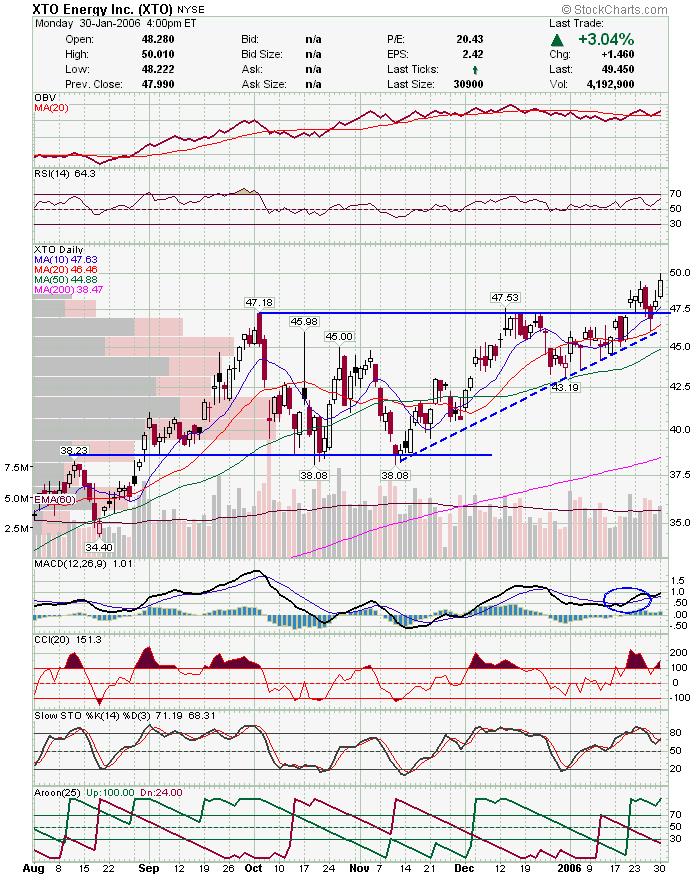 Here are a few couple non oil/gas charts.
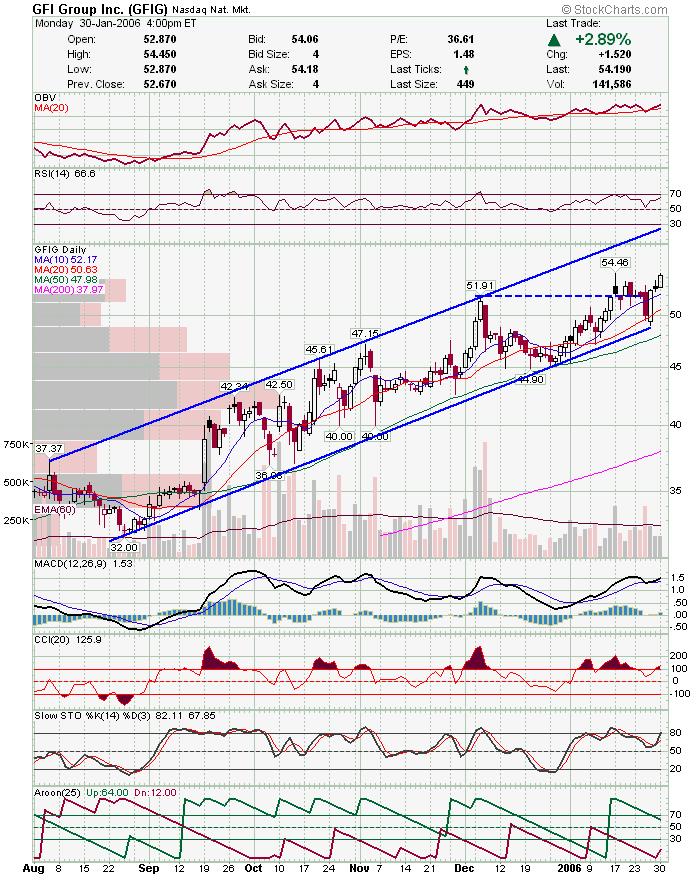
 Good Luck.
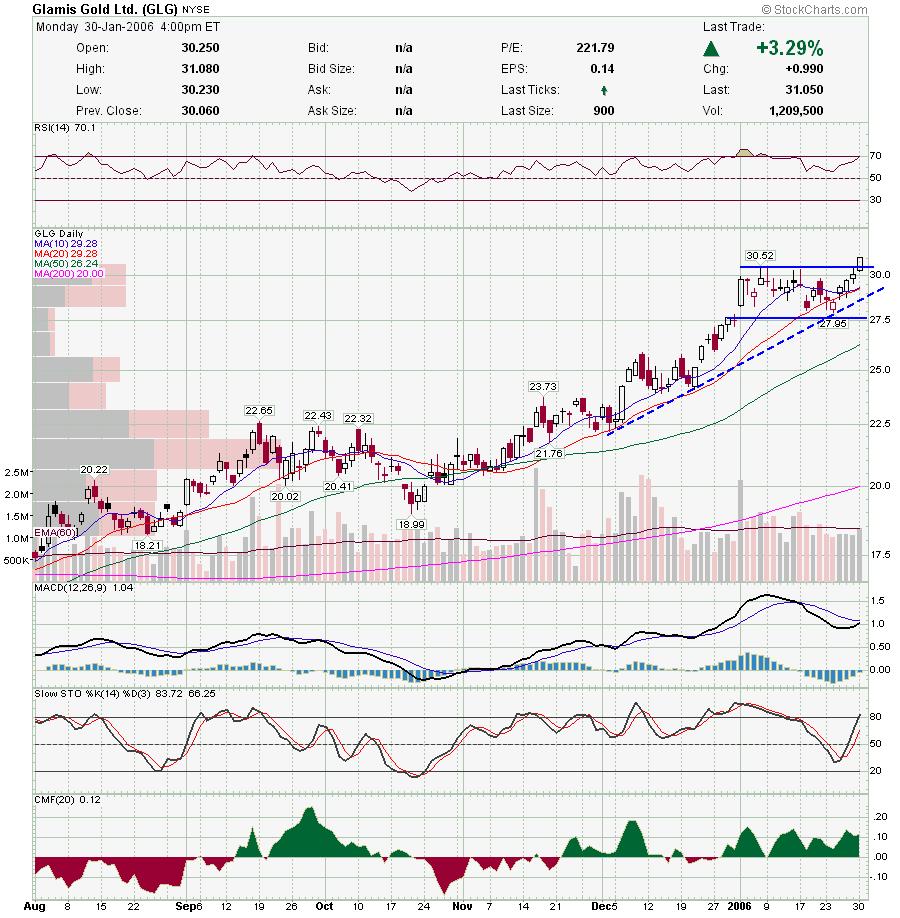
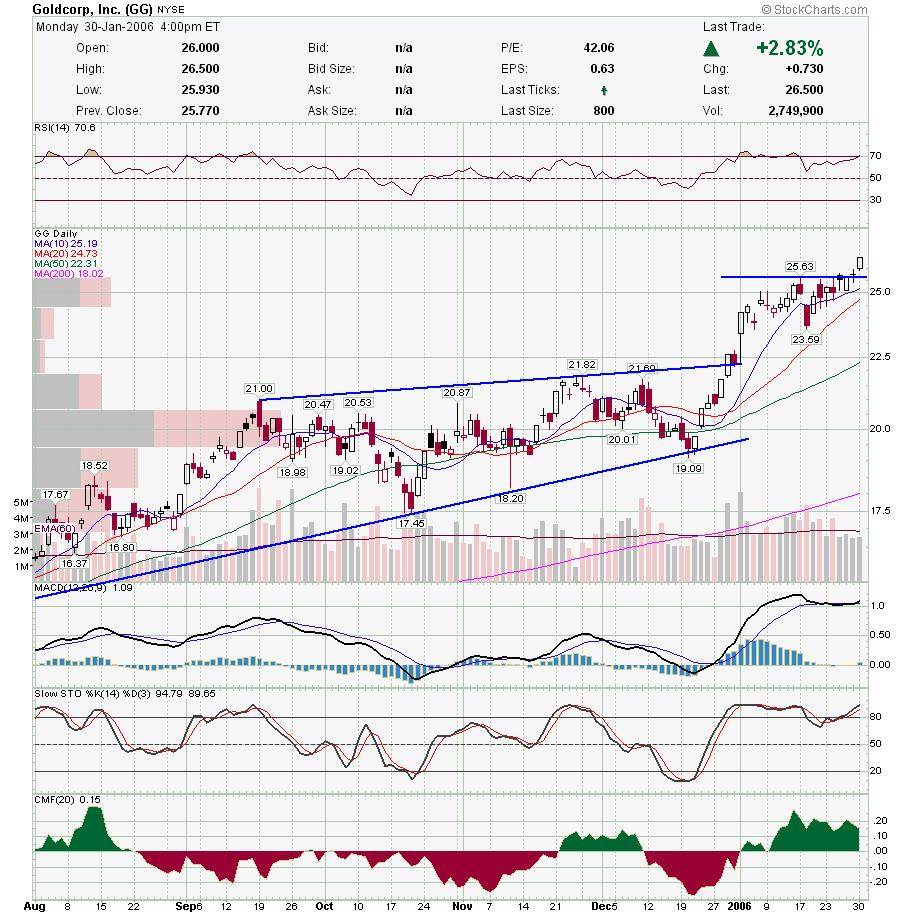
I was thinking gold would pull back but it is up again and gold stocks are breaking out. Careful of a top reversal, but at this point we have to assume gold will move.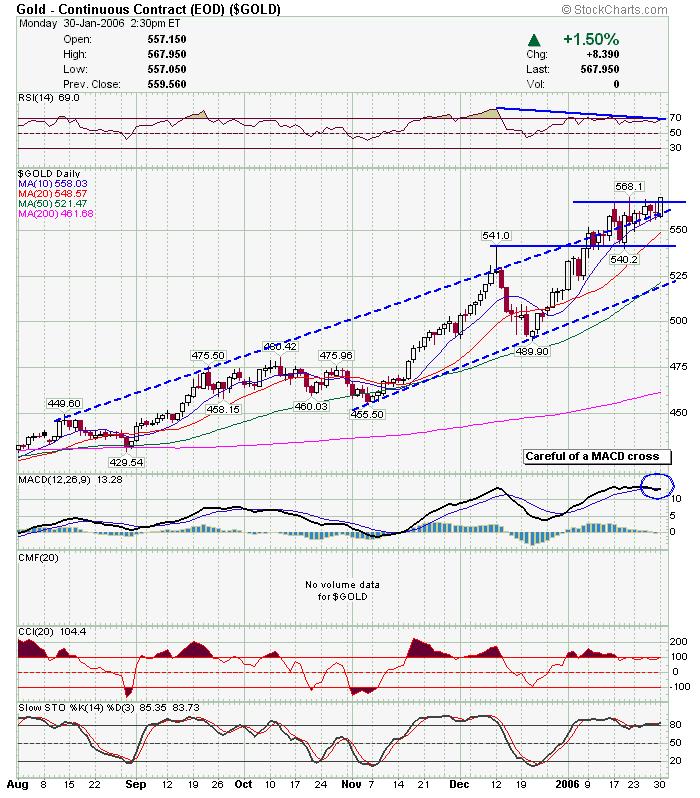

We had some nice moves on some of my picks today. Here is what each of the charts from last night did today. I didn't like the market weakness late, and I'm sure tomorrow will be volatile with Fed meeting and GOOG earnings. I will post some new charts later tonight.
nwre 0.49% Opened strong and faded all day
abax 7.31% Nice move
esrx -0.83%
bnt 1.48%
ctrn 0.54% Same as NWRE
fdry 0.13%
ntri 2.00%
powi 2.75% Broke pennant
qcom 1.15%
boom 1.19%
cmed 7.16%
swsi 1.57%
zygo -1.88%
ckcm 8.30%
average 2.24 %
Here is a guest column by btuff2. He is a fundamentalist investor and took the time to write a very nice piece on CKCM. It is a nice change of pace from my purely technical views and gives us another angle from which to look at CKCM. Also, BTUFF doesn't short, whereas I have no problems shorting. I find a lot of fundamentalist don't like to short because of their longer term tendencies, where short term traders feel the opposite. Just keep in mind that it is important to look at how all type of investors look at things.
If you missed it, I have two updates below from over the weekend. Enjoy.
Here is btuff's column.
I don’t normally short stocks. Maybe I think shorting seems somewhat un-American. Maybe I am just an optimist and would prefer to profit from success as opposed to failure. Maybe I just prefer an investment with limited risk and unlimited reward as opposed to unlimited risk and limited reward. Despite my preference to be on the side of good as opposed to evil, I am interested in the mentality of a short. What makes a good short? What types of questions does a short ask before selling short? Why do the vast majority of shorts post on public message boards in all capital letters?
I am about to free myself from my prejudice and step inside the mind of a short. I am going to randomly select a company from the Reg SHO list and put it through the rigorous routine that I think a short is likely to go through when making a decision to short a stock. Ok…here goes. Imagine me closing my eyes and moving my finger down the Reg Sho list….down….down…down. Ok…I have one….CKCM! It has been on the list for 65 days, shorts make up over 40% of the float and the days-to-cover is nearly 9. This thing must be a dog!
Given what seems to be the perfect short, I will kick the tires a bit on CKCM and see if I can’t find the answer as to why a short would short.
Is revenue growth slowing?
In looking at the most recent quarter, it looks like revenues grew by over 130% from the year-ago quarter. The quarter before last, revenues grew by 115%. The quarter before that revenues grew 107%. It looks like revenues are growing rapidly so it isn’t a lack of revenue growth that has attracted so many shorts.
Are margins getting squeezed?
If its not revenue, it must be deteriorating margins that are subsequently eating away at what falls to the bottom line. As I scan across my financial model for CKCM, I see gross margins holding steady above 60% and up sequentially in the most recent quarter. Operating margins are above 20% and almost broke 25% in the most recent quarter. Like operating margins, net profit margins are holding steady above 20% and came in at 23.37% in the most recent quarter compared to 19.47% in the year-ago quarter.
If revenues are increasing and margins are holding steady sequentially and increasing year-over-year, it doesn’t take a genius to figure out that earnings are also on the rise. In the past four quarters, starting with the most recent quarter, quarterly earnings increased 176%, 173%, 209% and 111%.
Is the balance sheet a wreck and is the company loaded with debt and strapped for cash?
CKCM’s balance sheet shows just about $6.4 million in long-term debt and over $11 million in cash. With more cash than long-term debt I am not seeing any problems with the balance sheet. Furthermore a quick glance at the cash flow statement shows that CKCM has generated positive free-cash-flow for at least the past twelve months.
Does management lack competence?
With the high level of short-interest in CKCM there must be something wrong. If it is not declining sales, weakening margins, falling earnings or a poor balance sheet, the company must be a run by a bunch of buffoons.
Taking a quick look at the return ratios on Yahoo, I see ROE at 26.87% and ROA at over 12%. Based on these numbers, it seems to me like management is doing something right. With a customer list that includes: Honeywell; Lockheed Martin; FedEx; Fidelity; Wells Fargo; Citibank; GE; Microsoft; Dell; Eriksson; HP; IBM; Cisco; Siemens; Ann Taylor; Blue Nile; Walmart; P&G; Carters; Verizon; SBC; Nissan; etc; etc; etc; I know management is doing something right.
Is management selling shares hand-over-fist?
I am coming up empty again. There have only been four insider sales in the last 12 months for a total of 23,145 shares. Furthermore, institutions added a net of over 800k shares in the last quarter.
Is the share price way overvalued?
I have yet to find a kink in the armor and I am left with only one possibility. CKCM must be way overvalued. I am talking this thing must have a PE of ludicrous proportions.
Oh but wait, I am calculating a current PE of 27.42 and a forward PE of 21.27 for CKCM. Can that be right? The last time I looked the Internet Software and Services group had an average PE of 49. When I compare the average growth rate for the industry to the recent growth rate for CKCM it just doesn’t stack up. Furthermore, when I take the recent growth rate for CKCM and calculate the current PEG, I can’t help but say that CKCM appears to be undervalued.
I am left scratching my head. Despite my very best efforts to understand the mind of a short, I more confused than ever. After doing a little due diligence on one of the most heavily shorted stocks, the only conclusion I can come away with (in all caps like a good short):
”GO LONG AND WATCH THE SHORTS GET SQUEEZED”
Please do your own DD.
Lots of charts tonight, and most look very good. Not sure if this is foretelling for the market. I think we are in a precarious position here as far as market health is concerned. I would be worried about a top here, until the markets prove otherwise and make new highs. I am being quick to take profits on some of my newer positions.
NWRE: May be breaking out here. Earnings are 2/1 Nice bounce off the lower trendline here.
 long consolidation for esrx.
 Nice volume for BNT as it takes out resistance.
 CTRN also has had a good volume increase.
 FDRY also had volume as it breaks a trendline and earnings are out of the way.
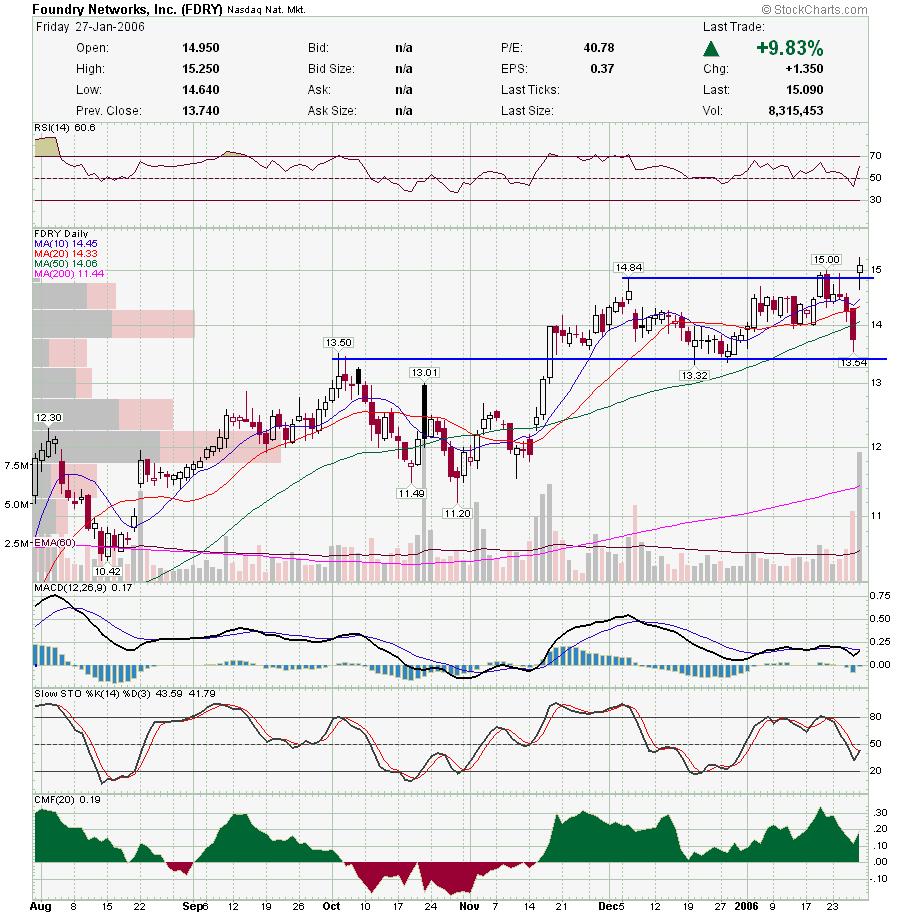 NTRI has possible resistance above, but has been a high flyer before.
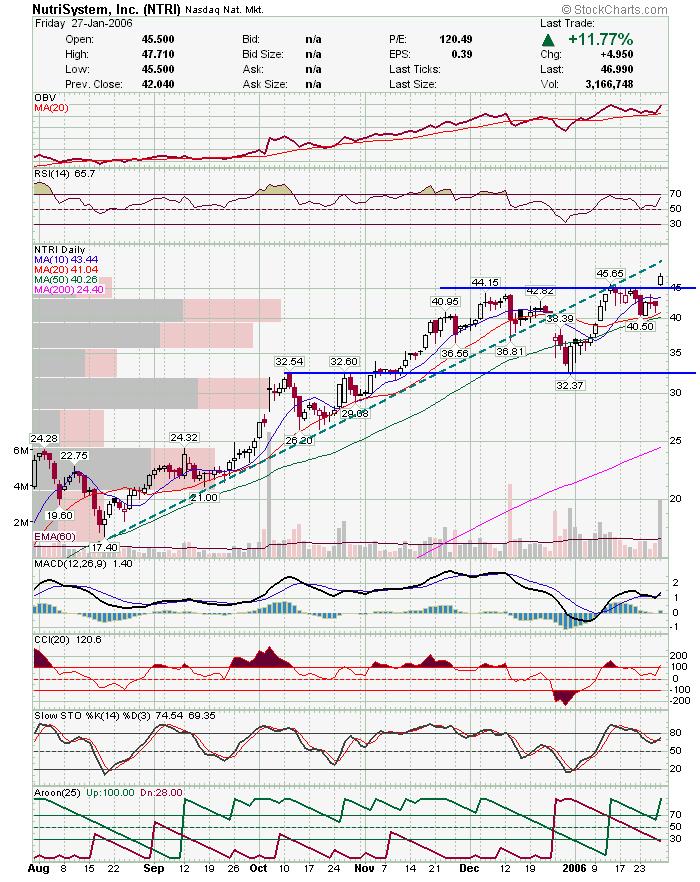 POWI may break out of a pennant type formation.
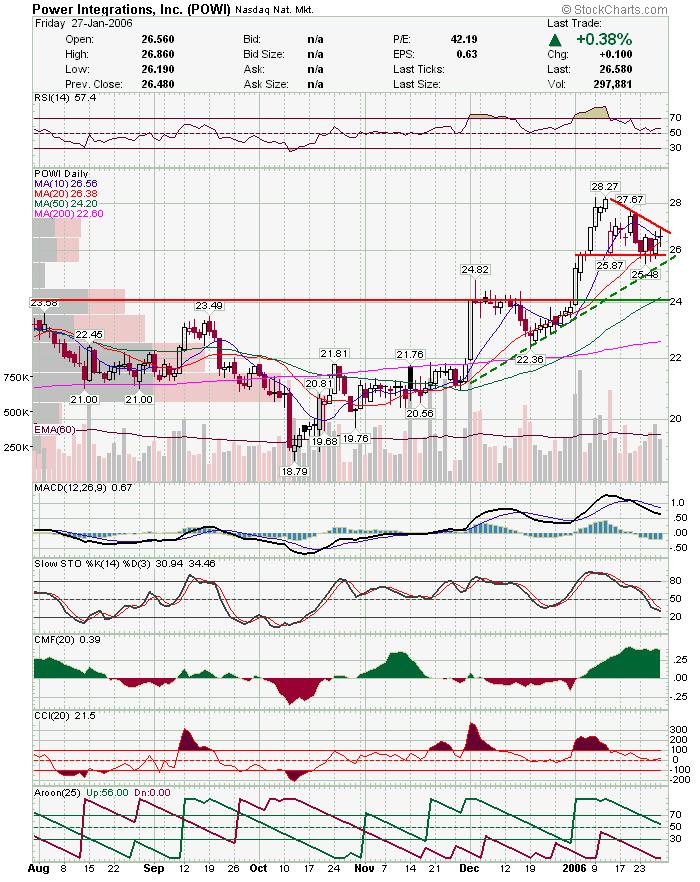 Another pennant type formation here for QCOM.
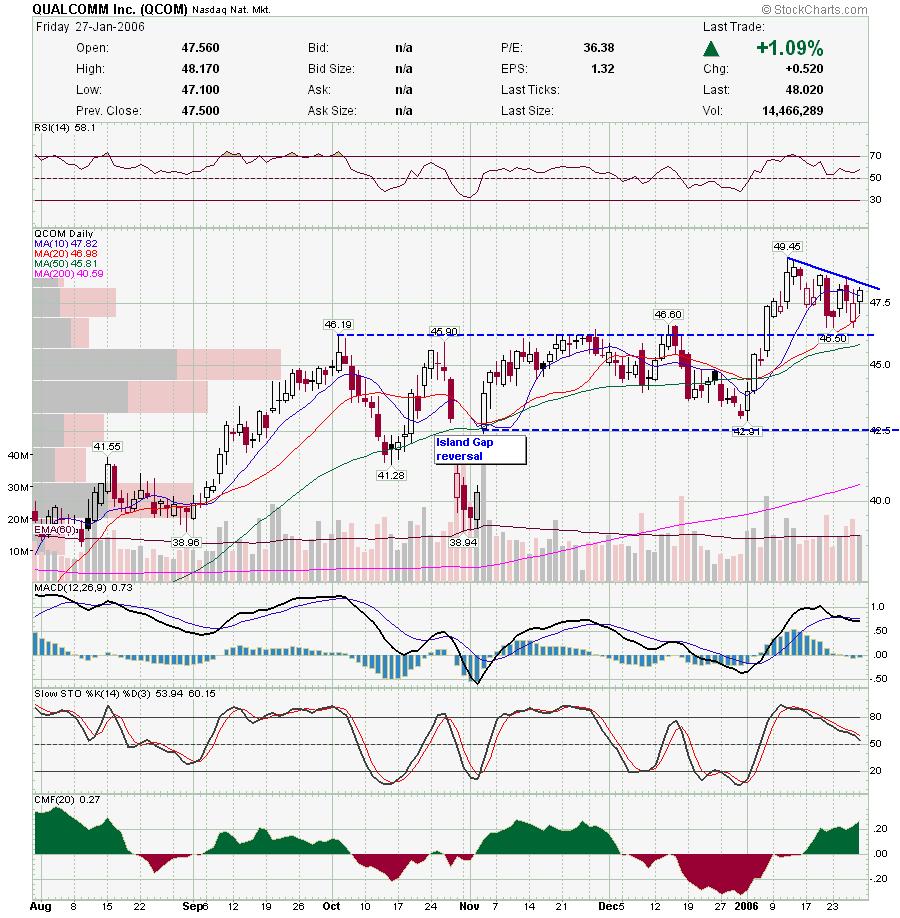 BOOM has been trading in a tight range and just broke to a new high friday. MACD crossing over.
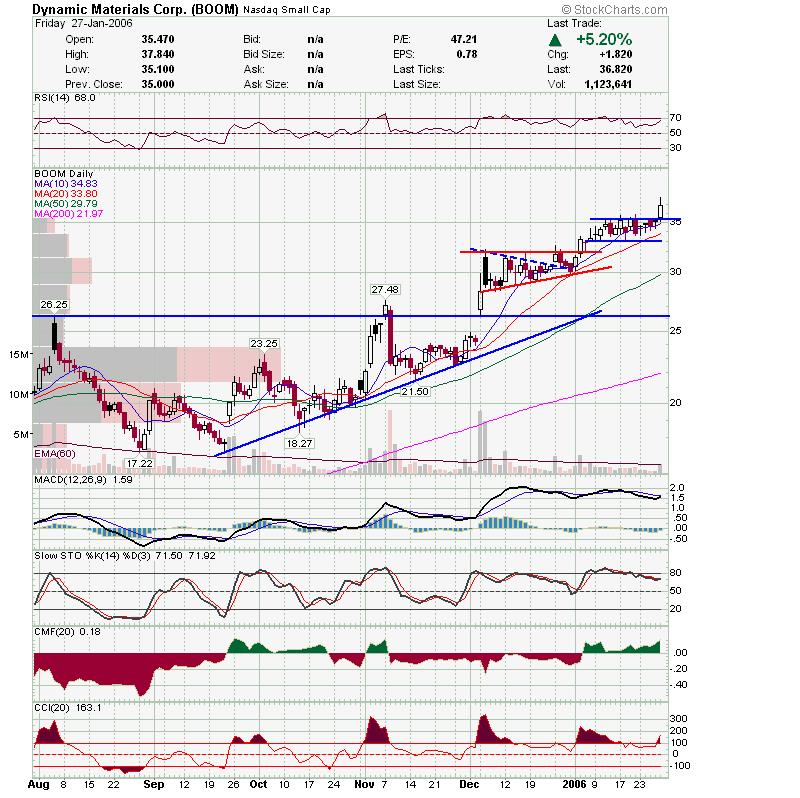 CMED pulling back to a possible trendline.
 SWSI is a thinly traded stock that has broken a trendline and is now testing support. Looks like it is headed back to test the high.
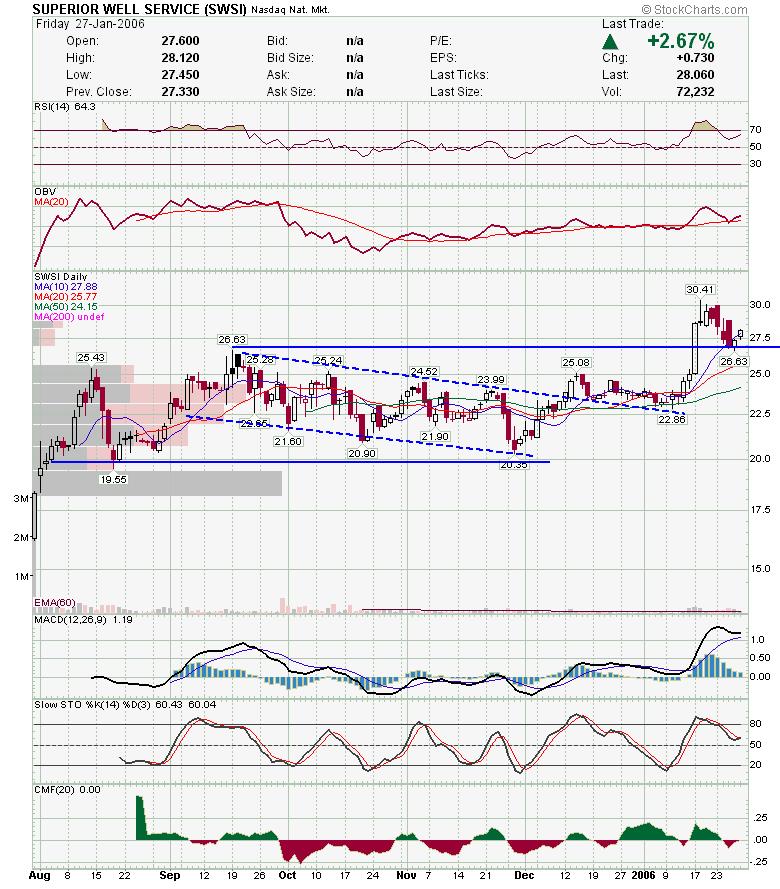 ZYGO broke out but reversed. Look for a test of the trendline and a possible reversal back up.
Lot's of charts to digest, but I'm sure some of these will be nice movers this week.
Good Luck,
DT
Subscribe to:
Posts (Atom)


