I won't be posting tonight. It is my daughter's 1st birthday and we will be celebrating. Good Luck tomorrow.
DT
We got a bounce starting around middle of day as expected, although the close left much to be desired. Tomorrow is a key day to see if we get follow through on a recovery rally. At this point it looks like a retracement rally and not the beginnings of anything special.
Small caps have been getting hammered lately and Russell finally decided to fight back. Looks like a possible head and shoulders forming if we get a bounce that stops on the red trendline.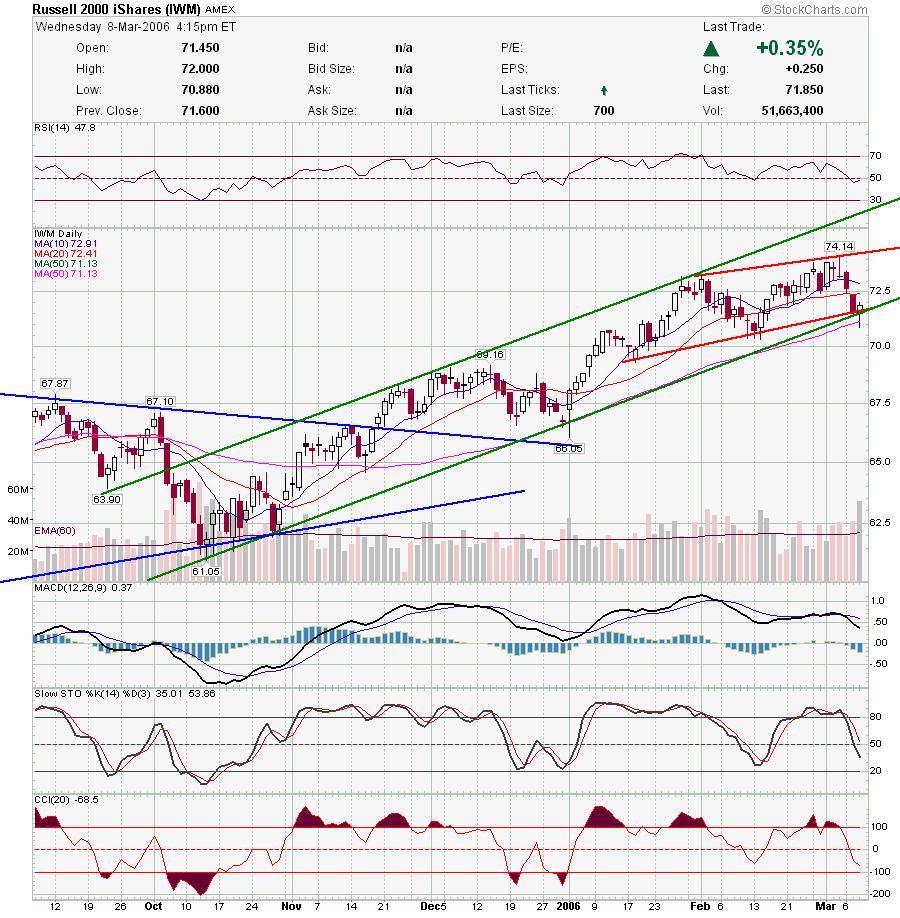 While Gold looks like it's beginning a deeper correction, Silver is still within the channel. Silver has been stronger for some time now, and while precious metals tend to trade together, Silver is the clear leader.
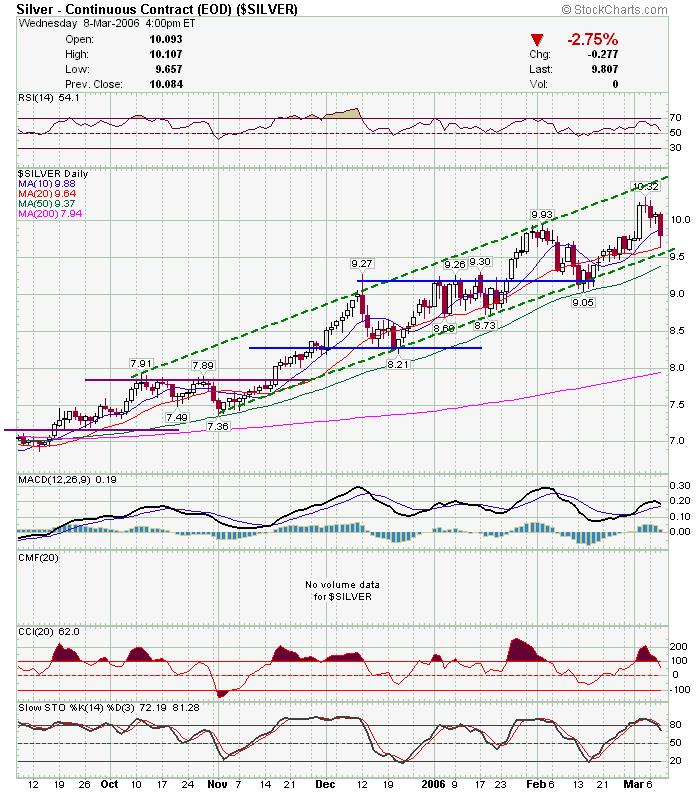 SLW has sold off a little too quick and hit the 50% retracement today. I added to my position this morning.
 PAAS is another silver play if we get a bounce.
 Biotechs were strong today and look like they may build on those gains. ILMN has been trading a tight channel.
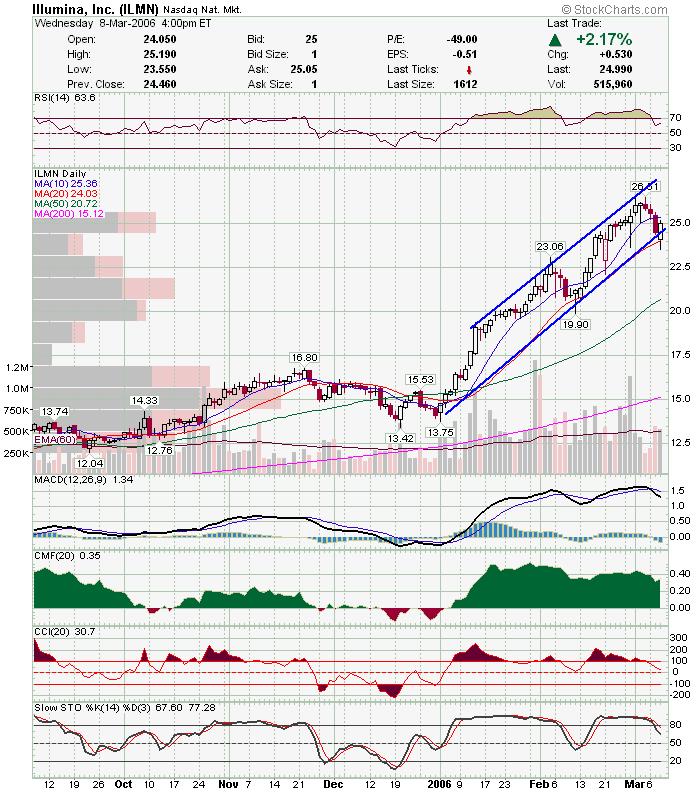 NBIX chart is self explanatory.
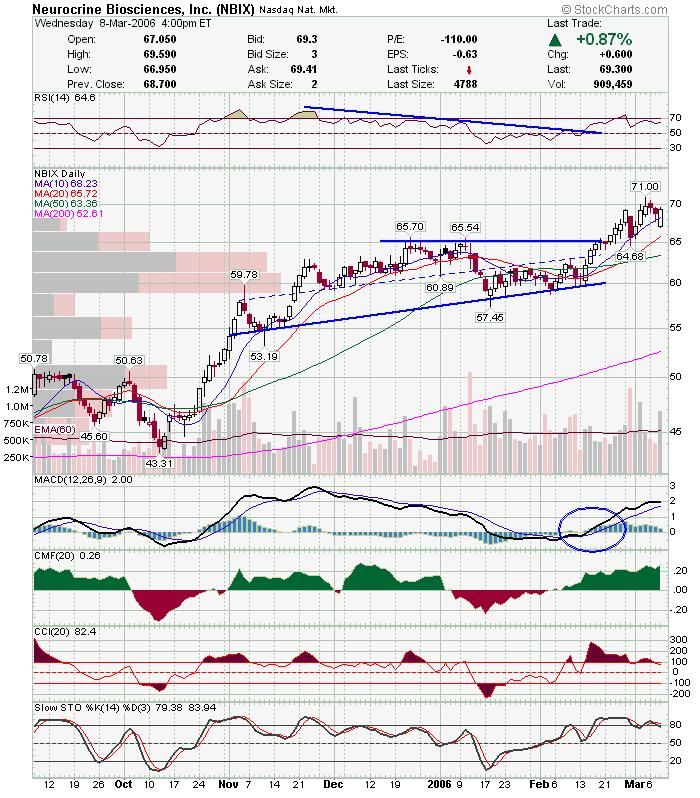 GILD got a nice lift off the 50sma and trendline support.
 Financials also look ok, and JPM is trying to clear consolidation.
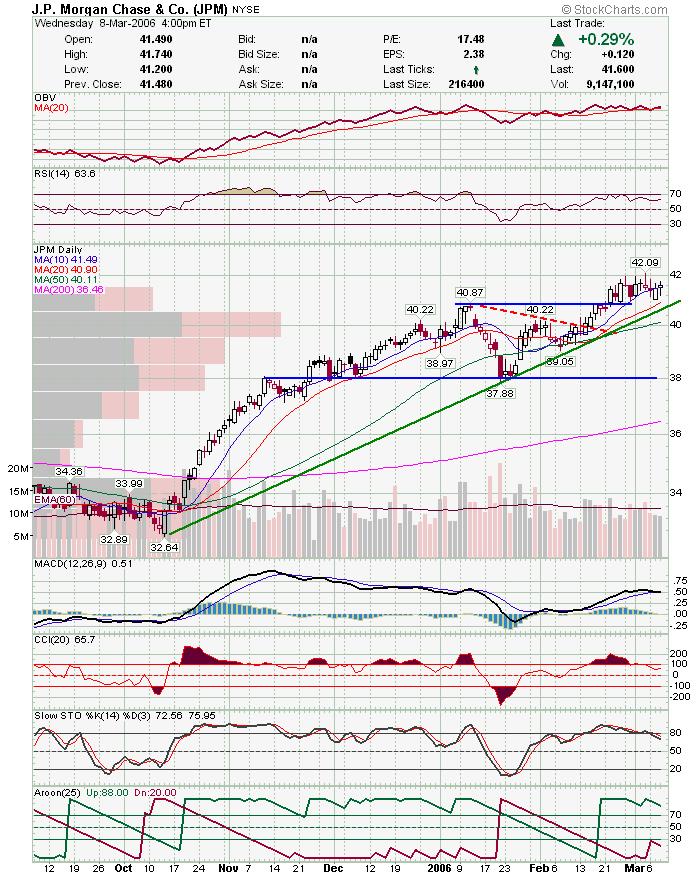 AKS pulled back a little but got support.
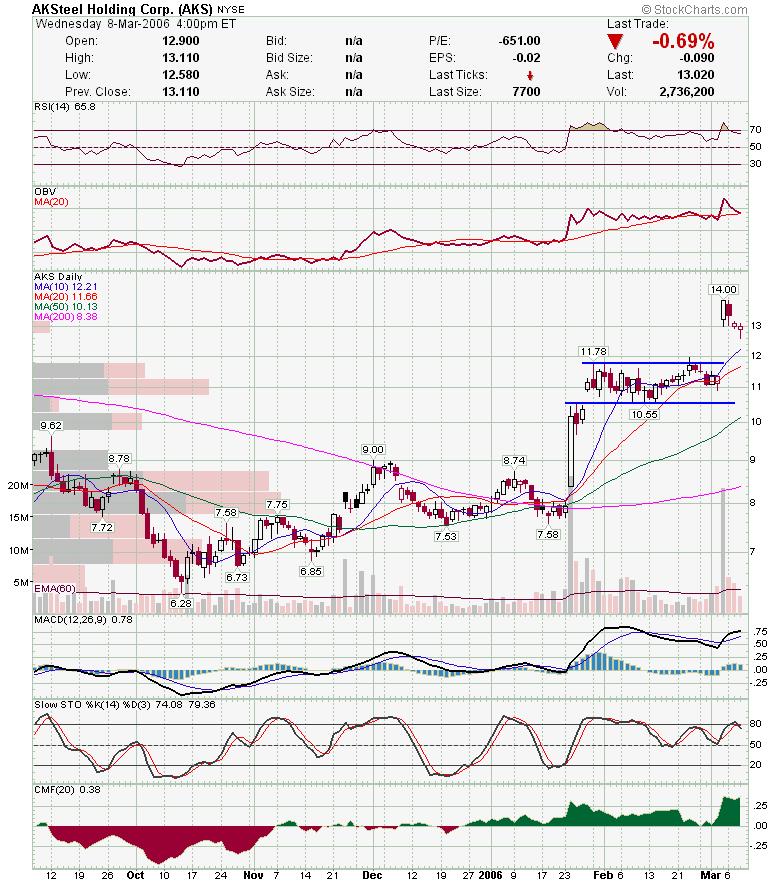 The other sector that has looked good is retailers. AEOS cleared a reverse head and shoulders type base and is completing a continuation candle pattern.
 BBY looks like it is breaking a pennant consolidation.
 CVS broke through a nice ascending triangle.
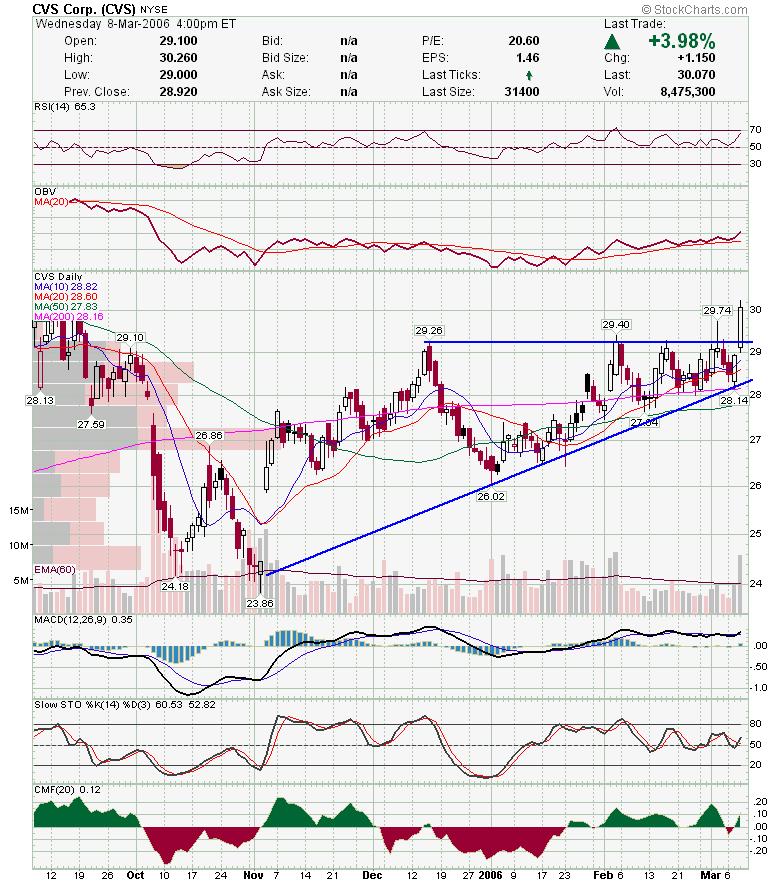
JCP has held it's breakout and has been consolidating very well.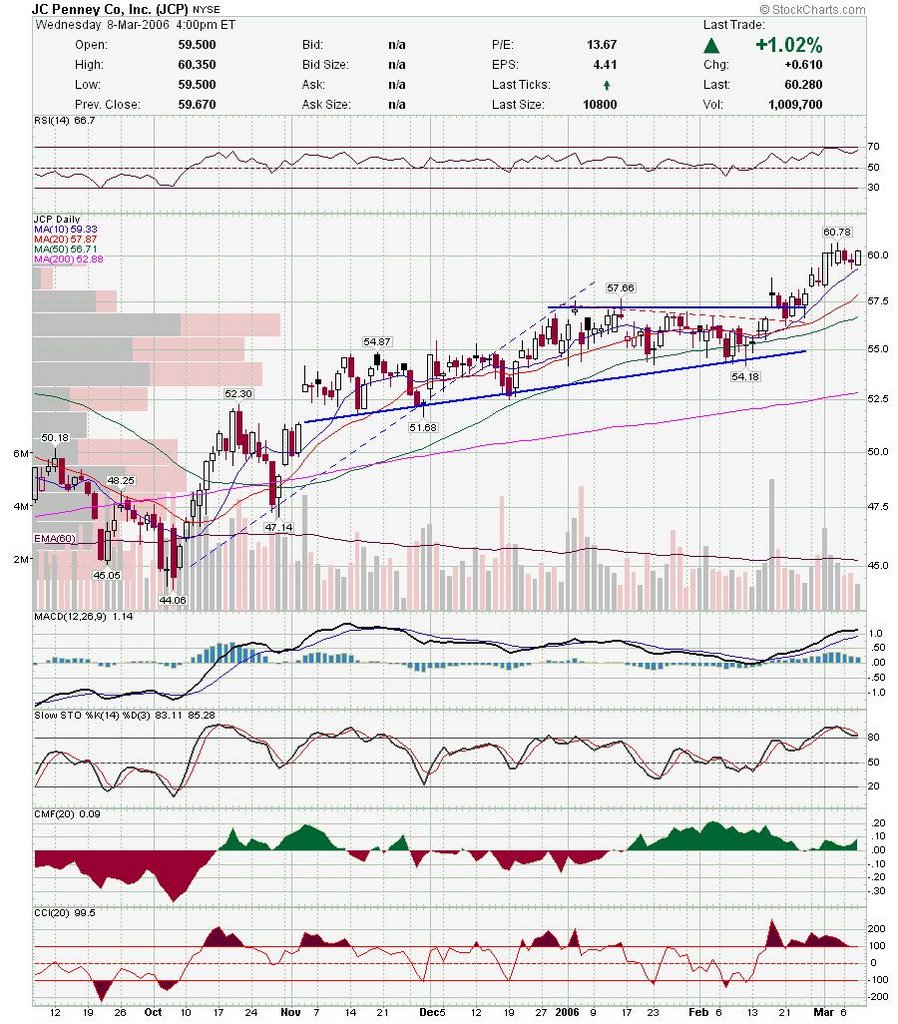 BNT may be forming a double bottom here. Keep in mind that buying under the 50sma is risky.
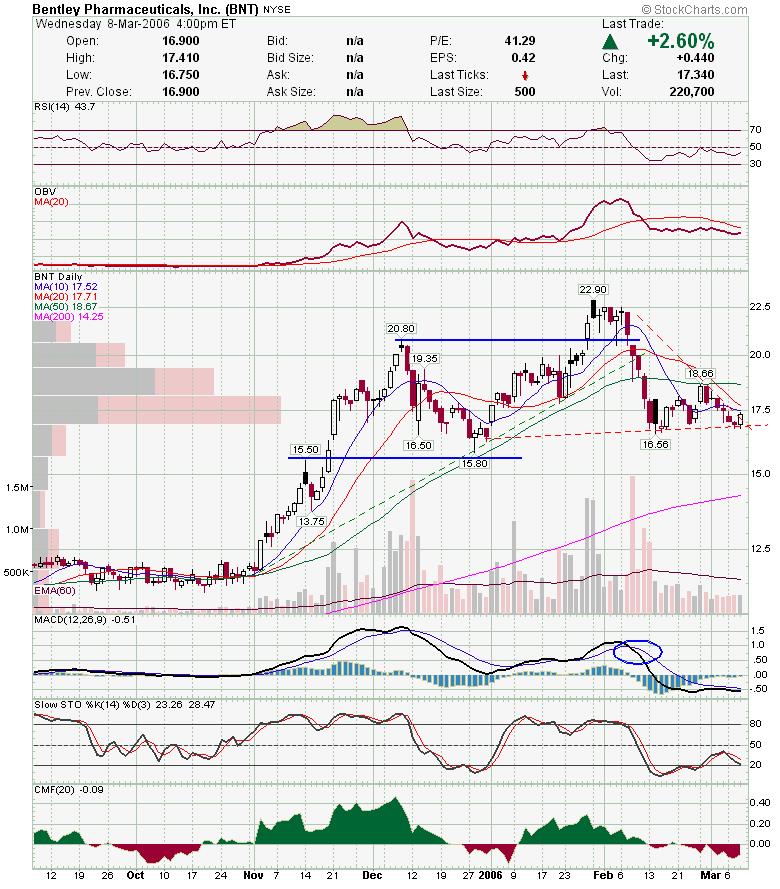 JCOM has climbed back to the top of the trendline. Watch for a move to either side.
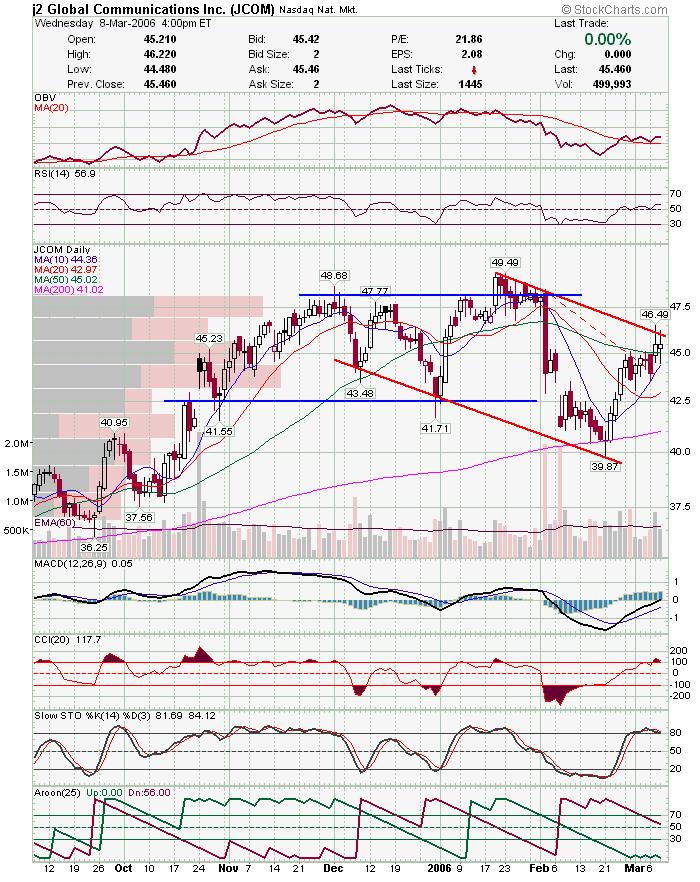 PEIX is testing lower trendline of triangle.
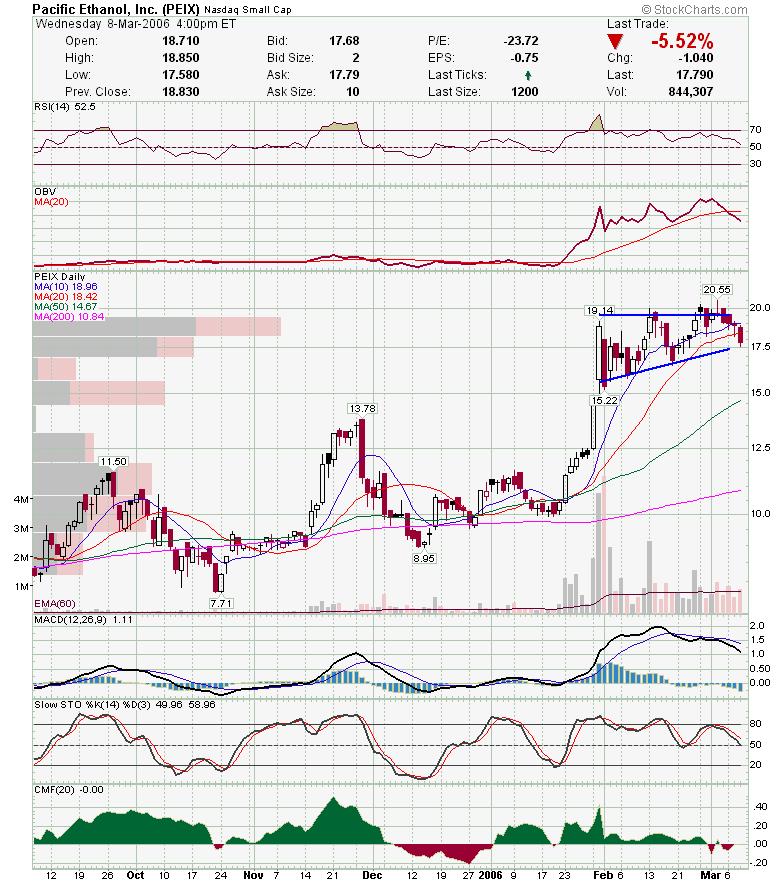 QCOM had a nice move on volume today.
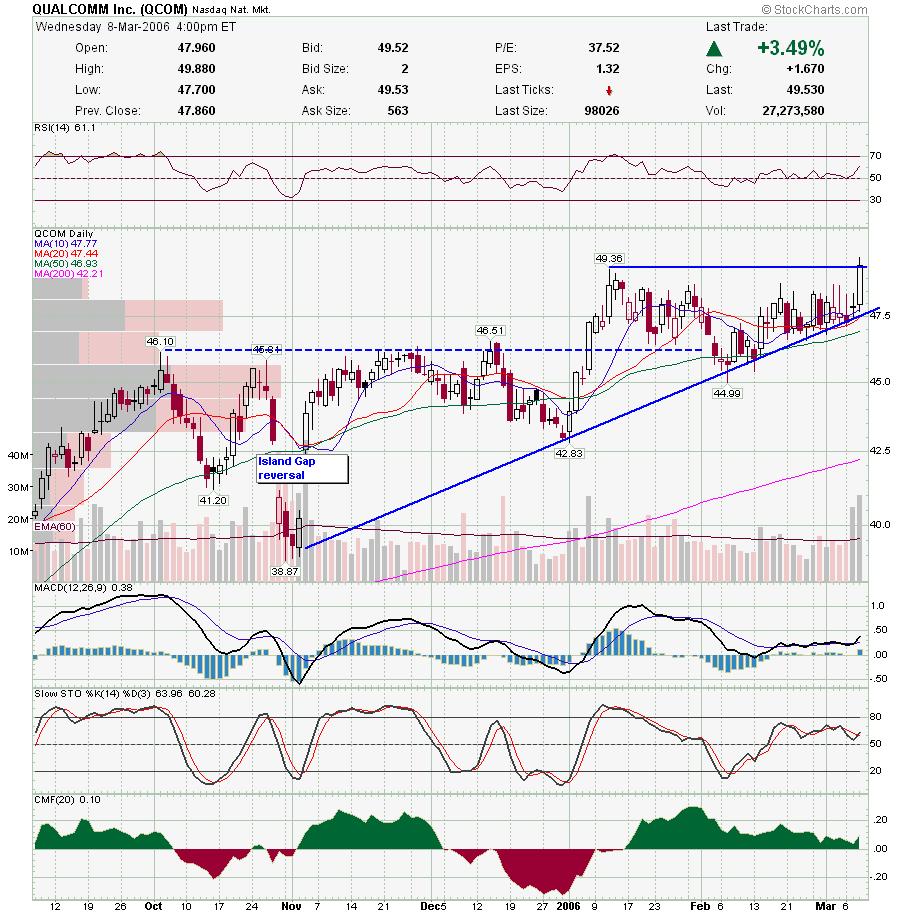 Good Luck,
DT
It is looking like we may get the technical bounce I was expecting tomorrow. Dow eeked out a gain today and SP held 1270. NAS was hammered all day by chip stocks and fell through back in to the wedge. While this is bearish, the hourly chart is pointing to some near term support. However GOOG was down AH and may weigh down on the index. I am looking at mostly longs as shorts are likely to get chopped around. If we have a negative day, I will probably look back to oil sector for some plays.
Here is the Russell. Notice it is right at a trendline. If it falls, then look for redline as next support. Here is the nasdaq falling back in to the wedge.
 ISE broke to new highs this afternoon. I was expecting most of the exchanges to do well in sympathy to NYS beginning to trade tomorrow, but all of them save for ISE were beaten down pretty bad.
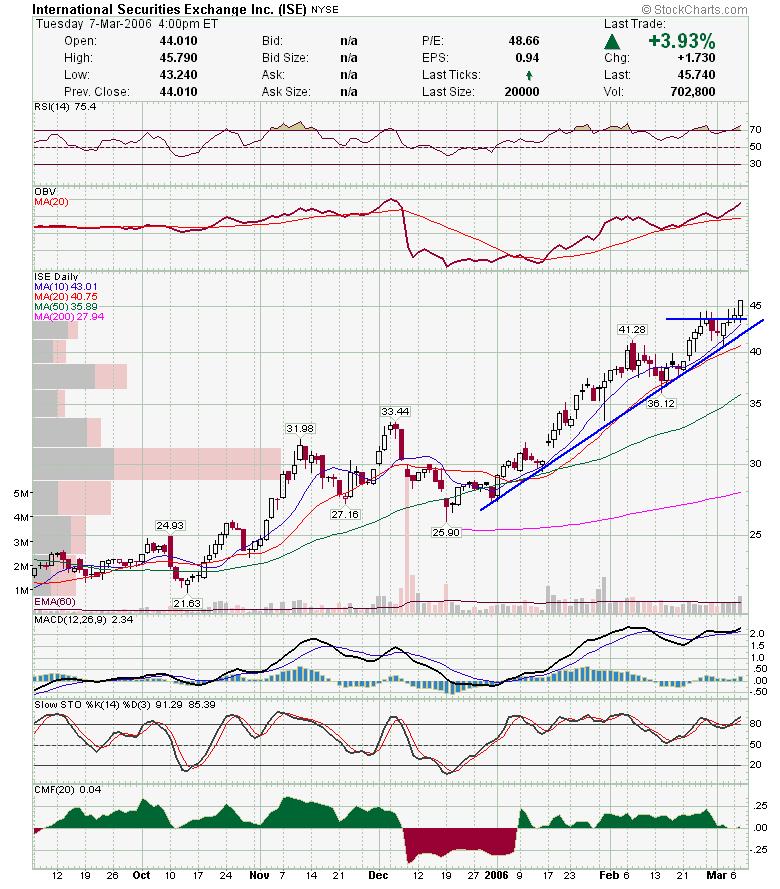 EZPW showed some nice strength the past couple days with markets falling apart and them breaking to new highs.
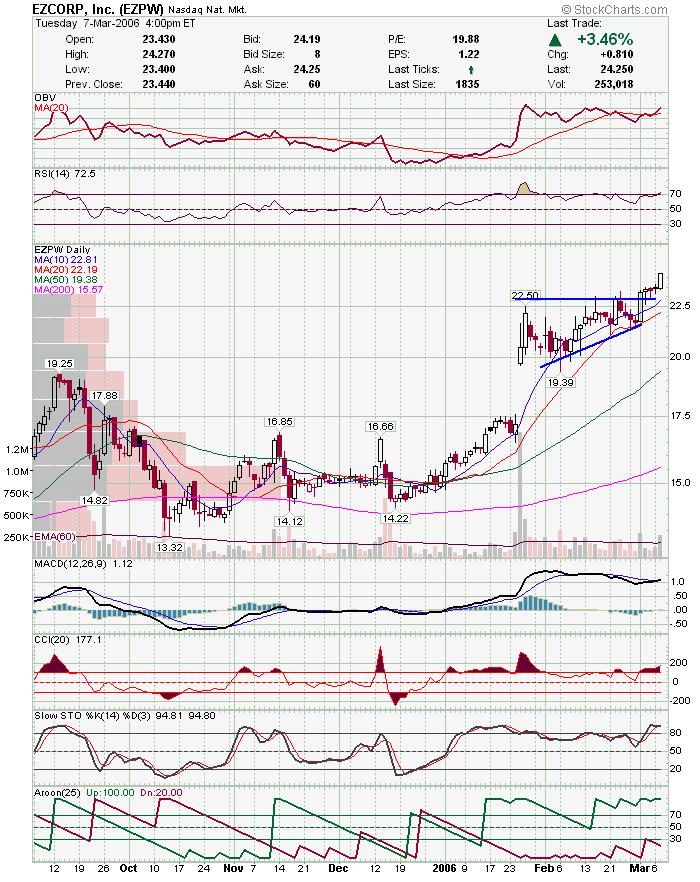 PAL reversed course and is in danger of breaking the 50 SMA. Should make a nice short if metal's keep getting hammered.
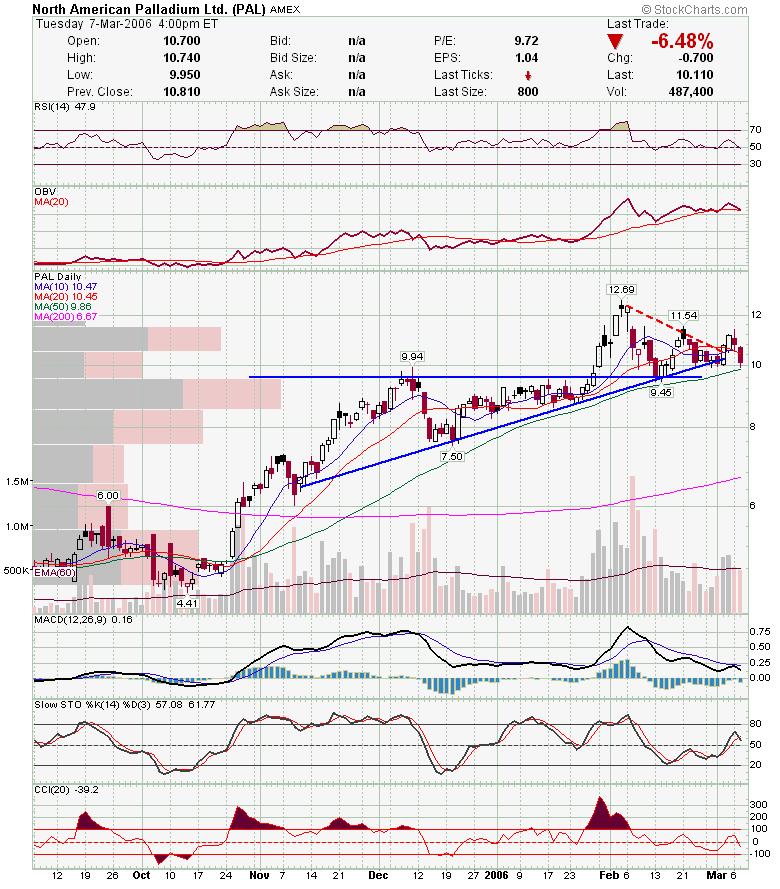 JOYG has pulled back after strong earnings, and is setting up for a test of the trendline.
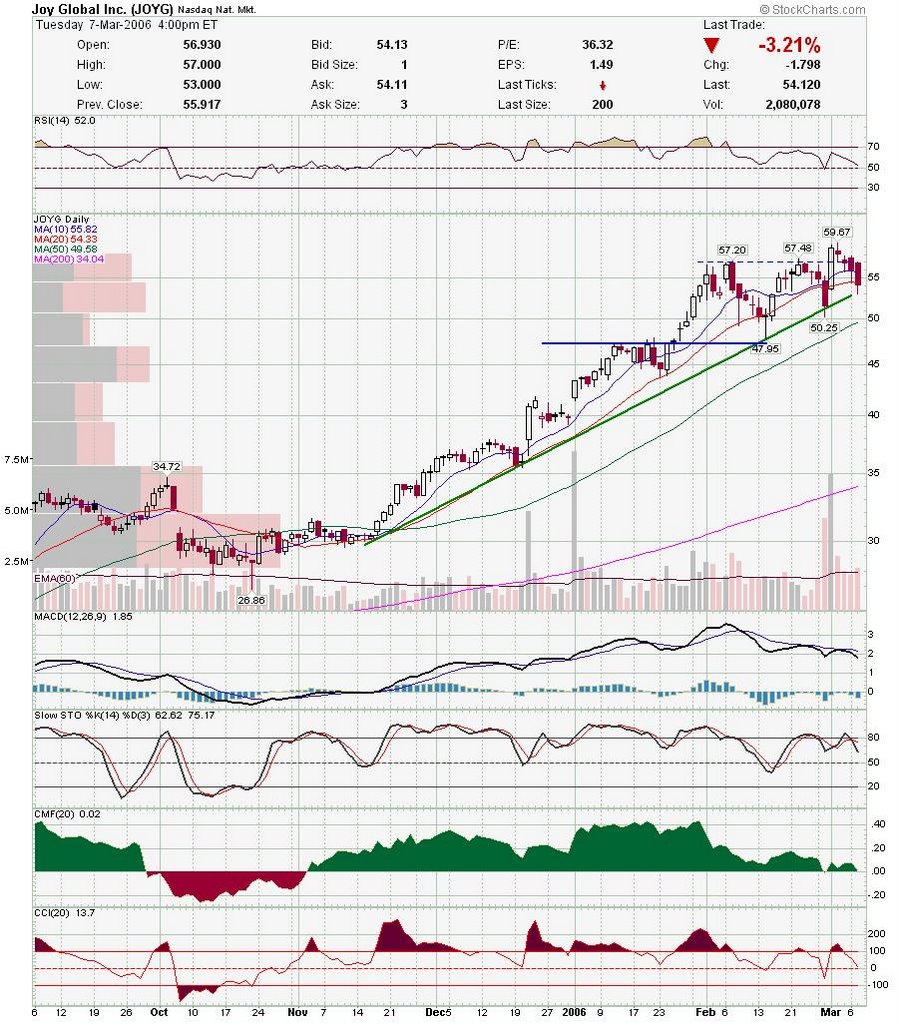 AMD has been acting very weak and looks to be testing the trendline and 50 sma. If markets stage a recovery rally, AMD may get a boost.
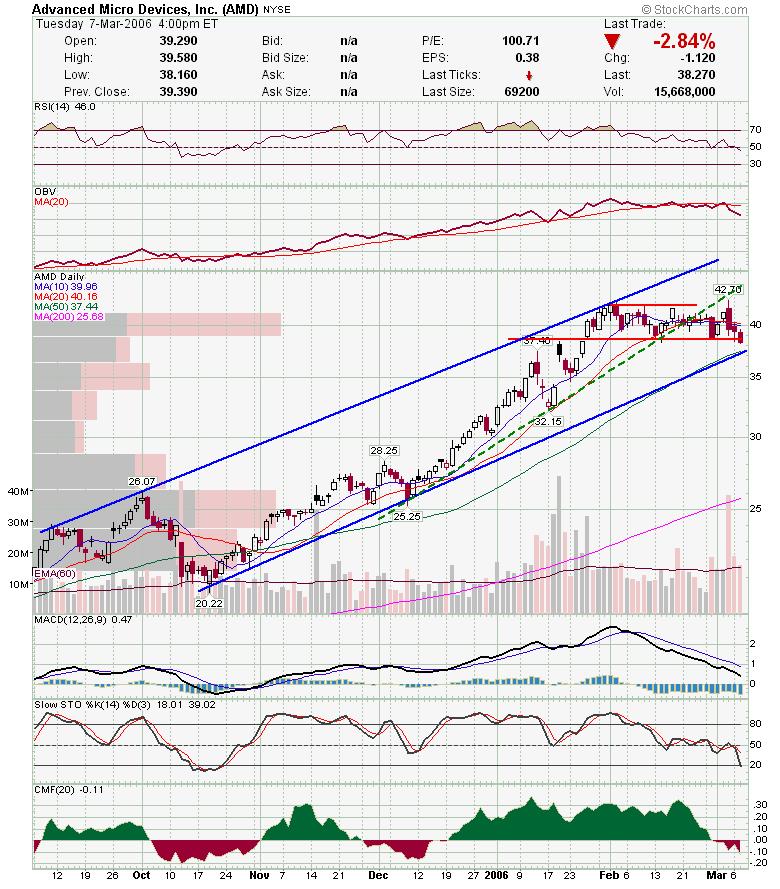 MRVL broke serious support and was my best daytrade today. If markets bounce, then I will be looking to short it again near the trendline (if it can't hold of course).
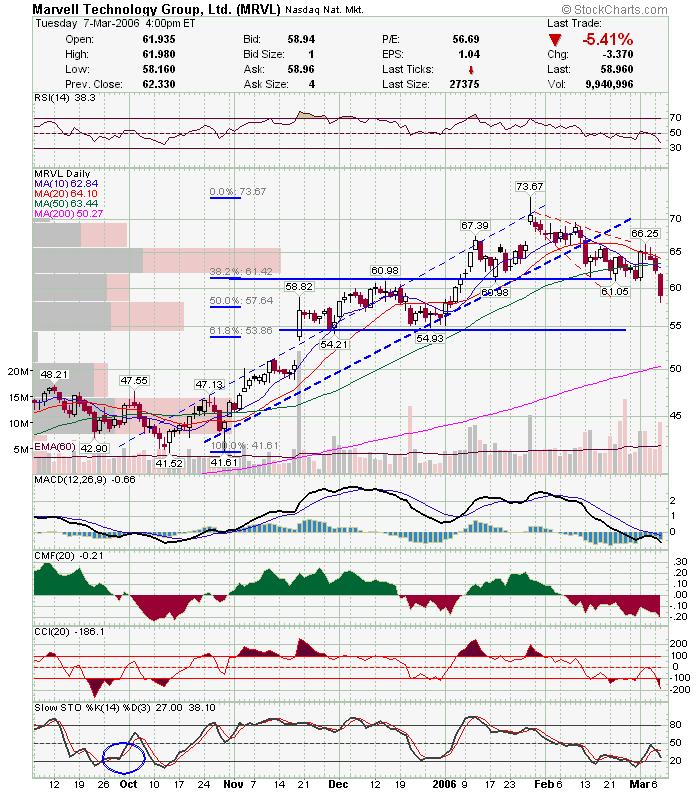 FFIV has pulled back to ttrendline and no serious technical damage has been done here.
 TRN is setting up for a test of trendline support and had a doji at support.
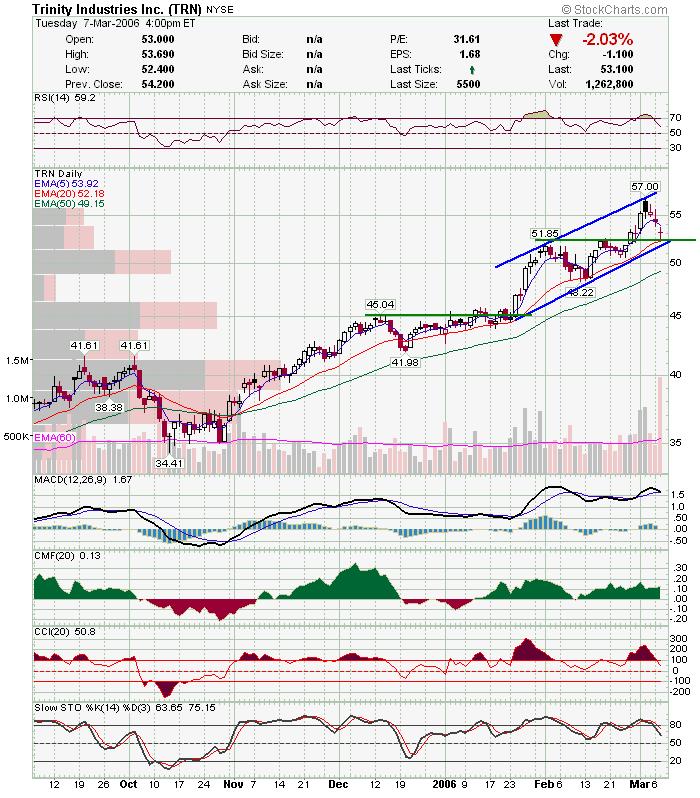 TRAD gave back yesterdays gains but has held the trendline. Watch tomorrow's action for a break to either side.
While I am thinking we get a bounce soon, I don't think it will be the beginning of any sustained move. Trade cautiously.
Good Luck,
DT
As I posted earlier, the divergence between GLD and gold stocks shouldn't last too long. I was expecting Gold stocks to turn up, and the did for a couple days, and now they all turned down in unison. There is a chance that we have made a near term top in gold, but we have to wait for confirmation. Here is a chart of GLD. GLD is an ETF that trades gold bullion. The gold index chart is similar to this one. It has been trading this channel nicely and bounced recently off the trendlline and 50sma. It started to trend higher before todays sharp pullback. Watch the trendline and 50sma over the next couple of days to see how GLD reacts. GG has been the strongest gold stock. They gapped higher on earnings news, and then pulled back most of the day until a little run in the afternoon.
 NEM broke out of the primary channel, and may get a bounce in the previous channel.
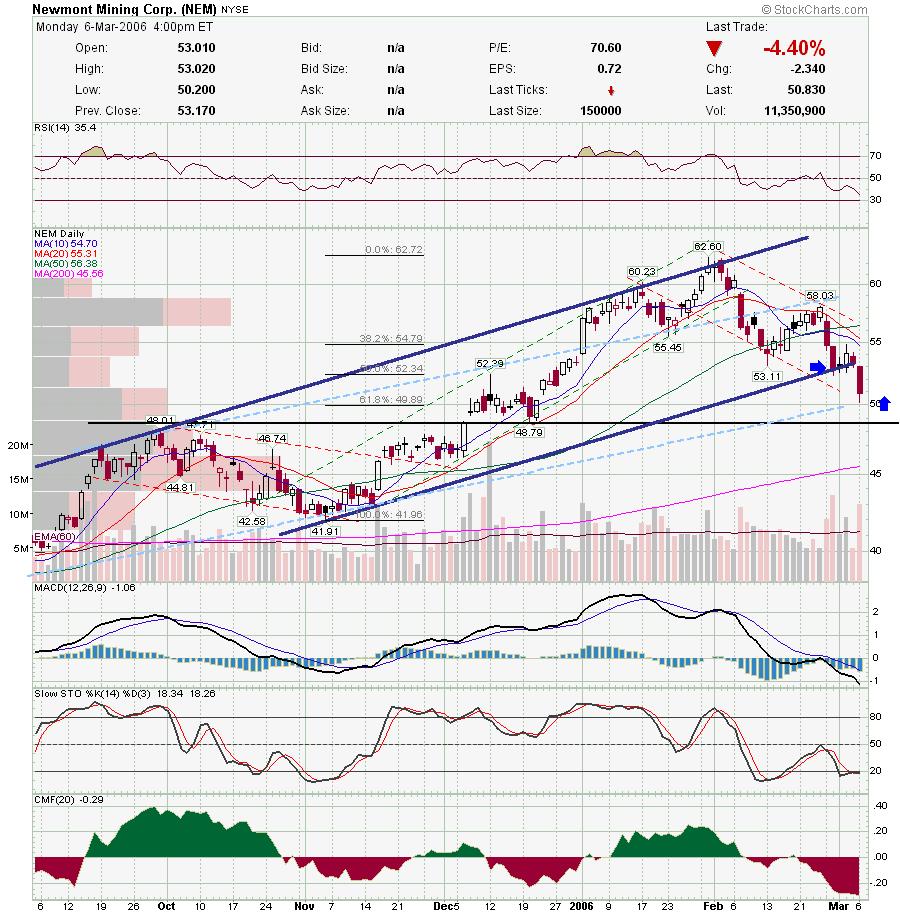 AUY fought back today and closed above support.
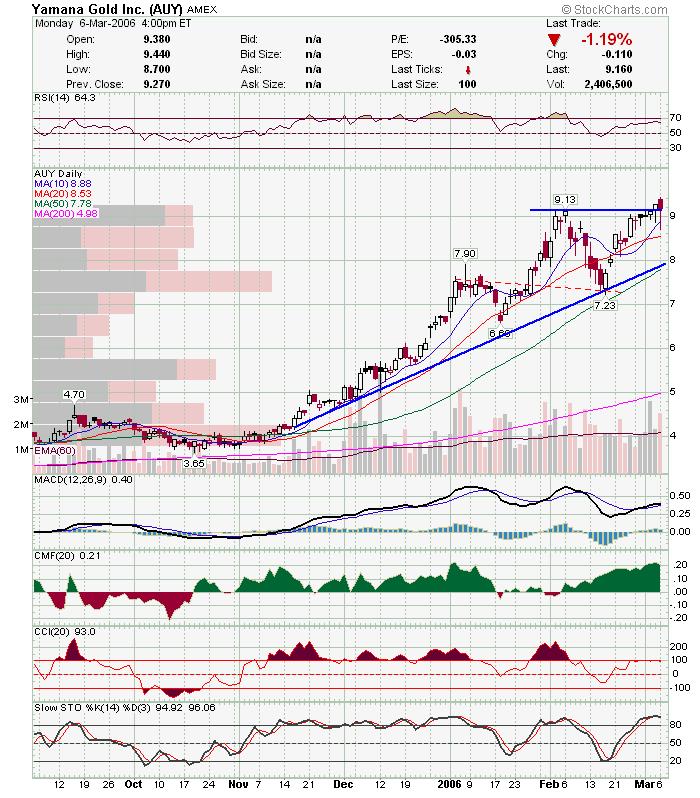 PCU is not a gold stock, but I think it's worth mentioning that most metals trade together. PCU is near a trendline, and if we get a bounce in precious metals. I would expect PCU to follow suit.
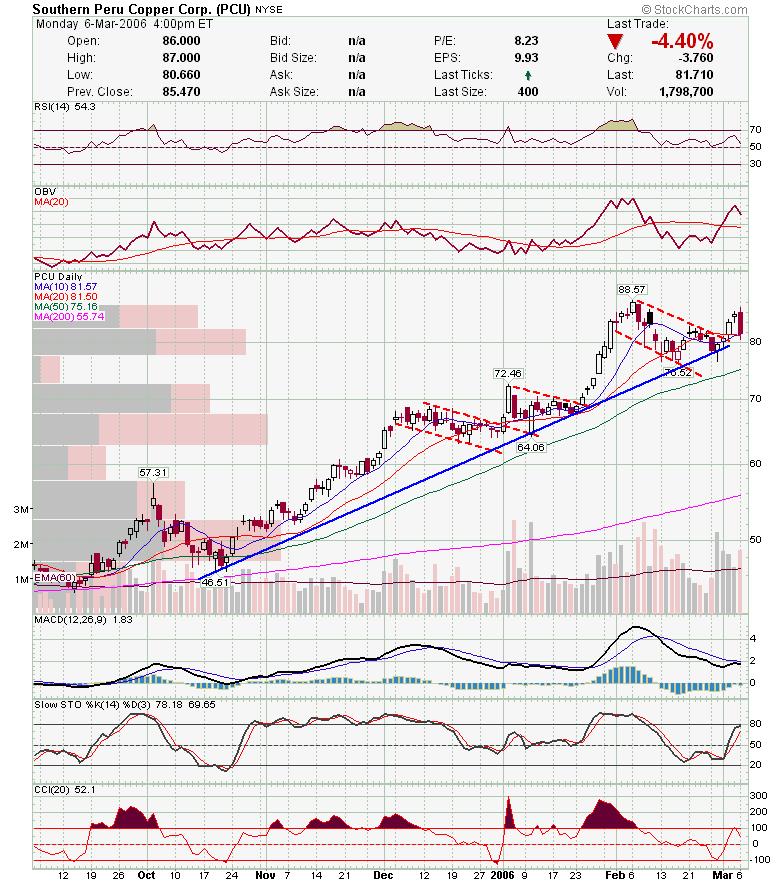 TRE is has had support on this trendline before and is also trading in an ascending triangle base.
 Be sure to read my posts from last night below.
Good Luck,
DT
Here are some charts for tomorrow.
LIFC had a strong move prior to earnings release tomorrow. Let's see if someone knew something, or if retail's are getting screwed.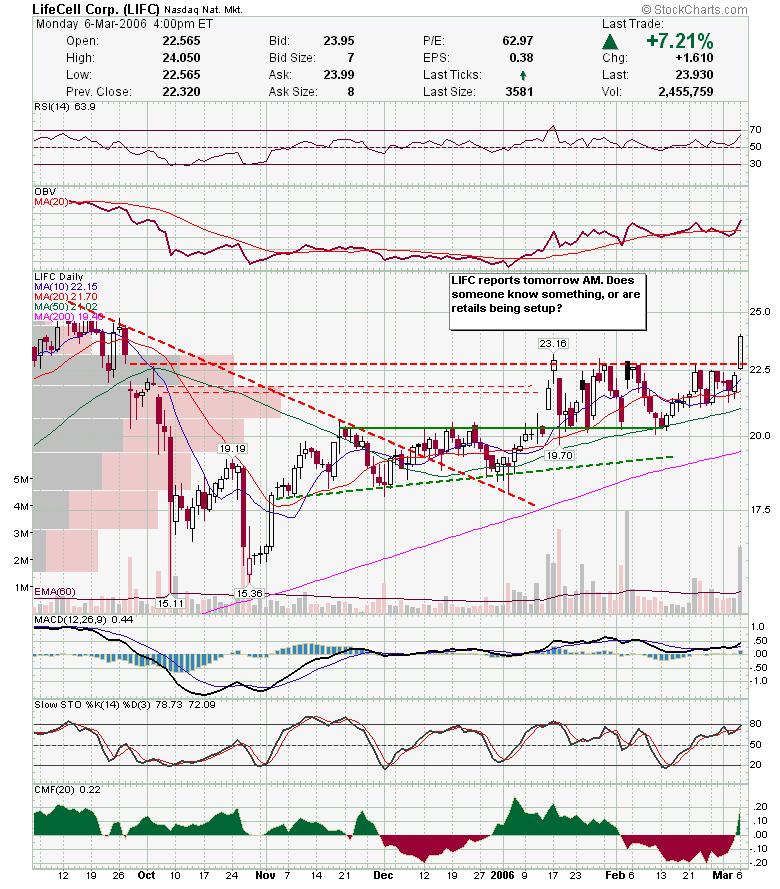 GFIG is in danger of falling below channel.
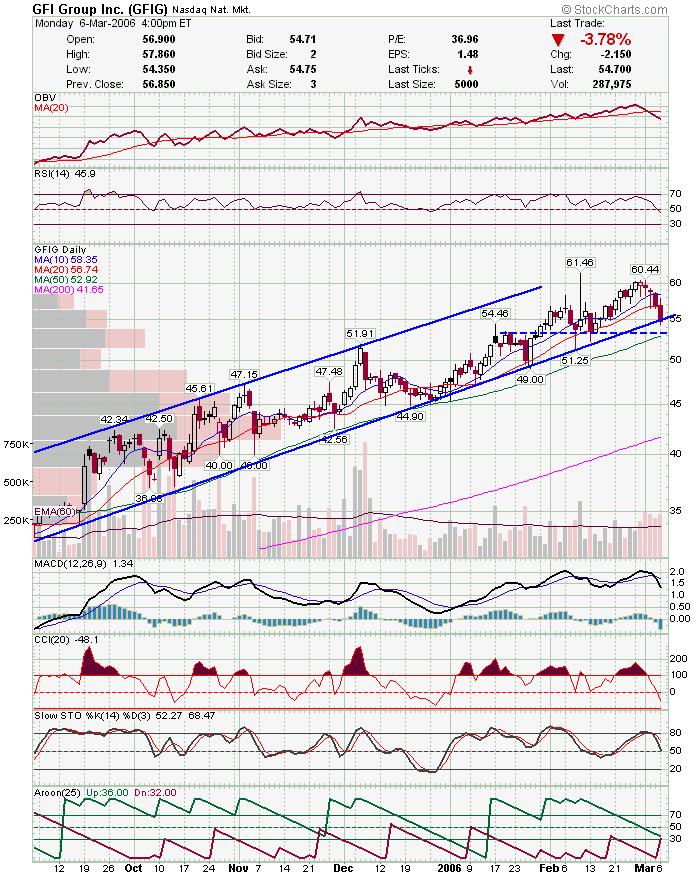 GOL may break below support here.
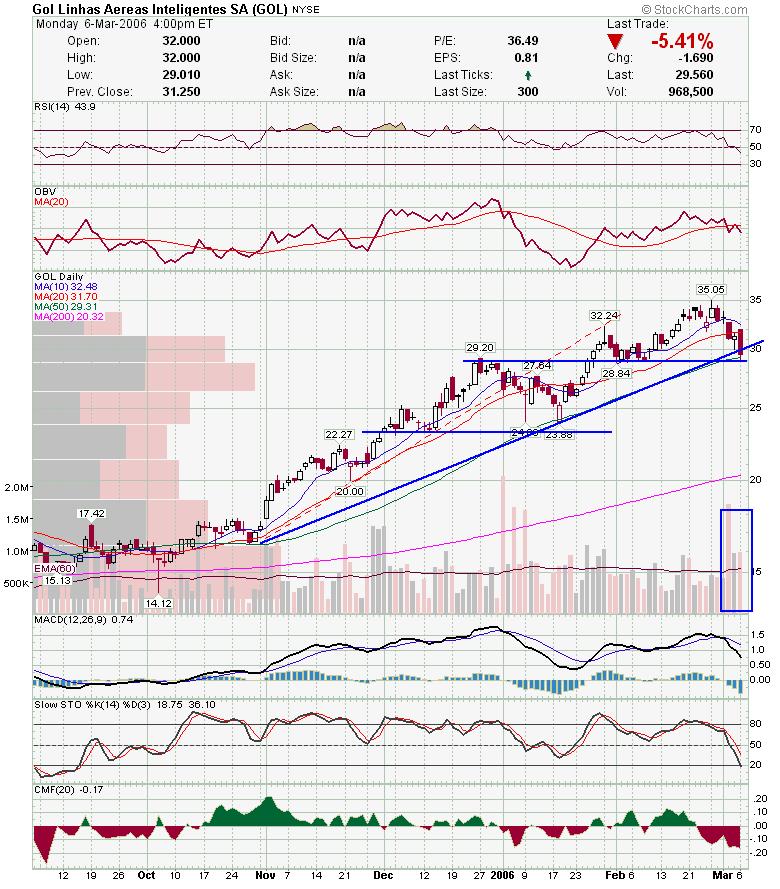 HANS is acting like a leader again, and showed nice strength in a down market today.
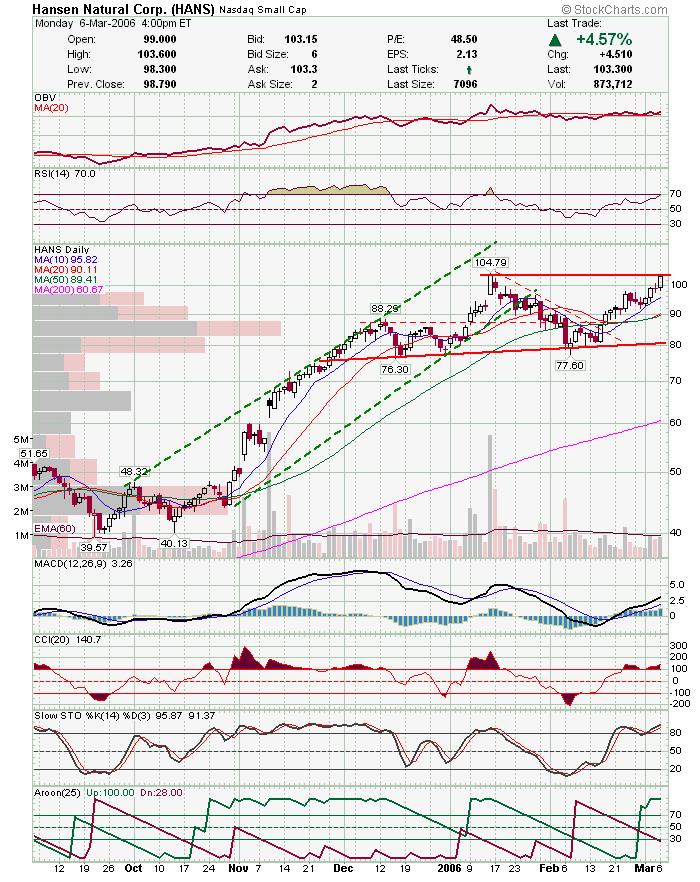 RACK also showed strength and is trading near high.
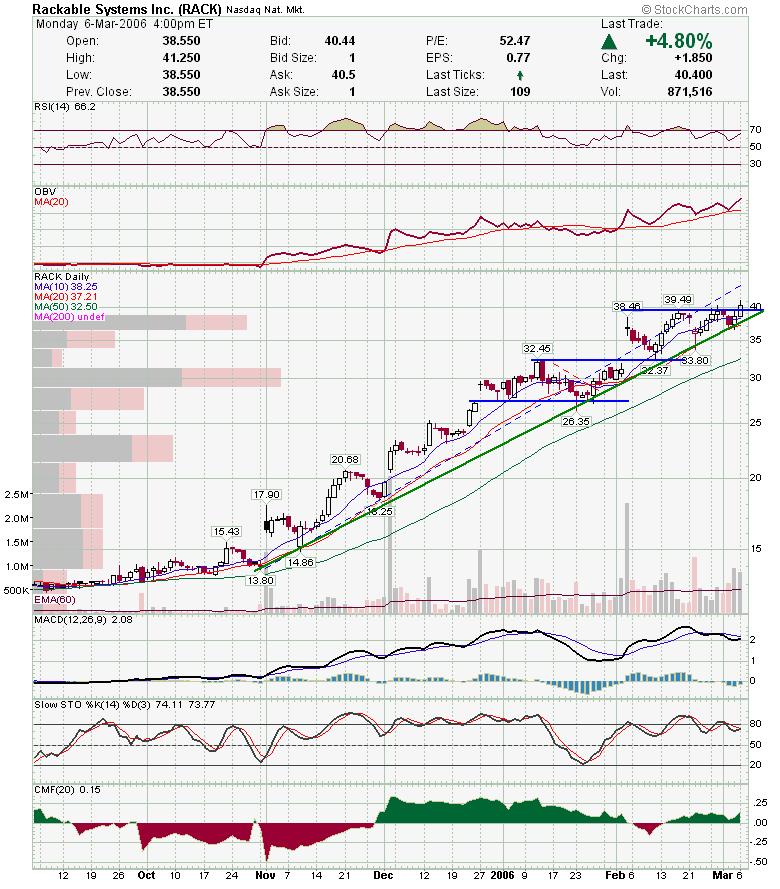 NGPS has broken downtrend and is now in a nice little uptrend. They released after hours are were trading higher.
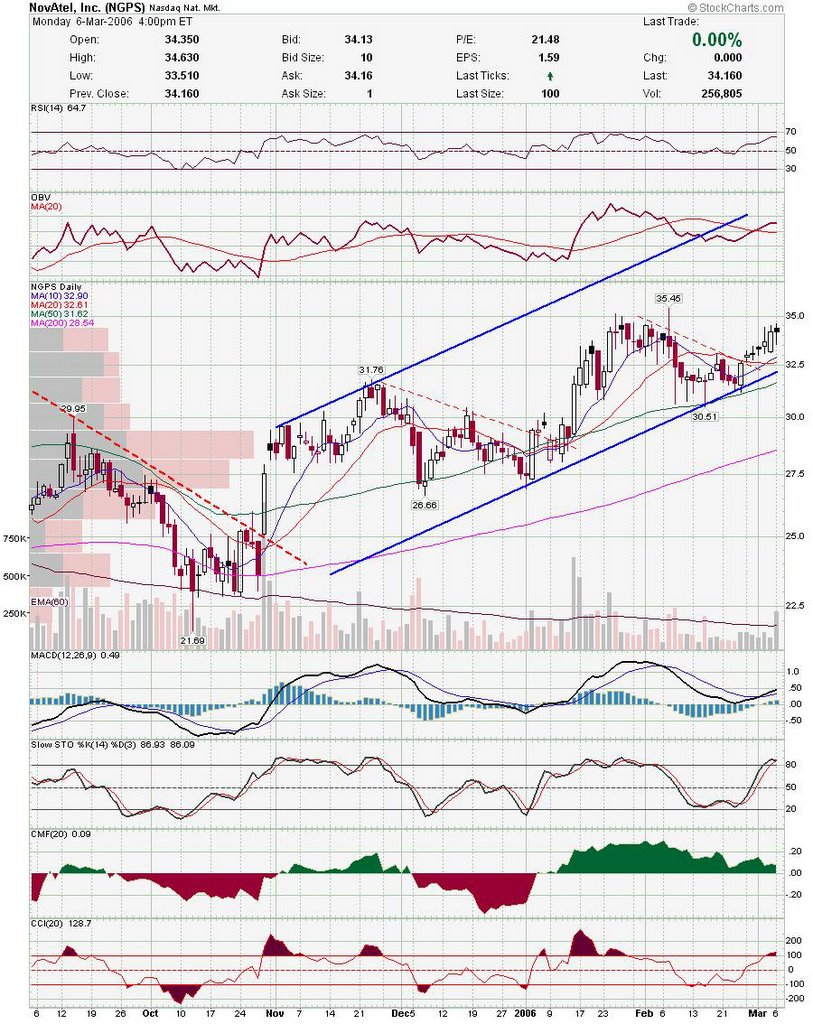 A reader asked for an update on CKCM. CKCM fell below support and is trading under 50 sma. It is wavering at support on the weekly chart. I wouldn't short for several reasons one being that any news will send CKCM gapping higher because earnings were actually pretty good. Another is that CKCM may be at support from the 61.8% retrace of the last leg up. I am flat on CKCM and waiting to re-enter.
 ENG had a nice break of the pennant type consolidation.
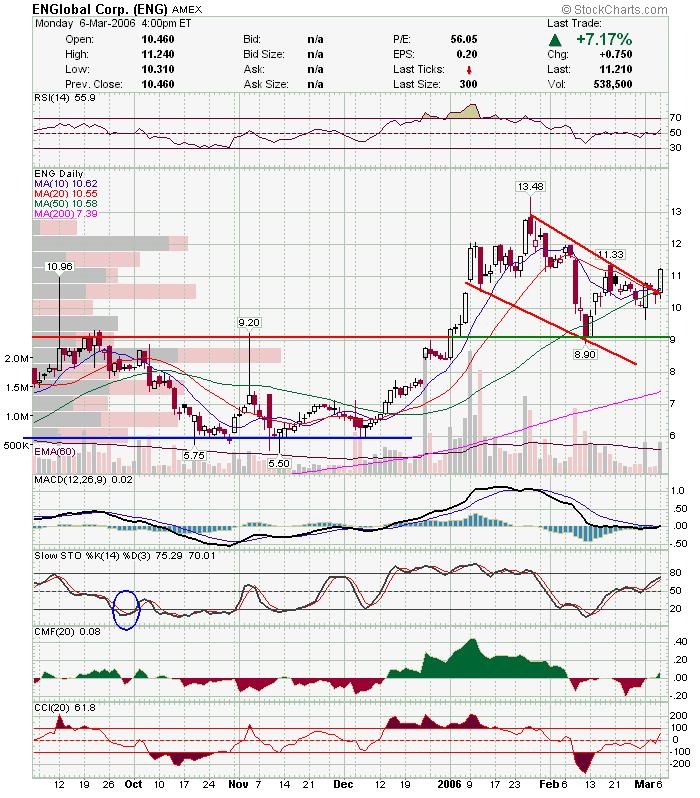 HAL will be a good play if OIH gets a bounce in the next couple of days.
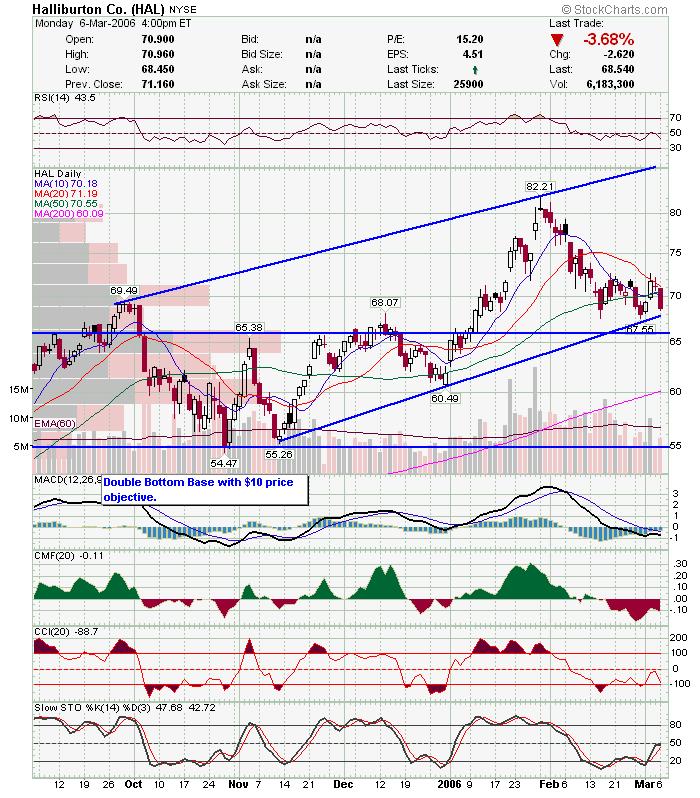
Thats it for tonight. I will be posting my gold charts tomorrow. GLD is back at trendline and may of double topped. I also have a few gold stocks to watch in case of a bounce.
Good Luck,
DT
My apologies for not getting this out sooner. I was having problems uploading earlier today, and I was swamped all afternoon. Here are some of my charts on the Nasdaq. In trying to gauge where we are we need to take a step back and look at the bigger picture.
Looking at the monthly chart, you can see that the Nasdaq has been trading sideways (or drifting up) for the past two years after the first move up from the .net crash. In the grand scheme of things we are near 4 year highs.
Here is the weekly chart for the past three years. The nasdaq has clearly broken a rising wedge which can only be classified as bullish. However, the red channel depicts a possible new trading range as the uptrend accelerates. The nasdaq is currently in the upper range of the channel and the MACD crossed down today which may be near term bearish. The Nas can drop over 100 points from here an still be in the rising channel. Here is my daily chart. This takes a closer look at the red channel in the weekly chart. There are clear channels within the overall trend, however, things get a little messy towards the end. The nasdaq was pulling back in a bullish pennant recently and broke above it, however, it is currently testing that pennant. In doing so, it may of formed a double top, or may be resolving into a triangle (shown in dotted purple). I can't predict what will happen as much as I wish I could, but market internals have been a little bearish and indicators are diverging. There is a chance we bounce between the blue and purple lines until the direction is decided.
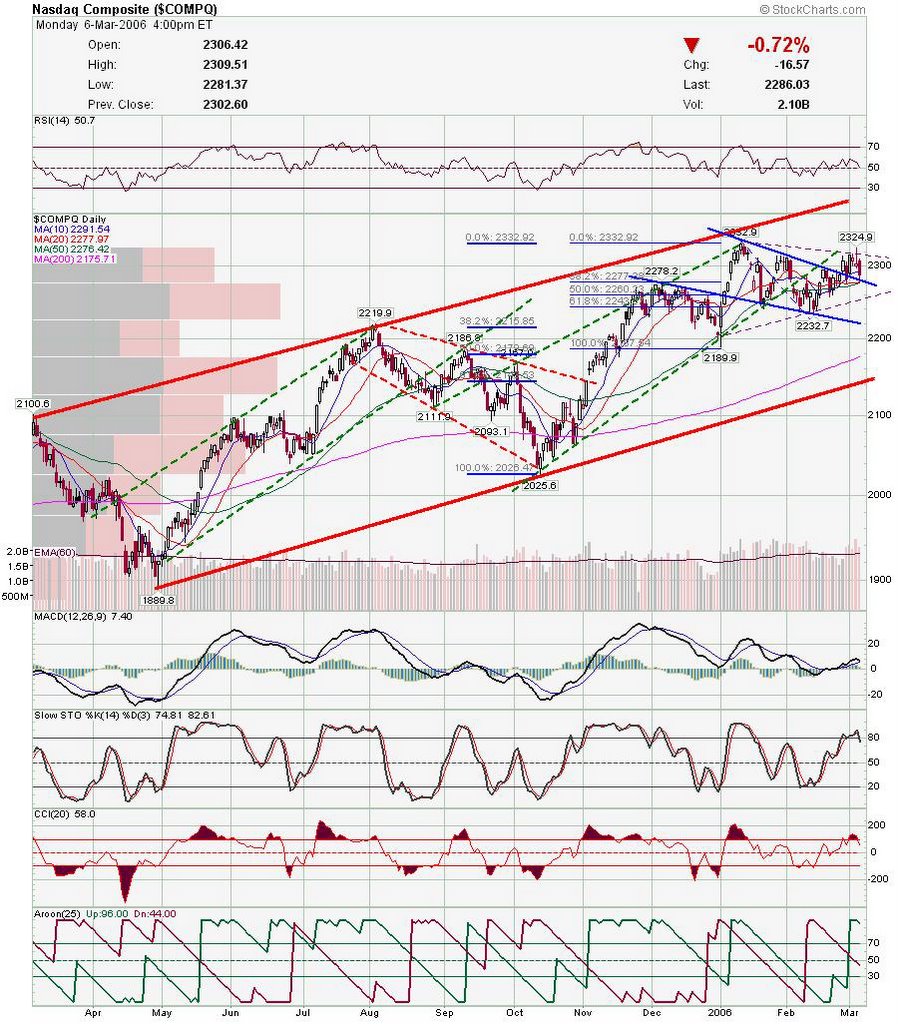 Here is the hourly chart. Rising channel is broken and Nas stopped at 200ema. Indicators are oversold, so it looks like Nas will get a technical bounce tomorrow.
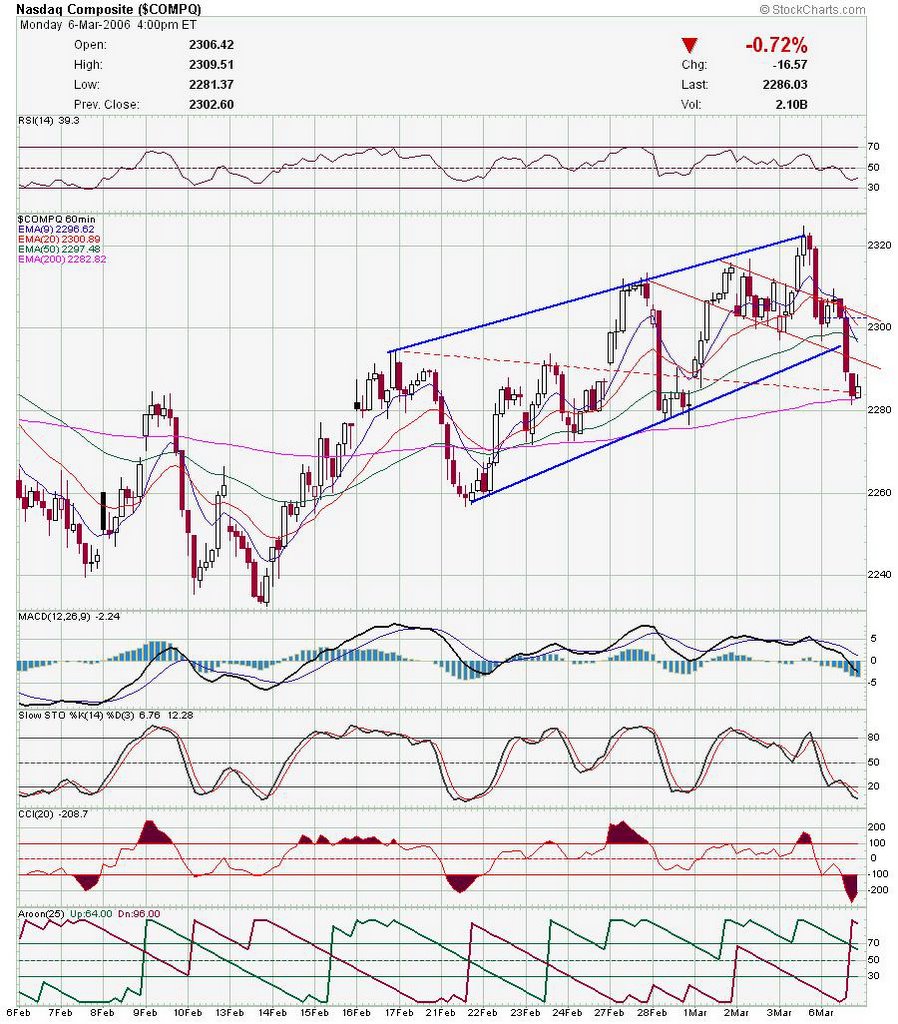 So, as Austin Powers would say "but what does it all mean?". I can't predict which way we are going, but there are clues to the near term direction. The weekly MACD crossover, signals a possible downtrend over the next few weeks. The daily is showing possible support, but plenty of resistance overhead, and the hourly is showing oversold conditions. My guess, and this is only a guess, is that we get a technical bounce soon, followed by more choppy action. I wish I could provide a more clear picture, but if it was that easy, I would be on a golf course in Hawai. Good Luck and I will post a few charts later.
DT
I will be posting my nasdaq charts to give a better perspective of where we stand either later tonight or tomorrow morning. To sum it up though, we are trading above resistance on the weekly chart and wavering on the daily. I would expect more sideways action the next few days, but I think we are close to moving in one direction or the other.
One thing to mention real quick. I saw it mentioned on a board the other day that I listed so and so stock first on my list so it was one of my preferred plays. I just want to clear up, that the stocks are listed in no order whatsoever. I go through my charts and save them all into a folder as I go along. When I'm done I upload them all to the blogger in whatever order I happened to save them. It isn't until I review the blog that I decided which I am more likely to play. Also, one of the intentions of my blog is to post what is on my watchlist and how I use technical analysis to indentify high probability trades. Please keep in mind that several of my charts don't produce the action I was looking for and therefore I don't enter the position. Also, sometime I post a mix of charts so that I can have options available if the markets decide to surprise me.
Lot's of charts tonight with a good mix of both short and long.
PWEI sold off after earnings, but has come back strong and look at volume for past two days.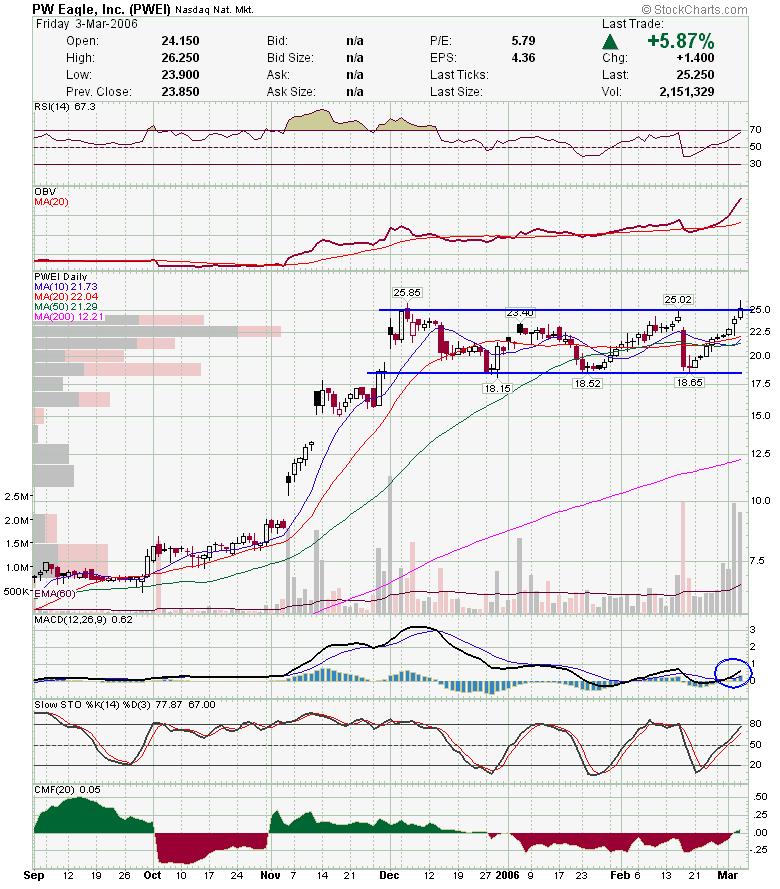 CWTR was mentioned last week and I still think it's a short. Set a tight stop as it is near it's high if you do short.
 DGIN looks like it may bounce off resistance line.
 FDG broke out of a contracting triangle and may be headed higher.
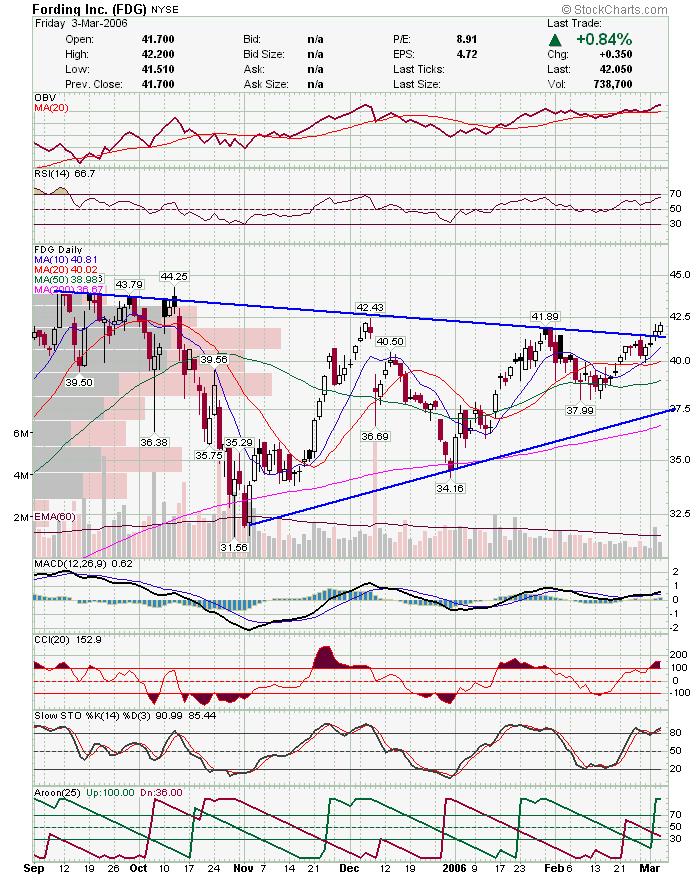 TTI looks good here and has room to run.
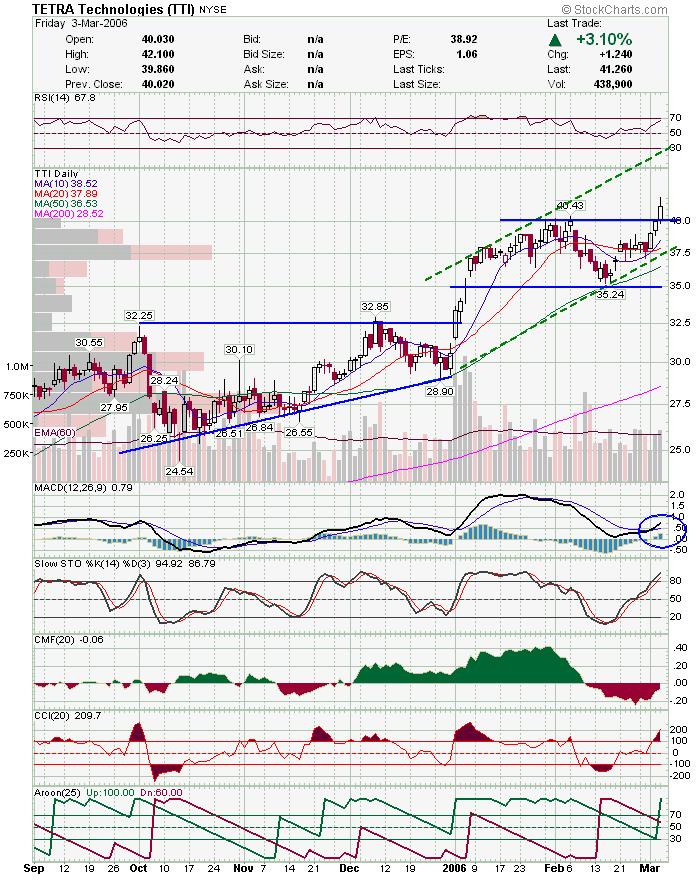 ATI looks similar to TTI and has blue skies above.
 DNDN has been fighting this downtrendline for a while. The trend is your friend.
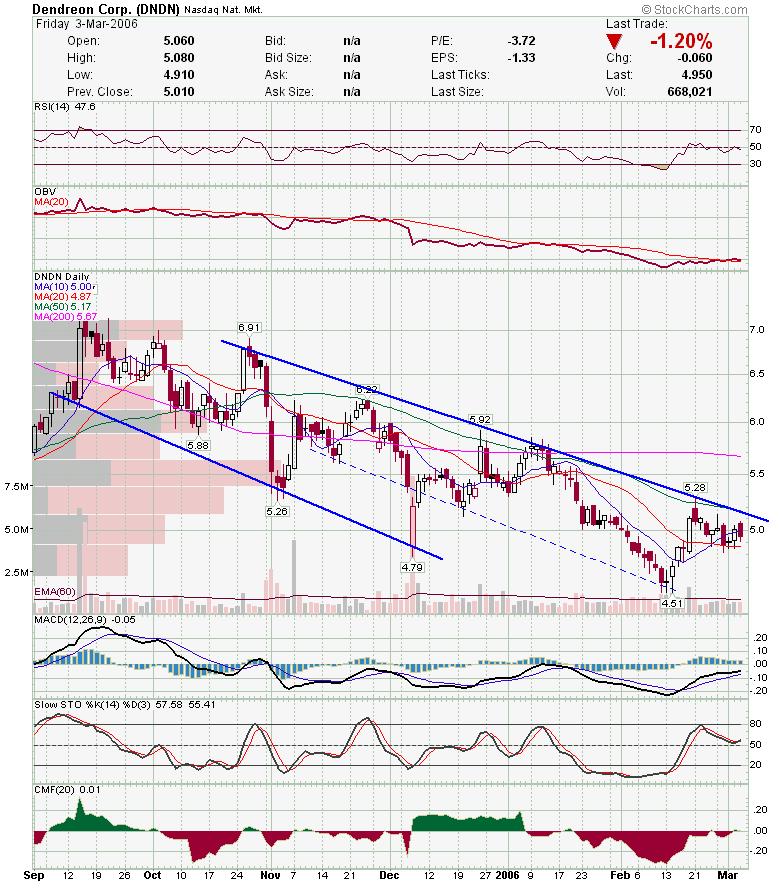 LUM may break down here.
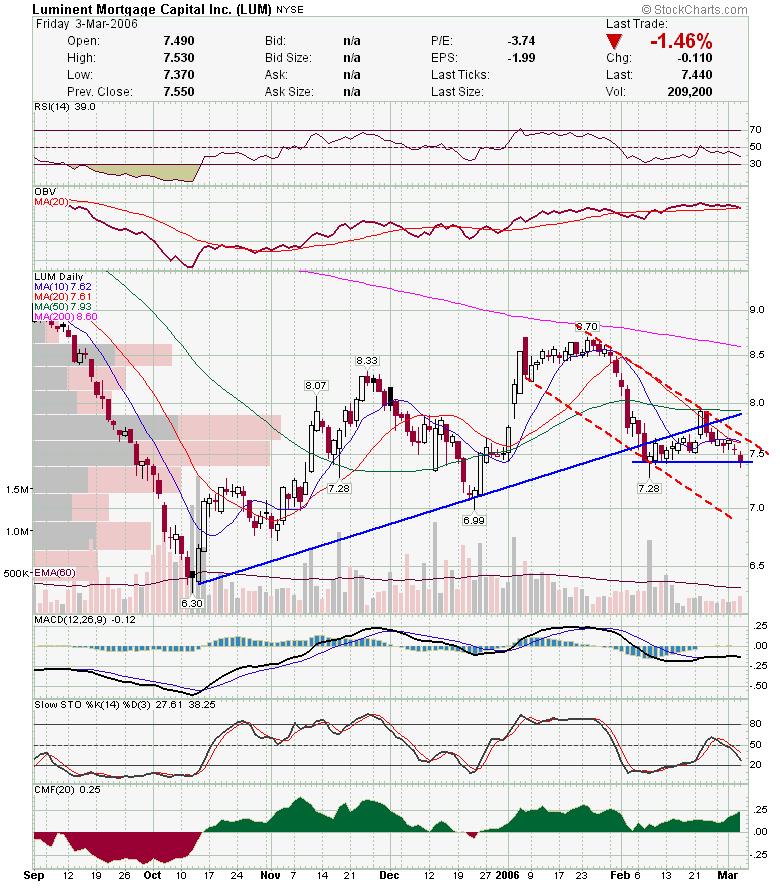 TRAD has been hugging it's channel lately. Watch for a move in either direction.
 CPWM has formed a nice ascending triangle, but looks like it will fall out of the bottom of the triangle. 200 sma is strong resistance.
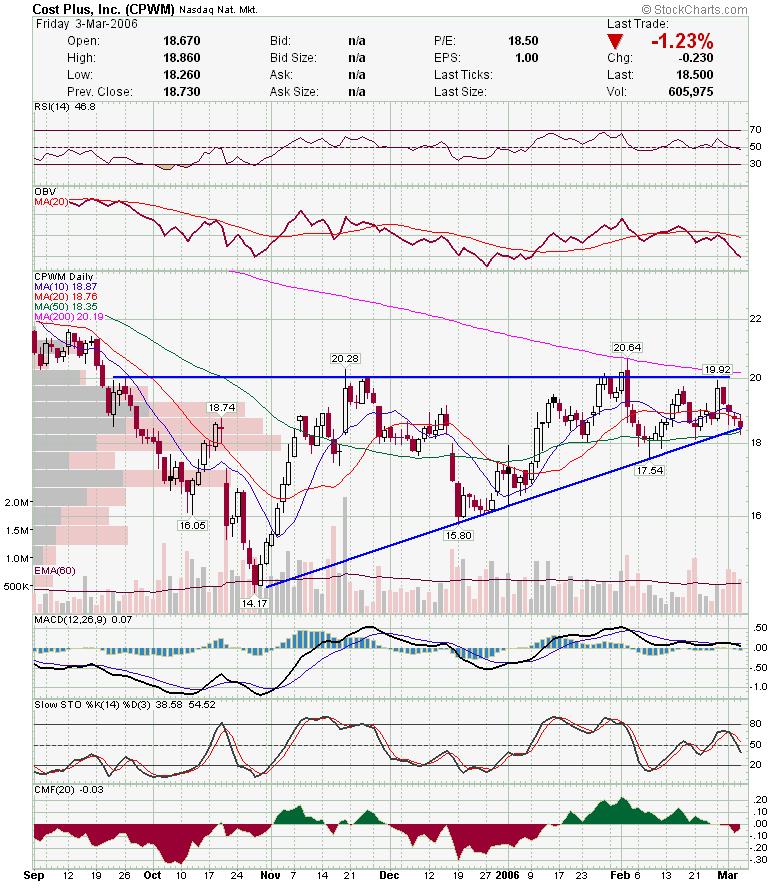 NILE is another possible short. It is up against gap resistance and had a long wick with the rest of the market Friday.
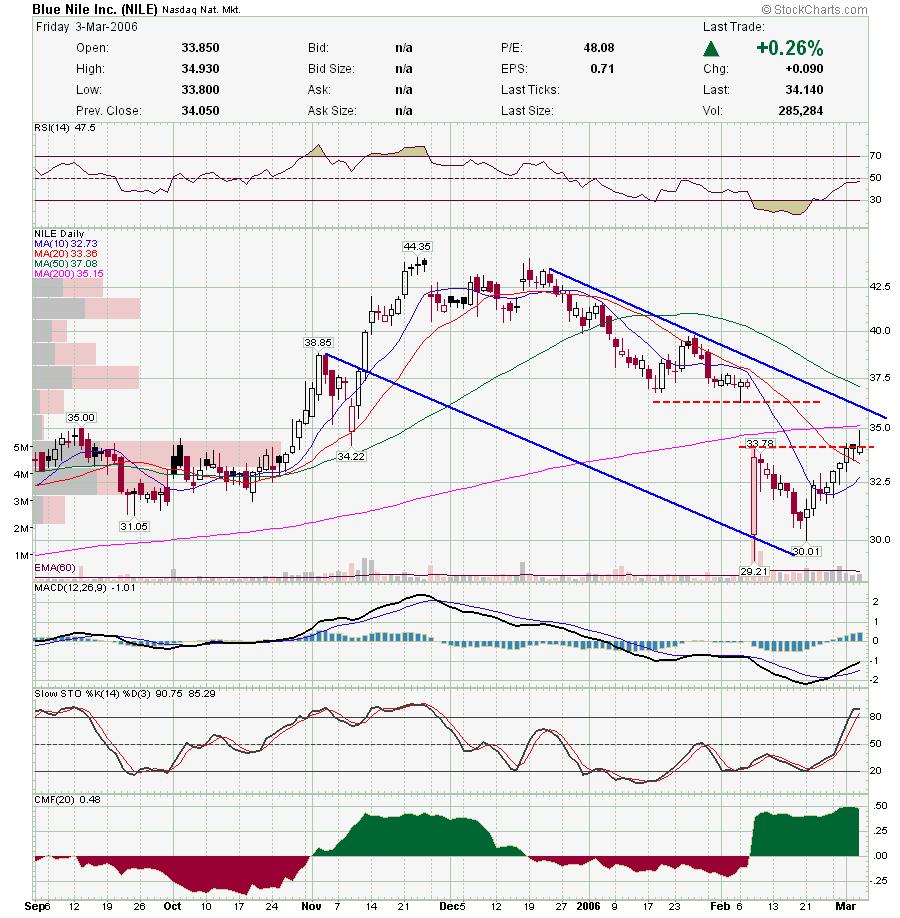 CTRN just broke a trendline so it looks like it is in trouble.
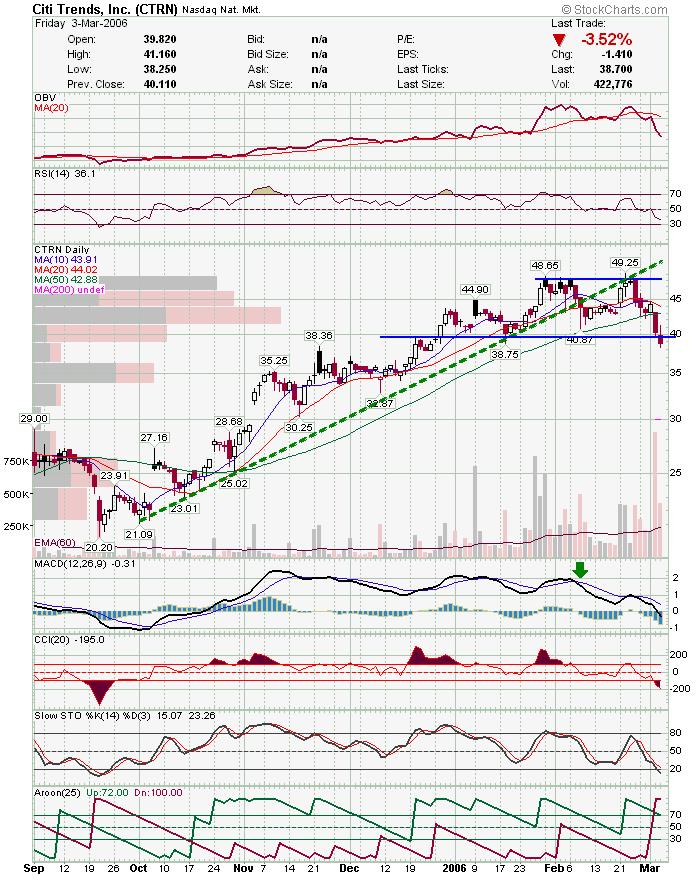 PEET has been a weak stock and looks like it may break down from the descending triangle.
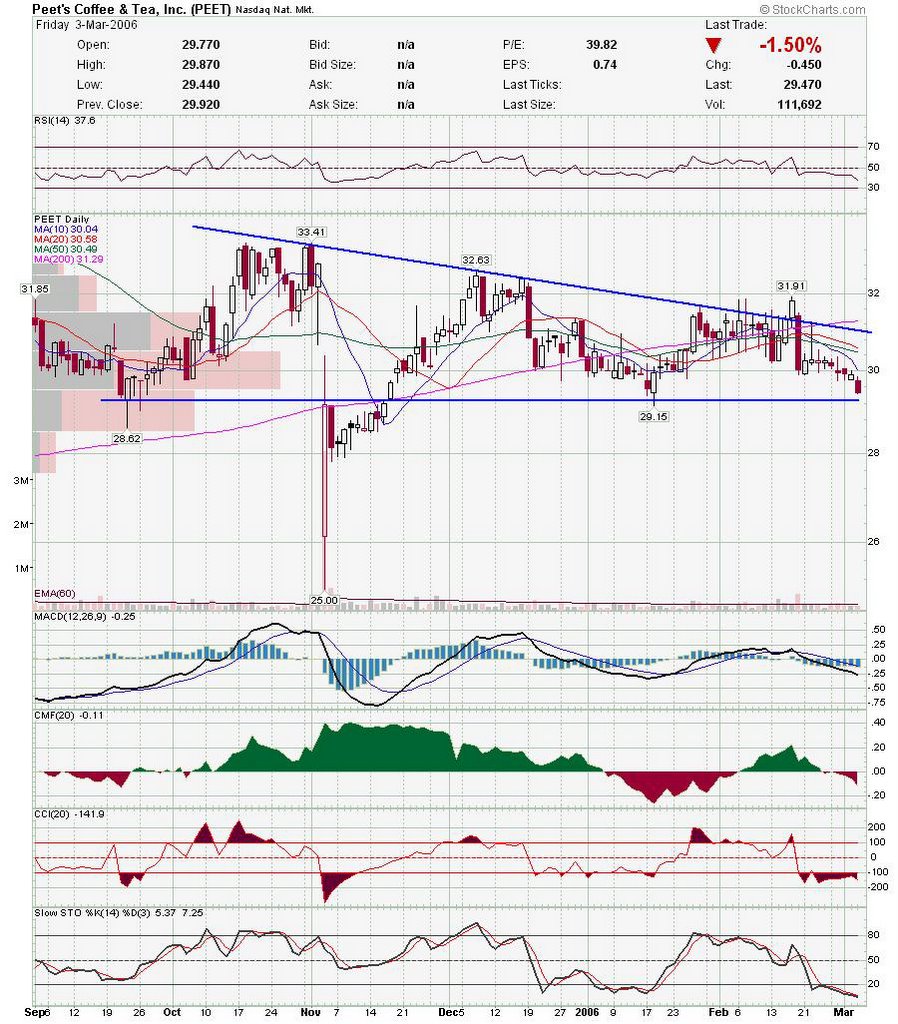 JCOM may still head to upper trendline, but it looks pretty weak here.
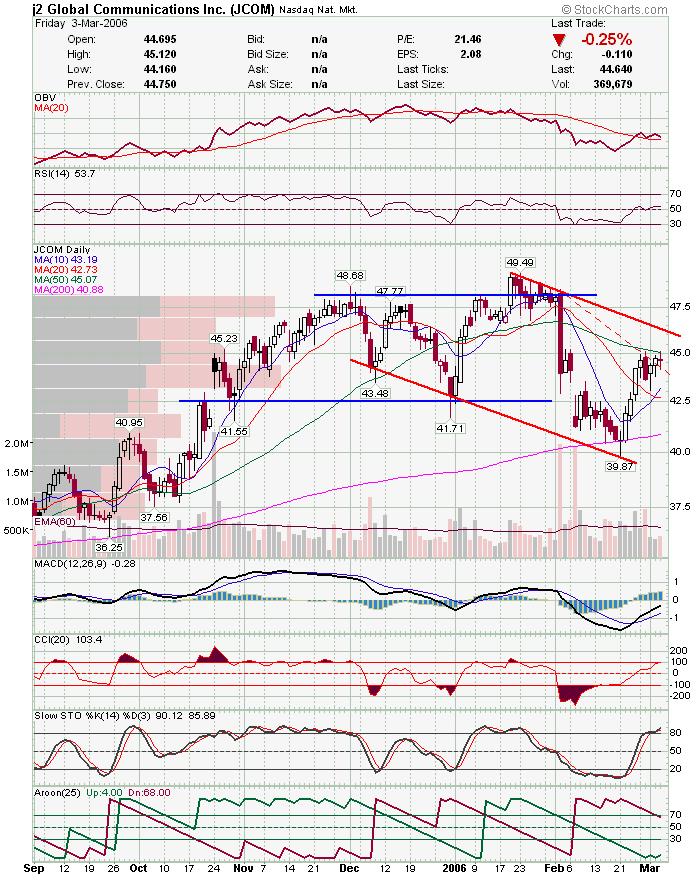 EZPW has held above the breakout area, so a move higher is more probable then a breakdown.
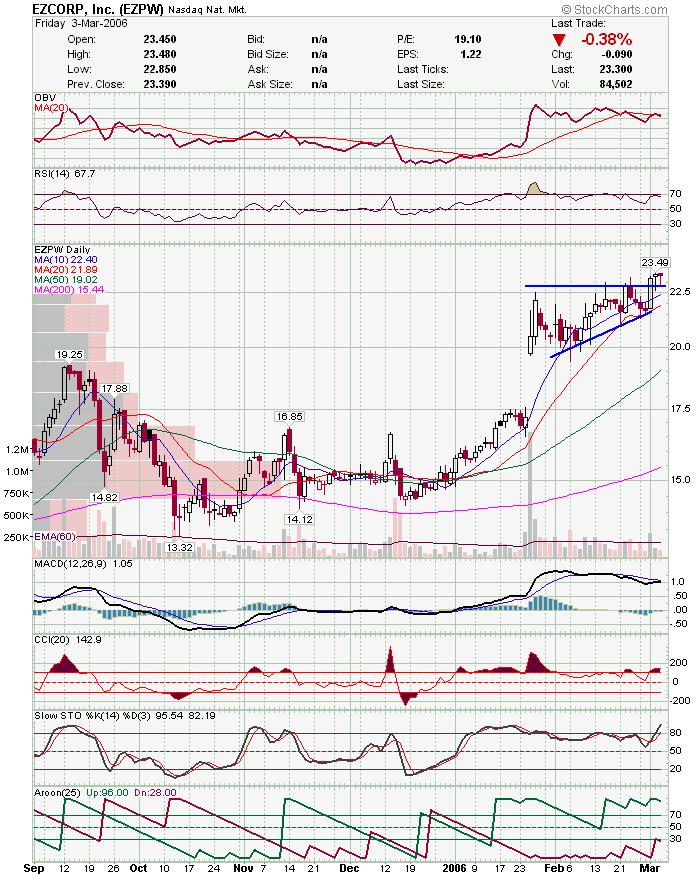 FCFS looks like it has more support then resistance here.
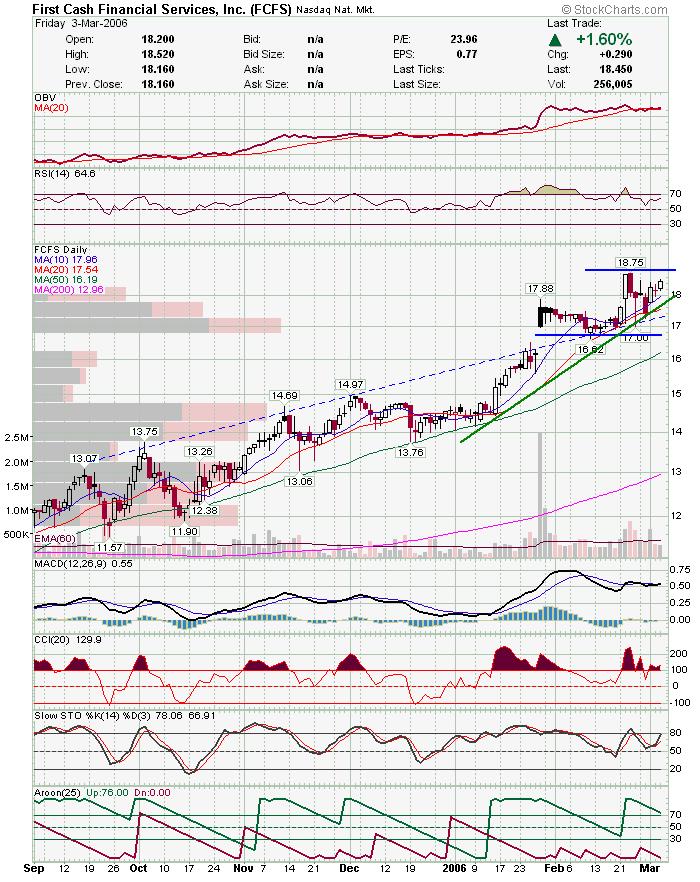 I looked at KEYS as a possible long the other day and it looks like it is broken. Watch for a lower low if you are gonna short it.
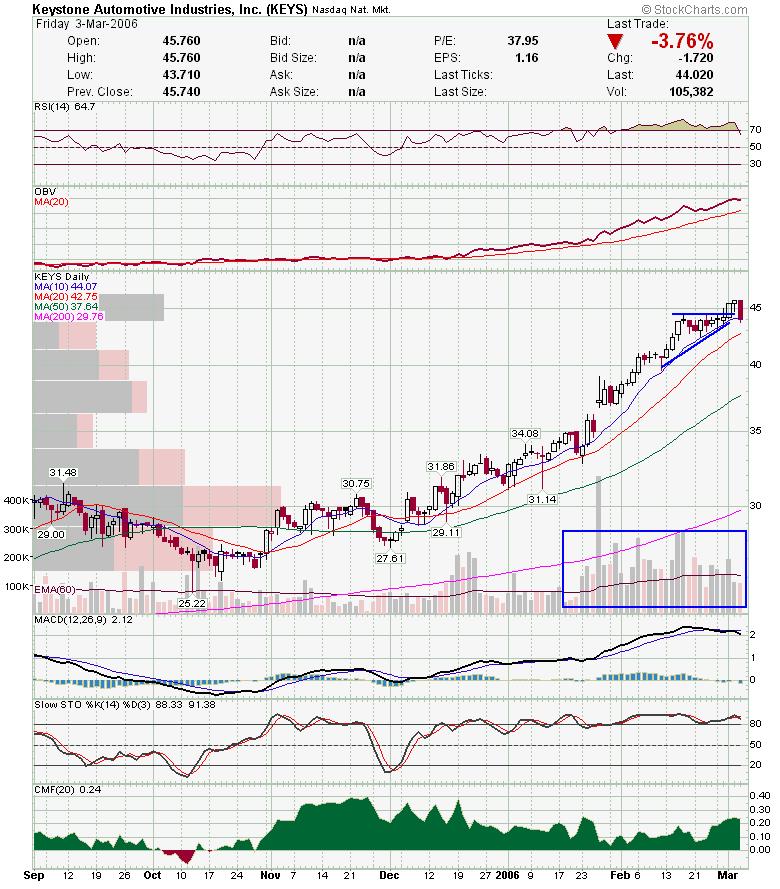 USG looks like it is gonna hold support and bounce to upper range.
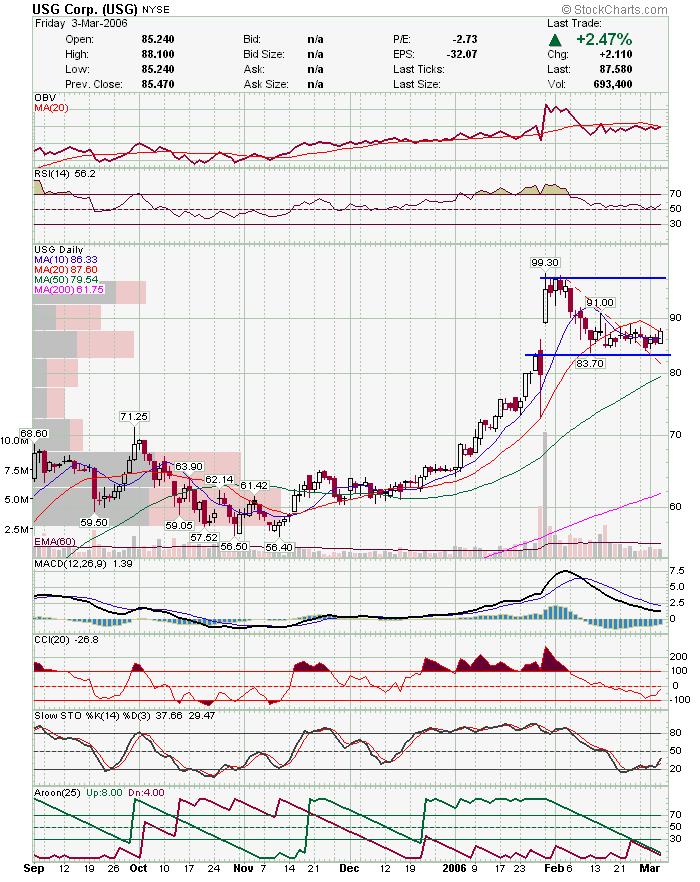 WSO is right at support, so watch to see if it bounces or breaks down.
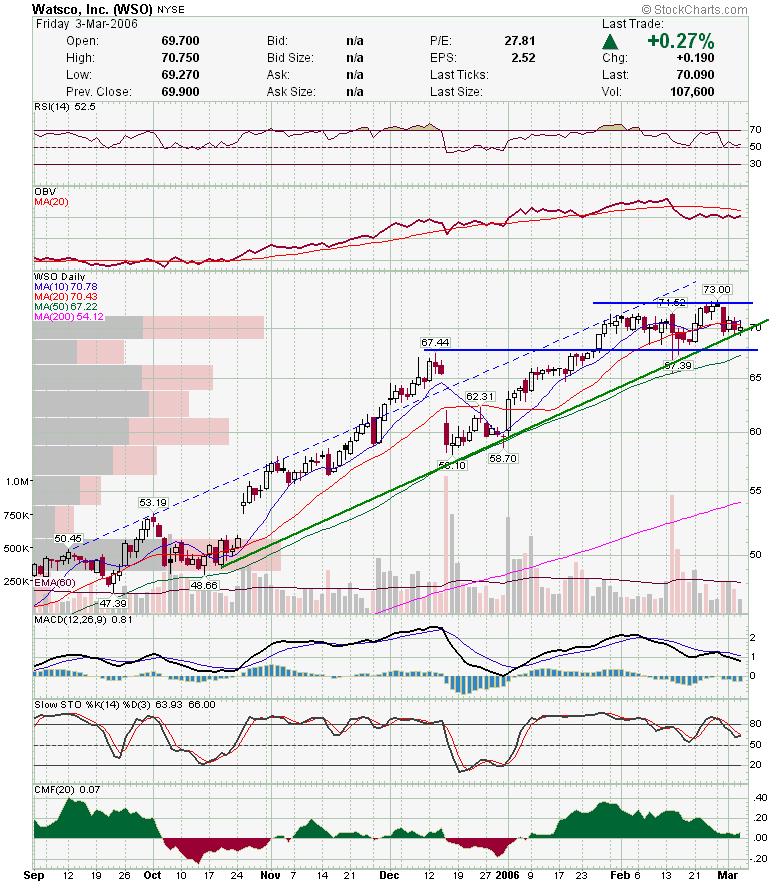 OXPS is running out of room and will probably make a move now. My guess would be higher.
 PMTI broke the downtrend but has to get over the redline before I would get excited. If it gets back into the horizontal channel, it may go back to top of range similar to CWTR's chart above.
 HOMS had a nice break of the triangle Friday.
 RATE is looking weak but has a nice clear channel defined. Also, looks like 35 is clear support.
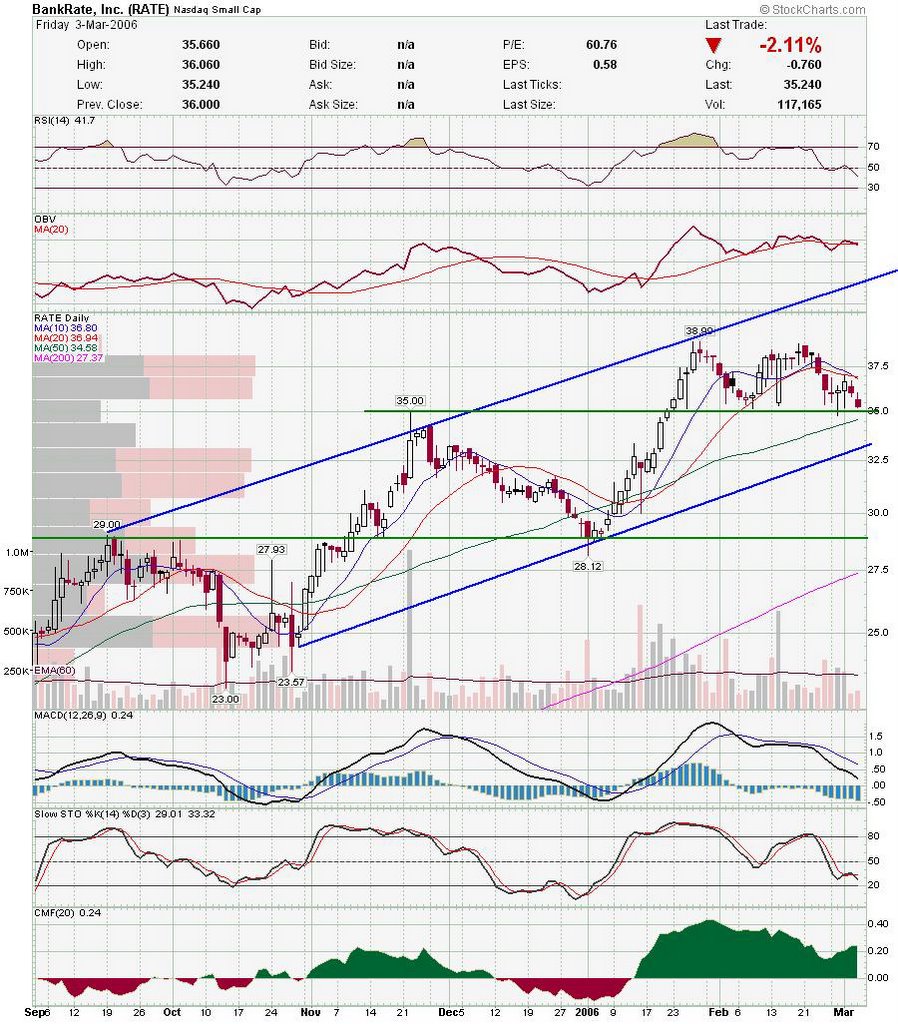
Good Luck and good trading,
DT
Subscribe to:
Posts (Atom)


