I don't have much time tonight so I will just post some charts.
Bulls defended a gap down today by completing a bullish engulfing pattern in IIP. Long wick may show some resistance above, but IIP is technically over the significant resistance in this range. IIP is up about 38% since first recommended here.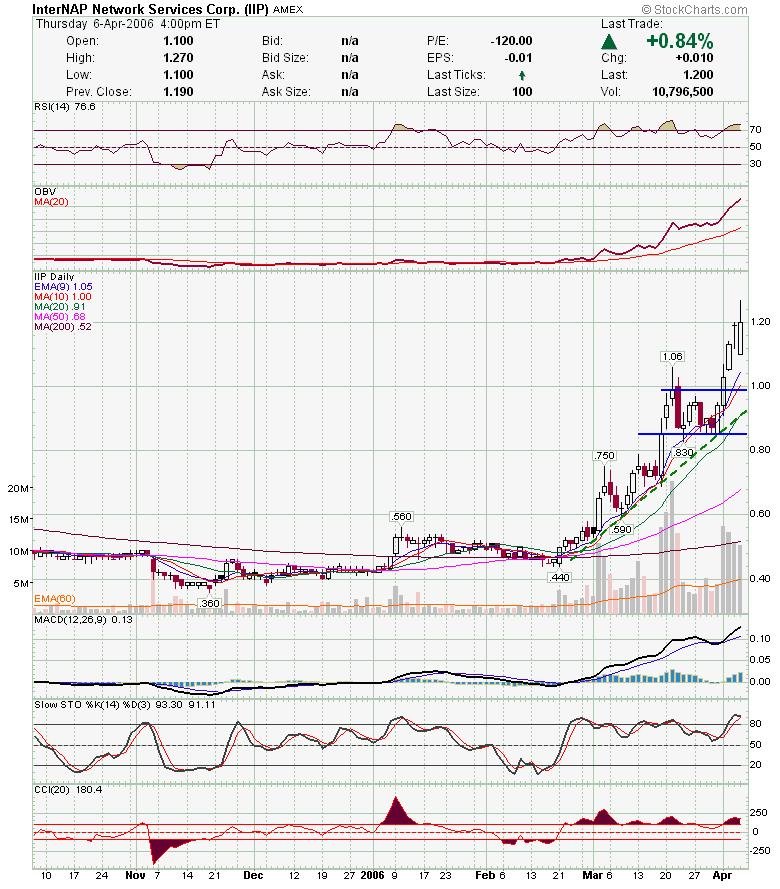 XTRX has consolidated a little bit here and looks ready to roll.
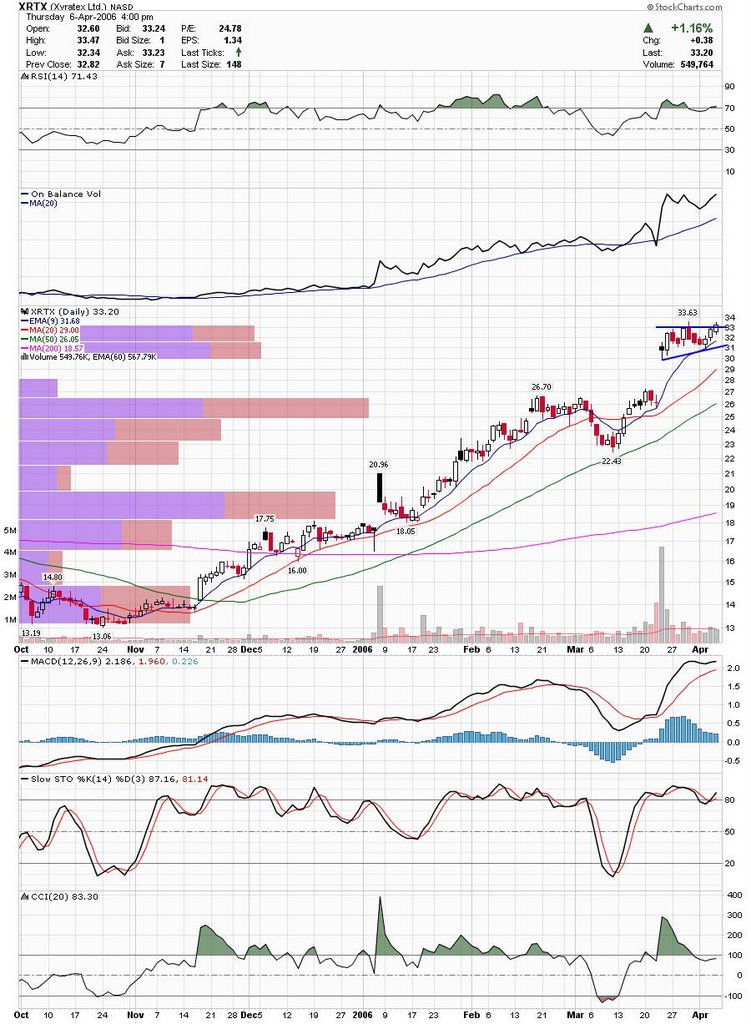 PLXS is out of the triangle already.
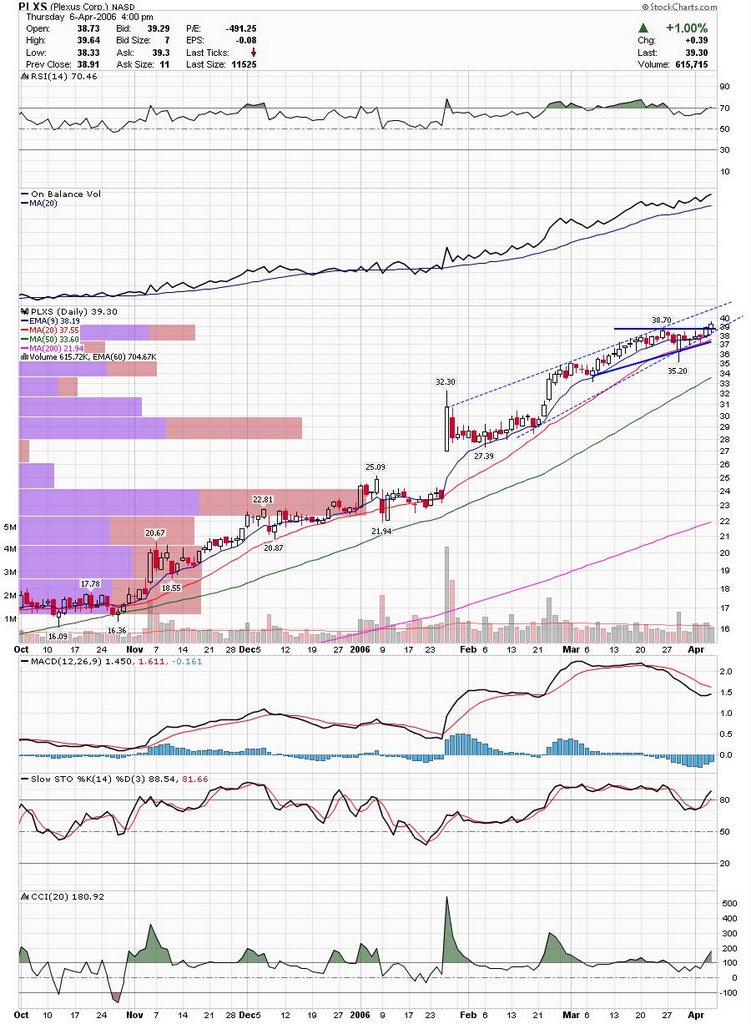 RMBS had a nice move today as was one of my better daytrades today. It looks like it will follow through after a strong close.
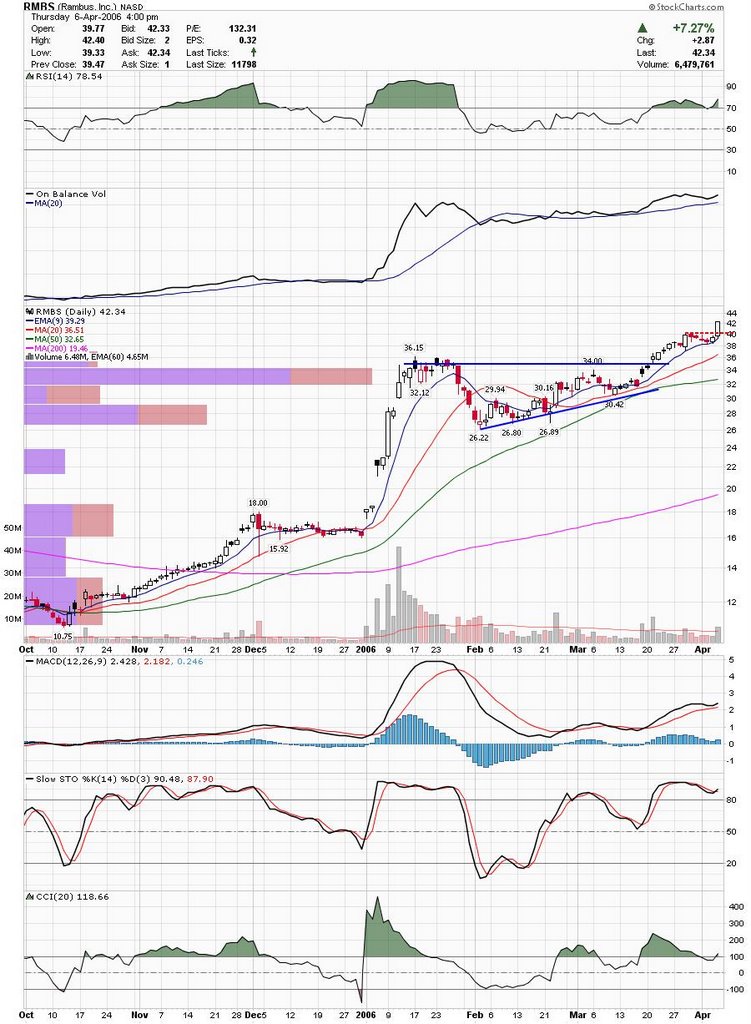 EGY looks ready to make a new 52 week high.
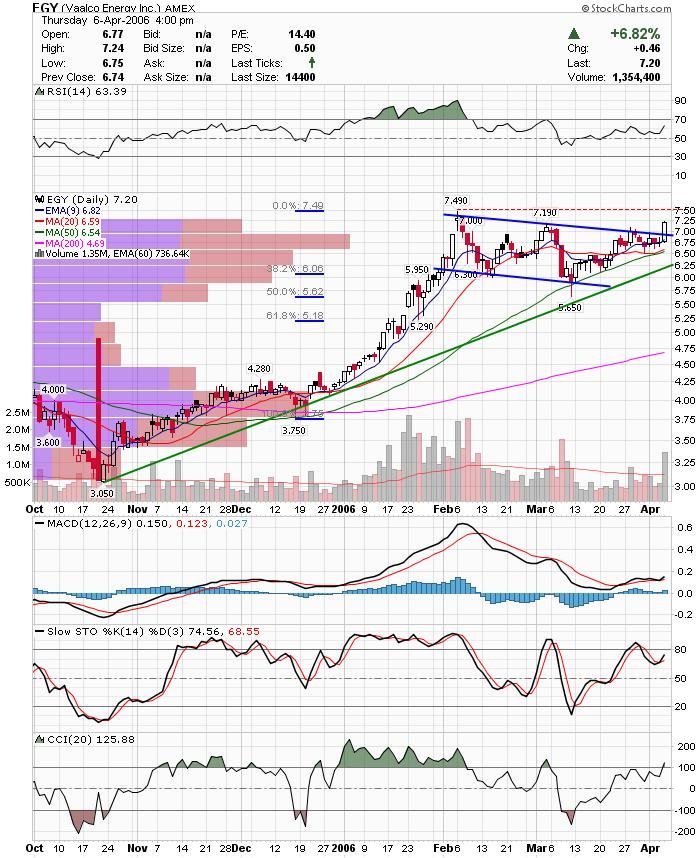 CMC may be ready to resume the uptrend.
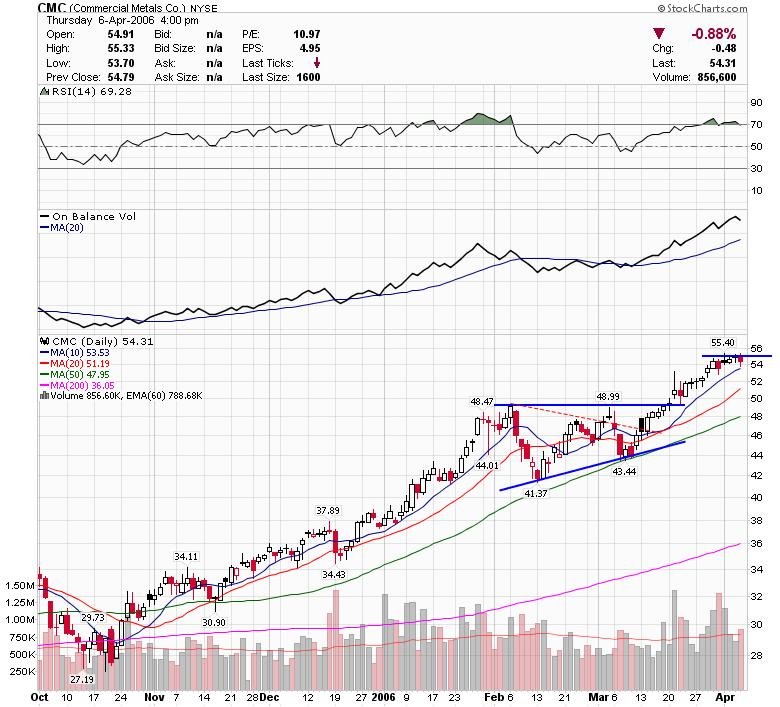 GG hit an all time high today and if Gold can close over 600 watch out.
 PAL may be ready to clear this base and break to new highs.
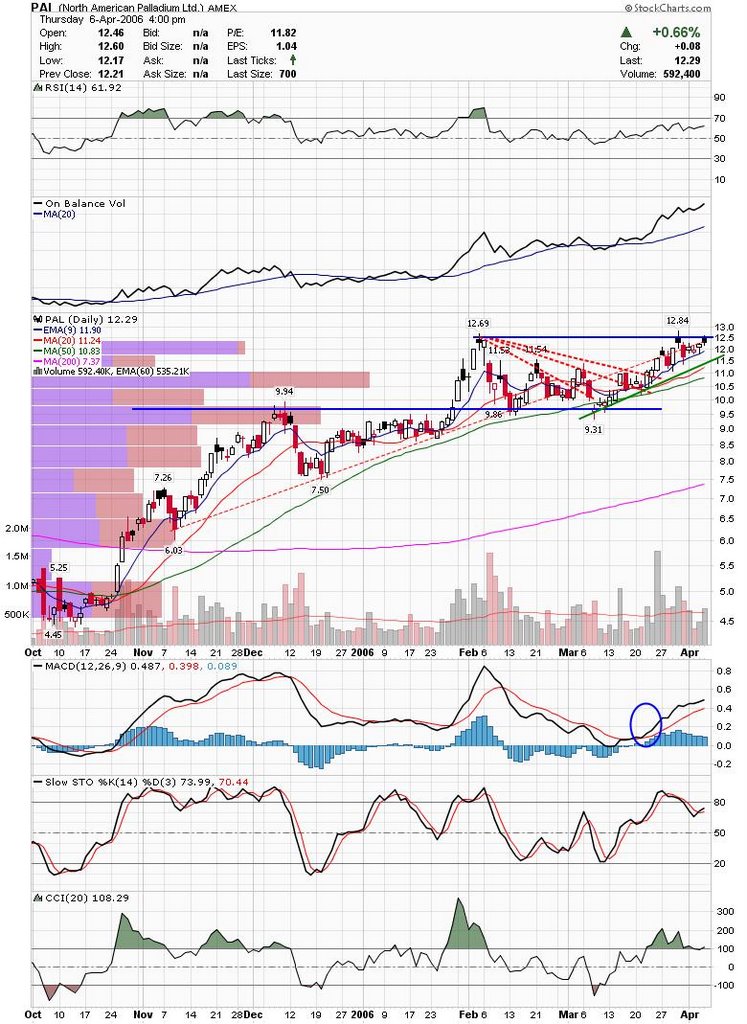 JDSU had a strong close today and held support in the high 3's.
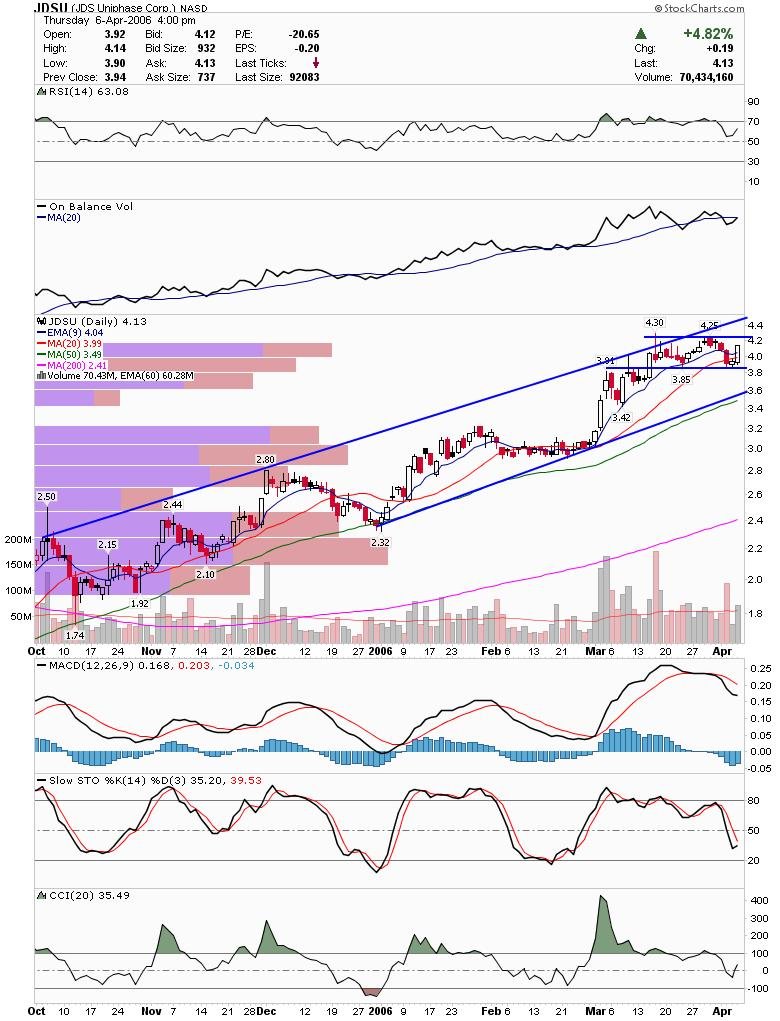 If CMED can push back over 30 then I think the bottom will be put in here with a triple bottom.
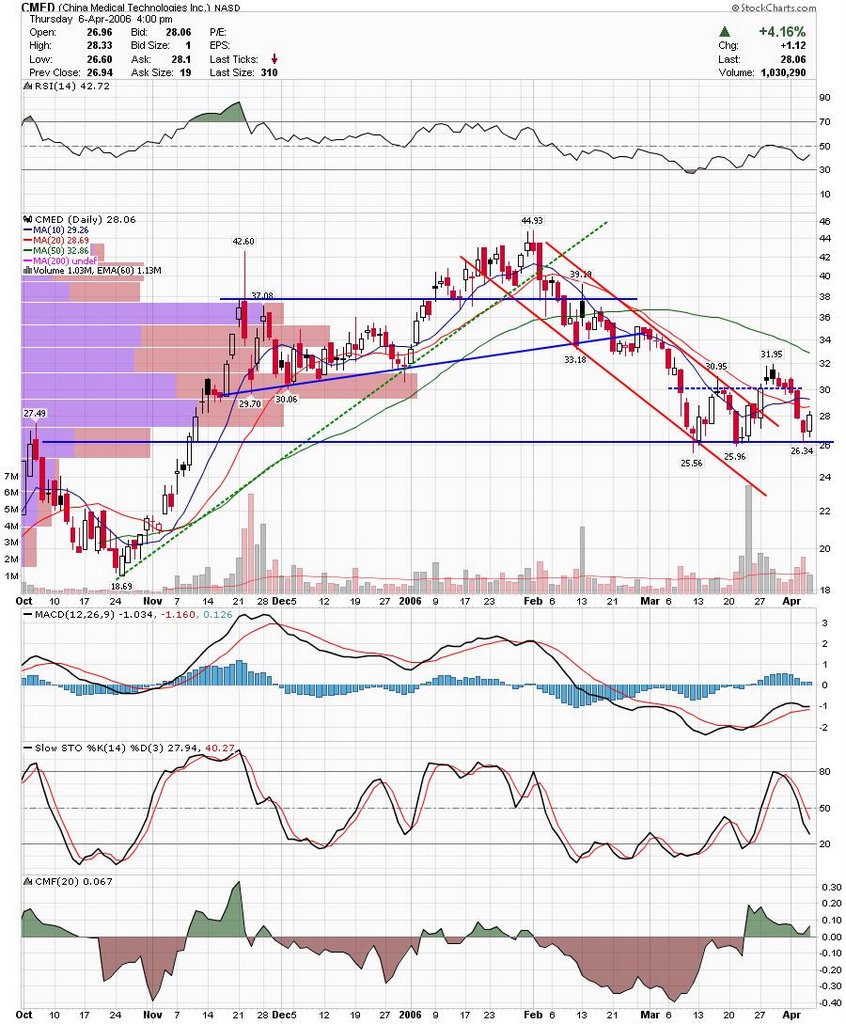 BOOM kept chuggin along the trendline and finally cleared it while making an all time high.
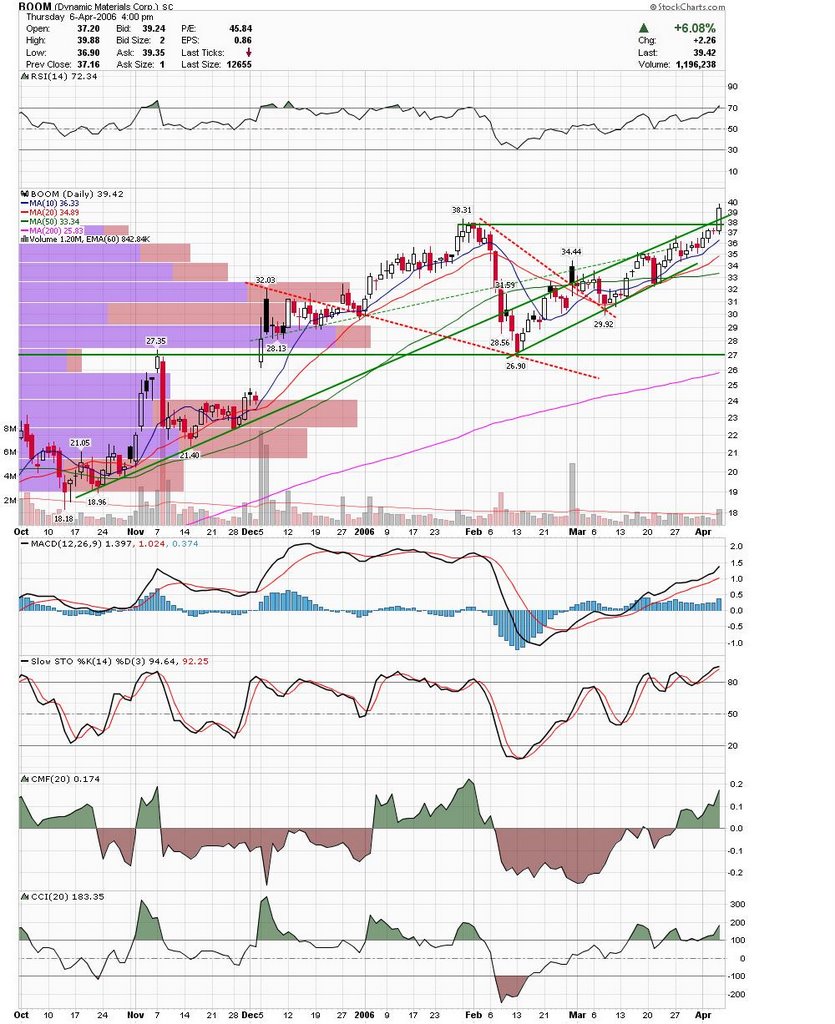 SBUX was looking like it may provide an entry here, but was trading near the 52 week high AH. Keep it on watch tomorrow.
That's it for tonight,
DT
We had some good moves in some of my blog picks from last night including SLW,LEN,FTEK,AUY and LVS. There were a lot of good chart setups today and it seems like there will be follow through tomorrow. Keep on your toes though as when things look nice and sunny is usually when it starts to rain (or snow in Massachuset).
CWTR was profiled on IBD tonight and have been consolidating earnings rally.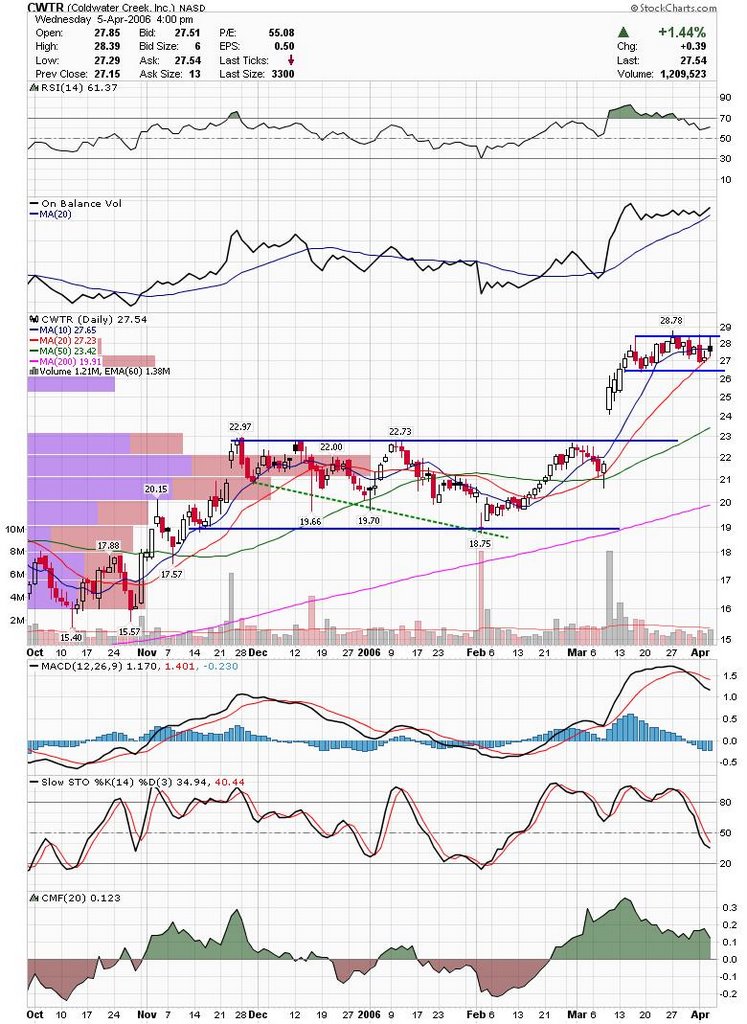 FORM held the gap and are testing resistance here.
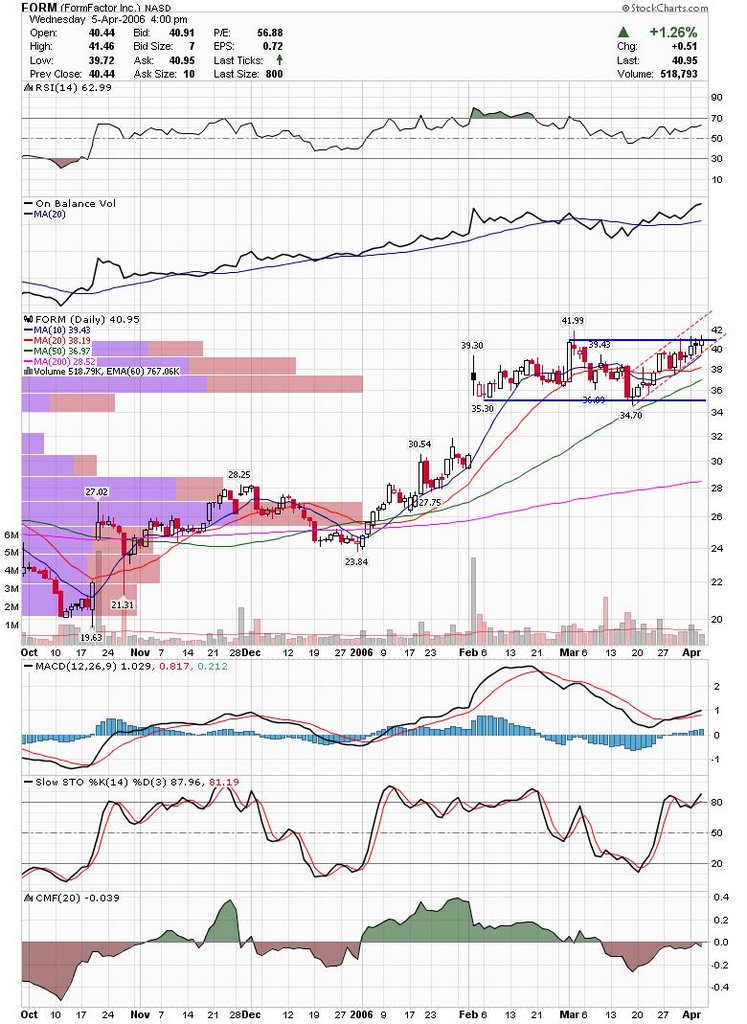 GDI came back to test the breakout area and had a light volume candle on support.
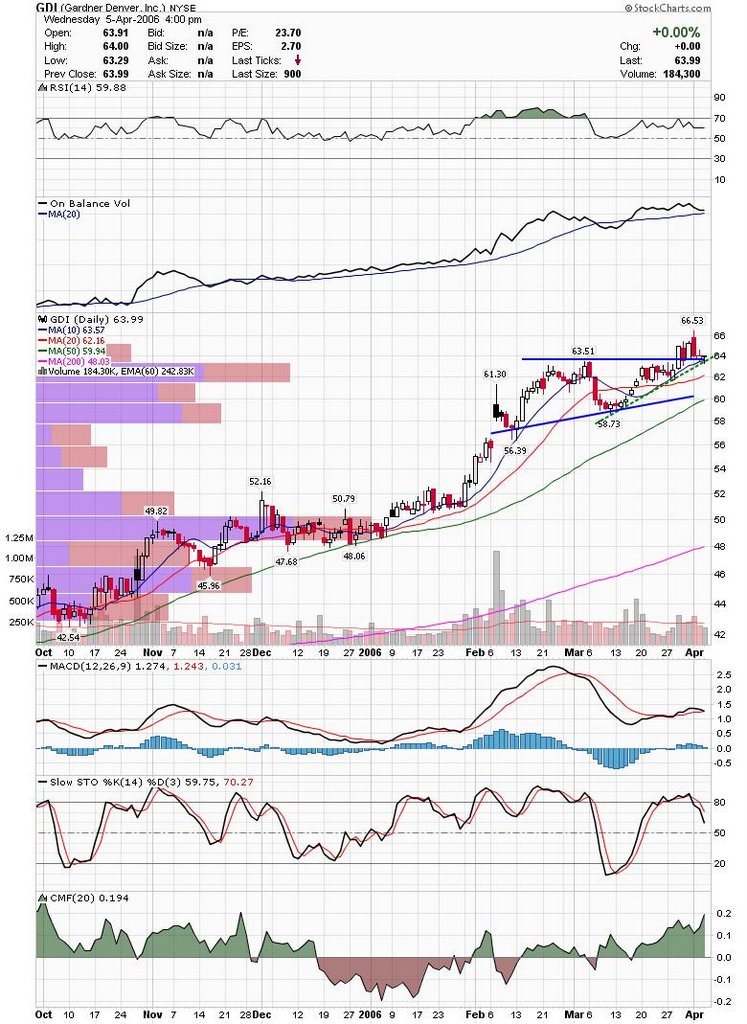 GYMB dipped down to 20 and got support. They are up to the breakout area again.
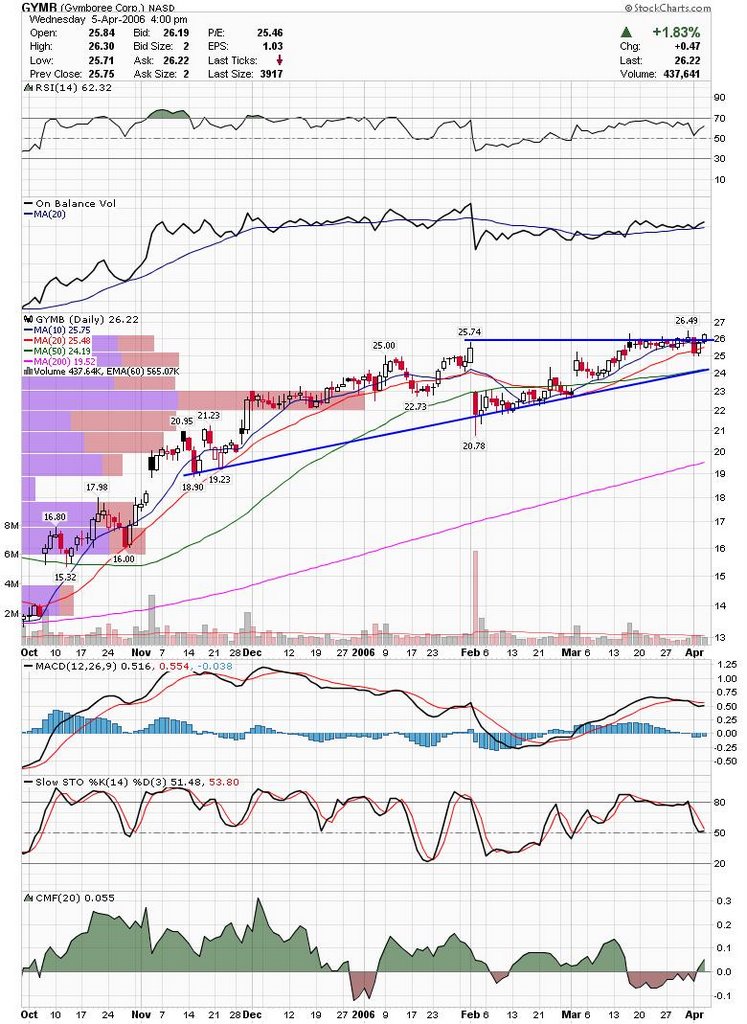 ITRI is consolidating in a nice ascending triangle and has held gap support.
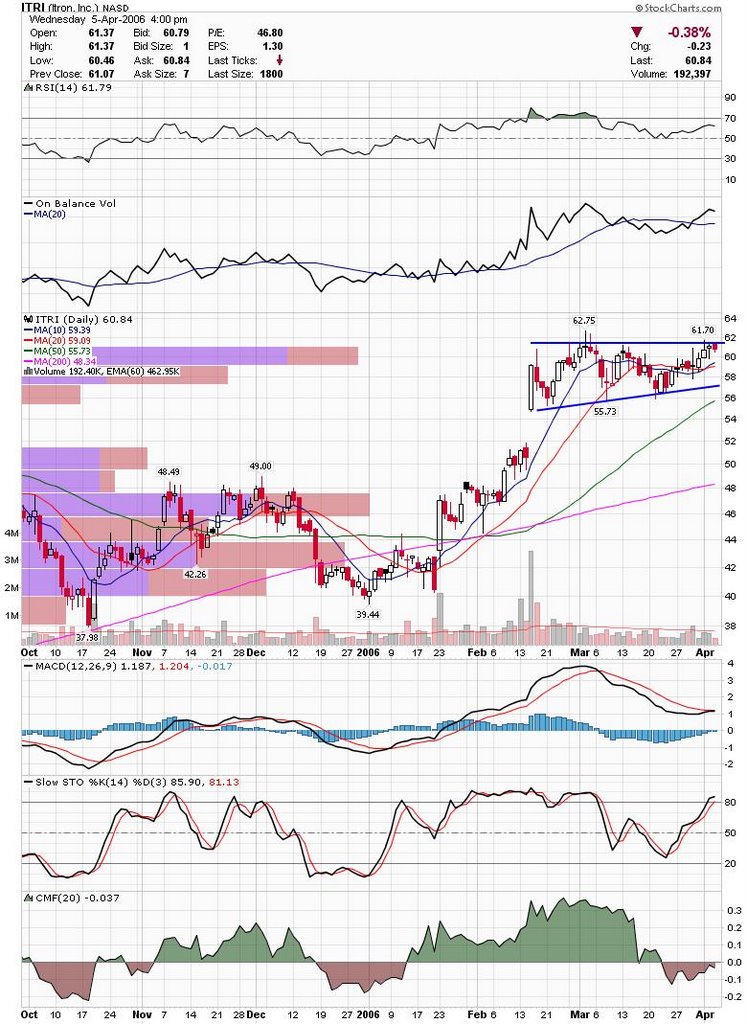 THO was also profiled on IBD and chart looks very good.
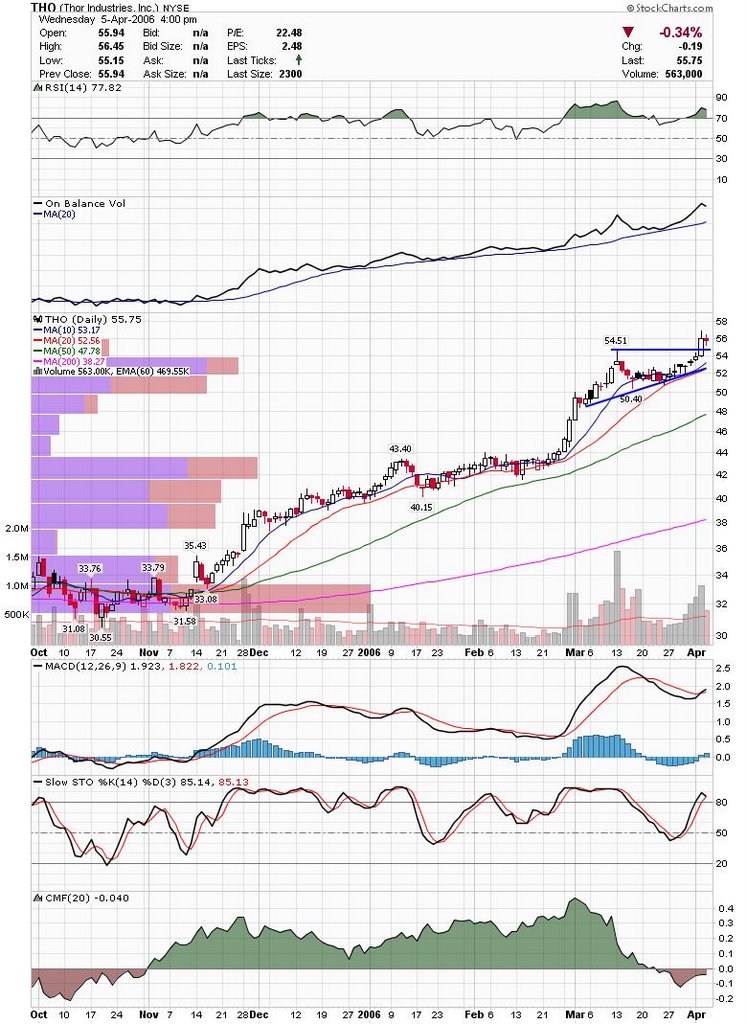
Be sure to read my look at the indices here from earlier tonight.
Good Luck,
DT
There has been a lot of talk lately about weak internals and whether we are in the processs of topping out and ending the current bull market. I won't bother trying to make a call but I think it's a good time to check out the weekly charts on the major indices.
Nasdaq broke out of a rising wedge and managed to hold above the previous resistance trendline. It just recently broke out of a small triangle consolidation. This all looks bullish to me, but there are divergences on most indicators. You can argue that the past two years were a consolidation and that the move is just beginning.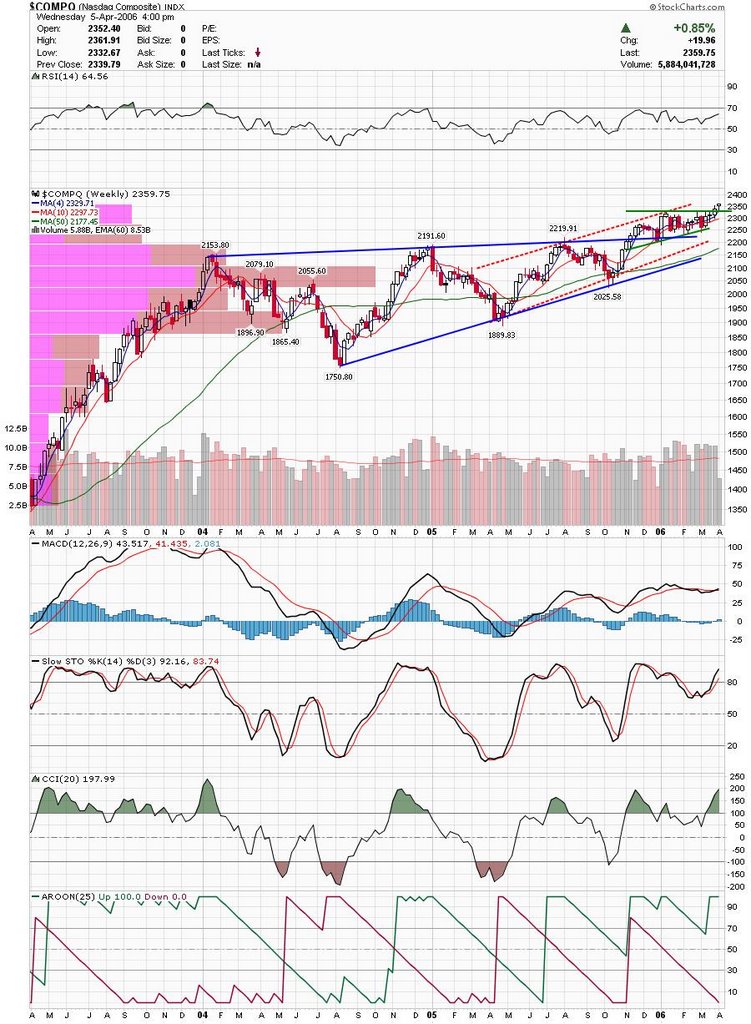 Dow has been gingerly moving sideways and has not broken out of the current channel. It actually reversed after touching the top last week and may be trying to get back up and test it again. I would say this chart looks more bearish to me unless the trendline is broken.
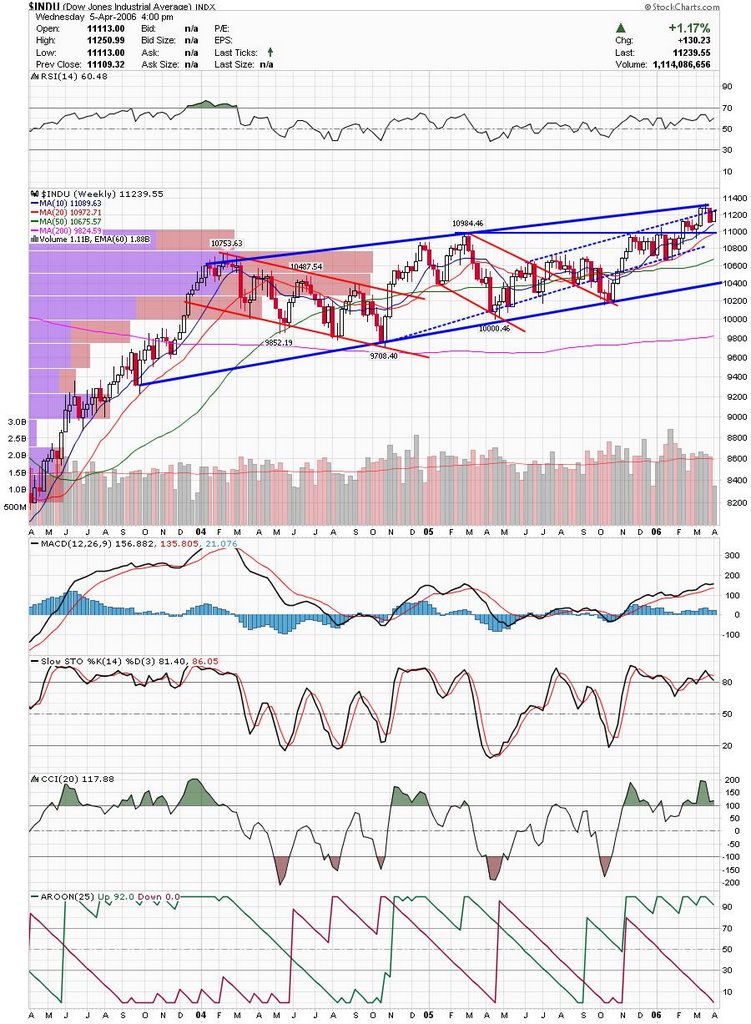 Russell has been a market leader with the Nasdaq. They broke a rising wedge and appear to be on an accelarating trendline. Looks bullish to me. Indicators don't look bad here either.
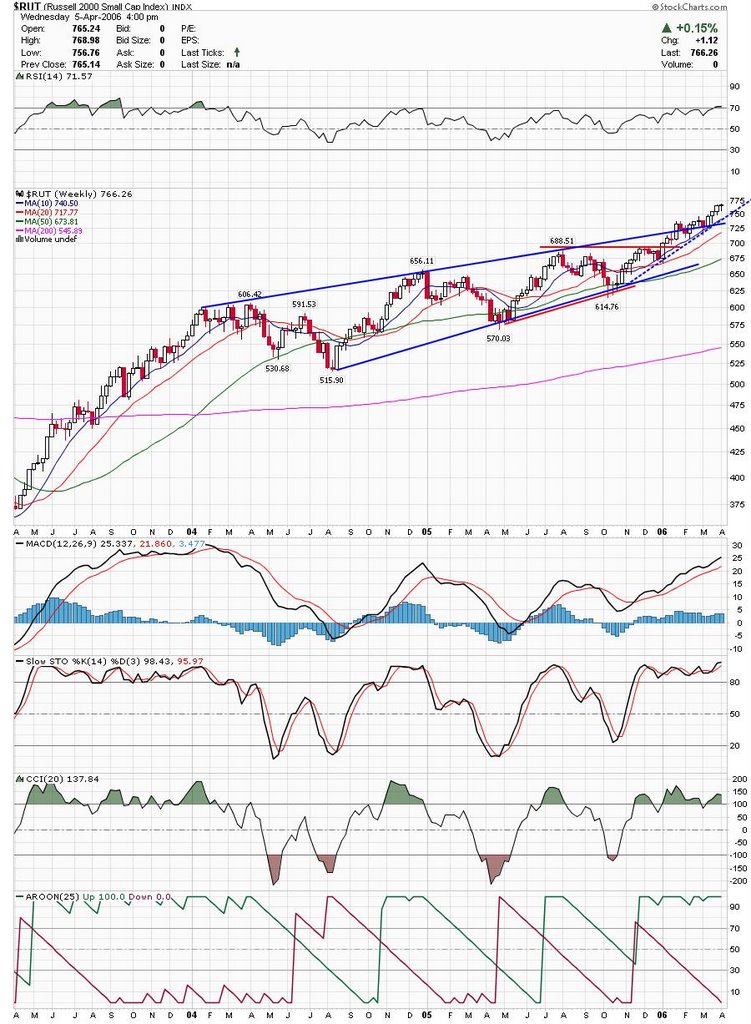 SP500 is sort of similar to Dow in that it is still in confines of channel. Unless it breaks the channel I see this as bearish, because a failure to break should lead to a trip to the lower end of the channel.
 SP600 looks more like a trend the a consolidation channel. There is still some room to the upside here and indicators look healthy.
The purpose of these charts is not to guess where we are going tomorrow, but to keep the overall perspective in mind. Hopefully these charts help you as they help me.
DT
I will post some stock charts later tonight.
Indices rose in a lackluster fashion today and didn't do much to the near term technical outlook. I have pretty much tightened my stops as much as I want to on my current positions and continue to mostly daytrade. For what it's worth, I've been more positive swing trading small caps and daytrading short lately. Here are a few charts I will be watching tomorrow.
GILD is breaking out of a nice base here. I added them to my squawk portfolio, but may put some real cash to work here. LVS is one that is looking pretty good too. Didn't catch it today due to just average volume.
 THO chart is looking nice with a little triangle breakout.
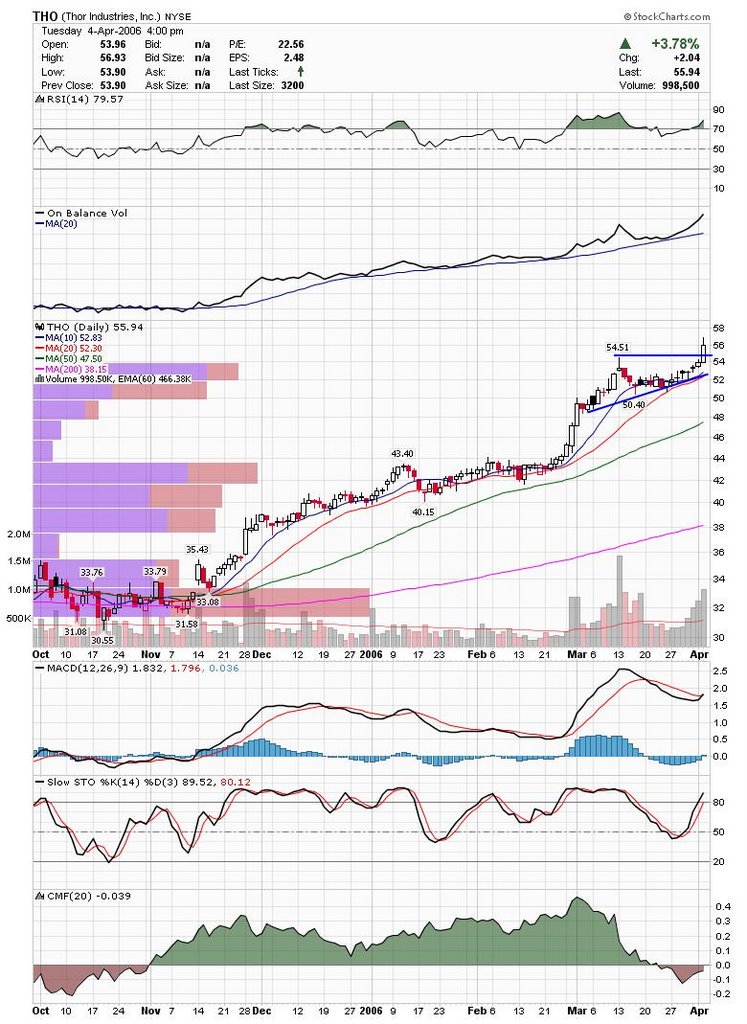 TMI also has a nice triangle base. This is a thinly traded stock, but the base is sound.
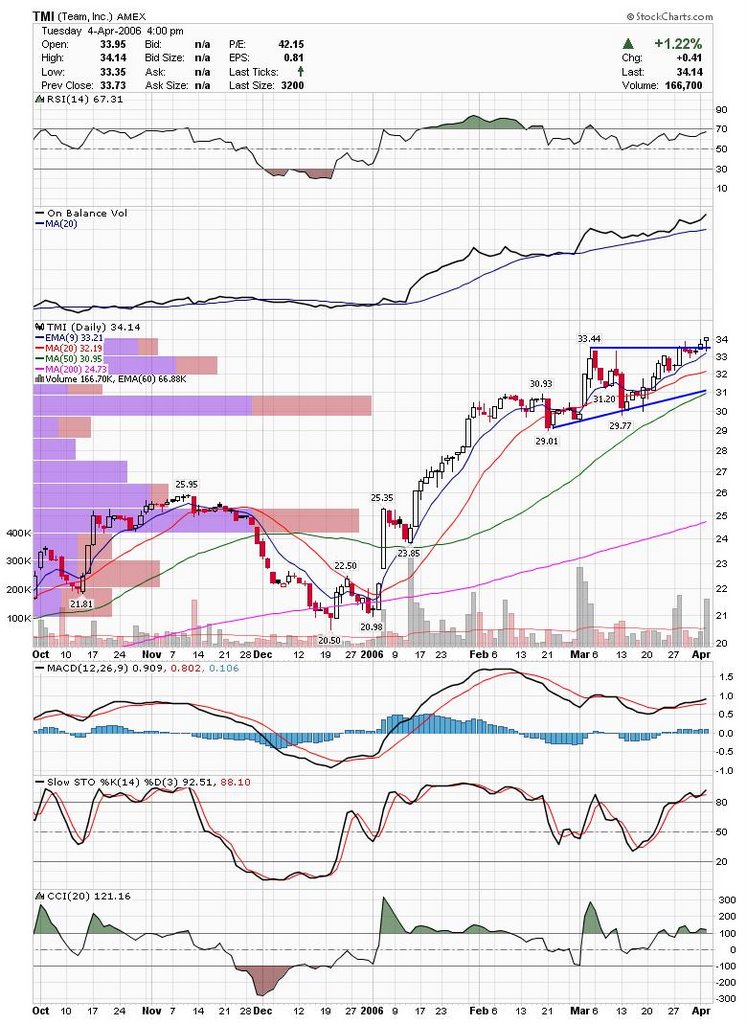 LEN never confirmed the reverse H&S but may yet come back to break that neckline. I am watching to see if it holds the trendline here.
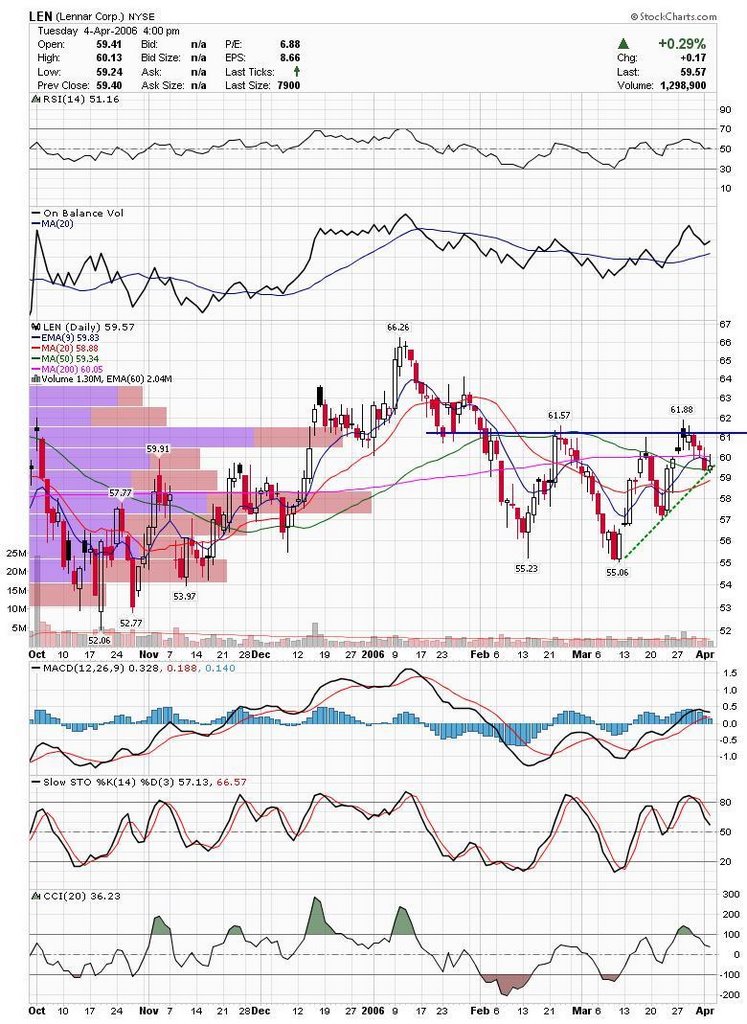 SLW formed a hammer type candle at two trendline support areas. I don't like the MACD crossover here but it may not really matter if silver keeps trading at multi year highs.
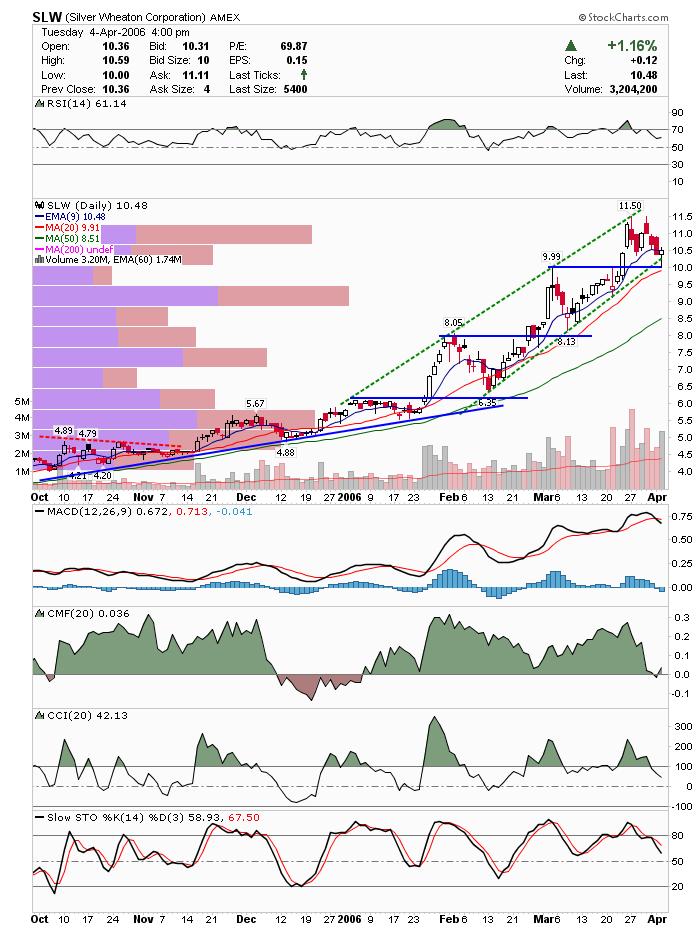 DES is a gold stock that made it on my radar. Nice break of resistance and notice it held the gap as support.
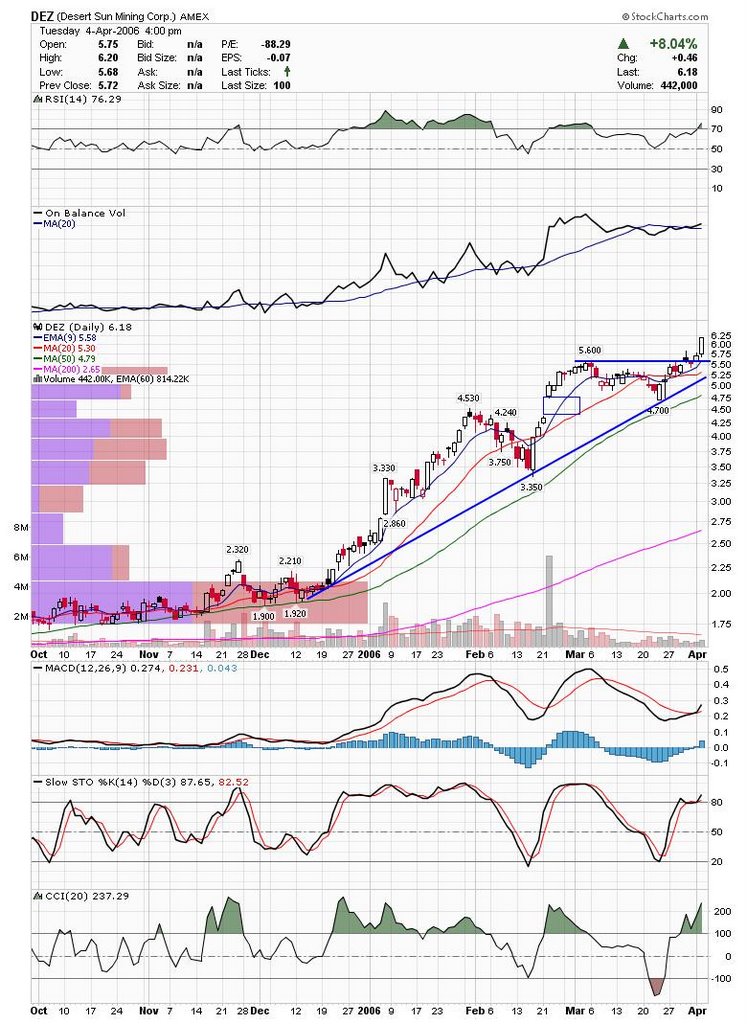 AUY is another good looking gold stock. I believe this is a motley fool hidden or tiny gem pick as well. A little late for an entry, but if it is anywhere near the breakout area I will probably take a shot.
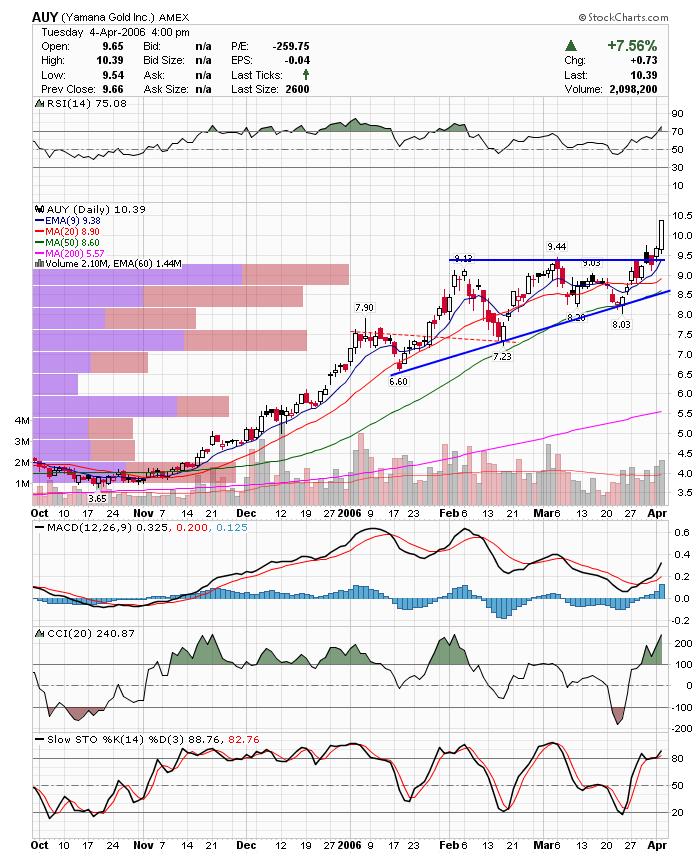 FTEK is coming back to test the previous channel and may get a bounce here.
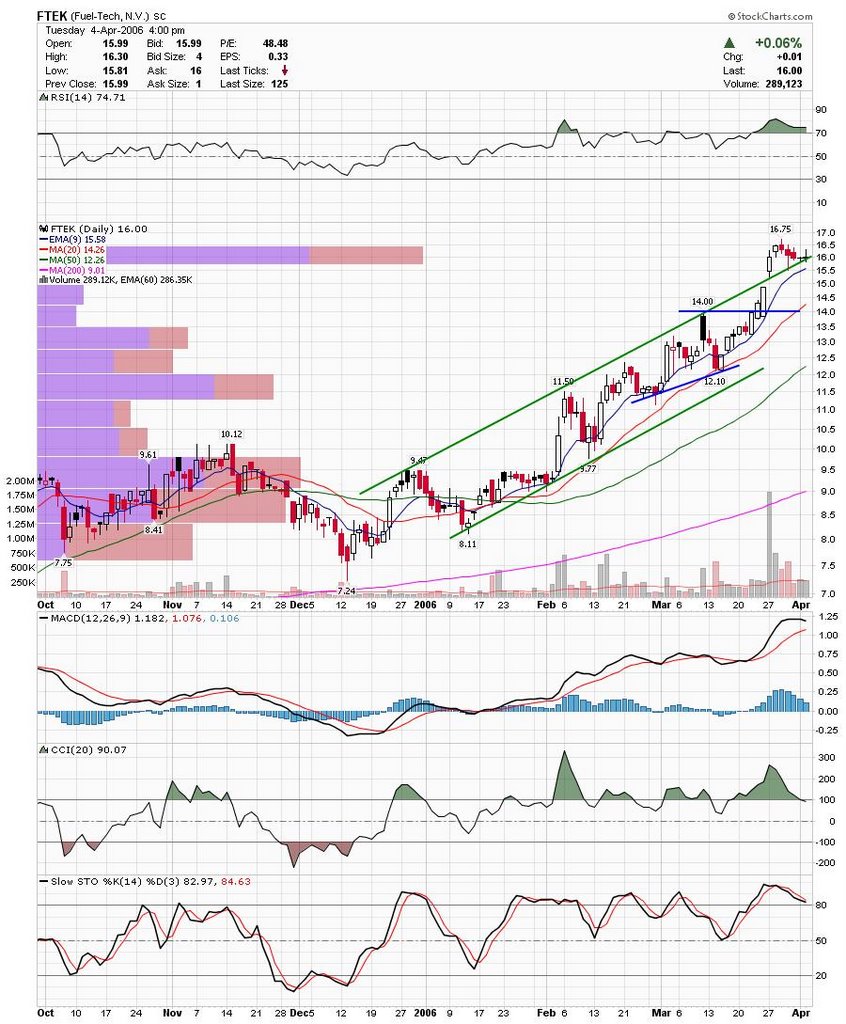
Thats it for tonight.
Good Luck,
DT
I made my first picks for the Squawk contest this afternoon. I also added a link to that blog on the upper right hand side of this blog that will stay there through the end of the contest. I think this is an interesting experiment to test out how the different Trade-Ideas scans can be used. I have been using a custom short scan the past few days and it has been working very well. QSII, CHS and IDIX were some of the trades I took. I will have my regular post later tonight.
DT
It was another reversal day today and once again. Short of time again with MLB full slate, 24 and tax preparation taking as much time as possible from me. I won't be initiating any new swing trades tomorrow, so I am posting a few charts of some current holdings that I feel are close to moving.
ALDA may pull back a little here, but there is a chance that they break out of this consolidation base.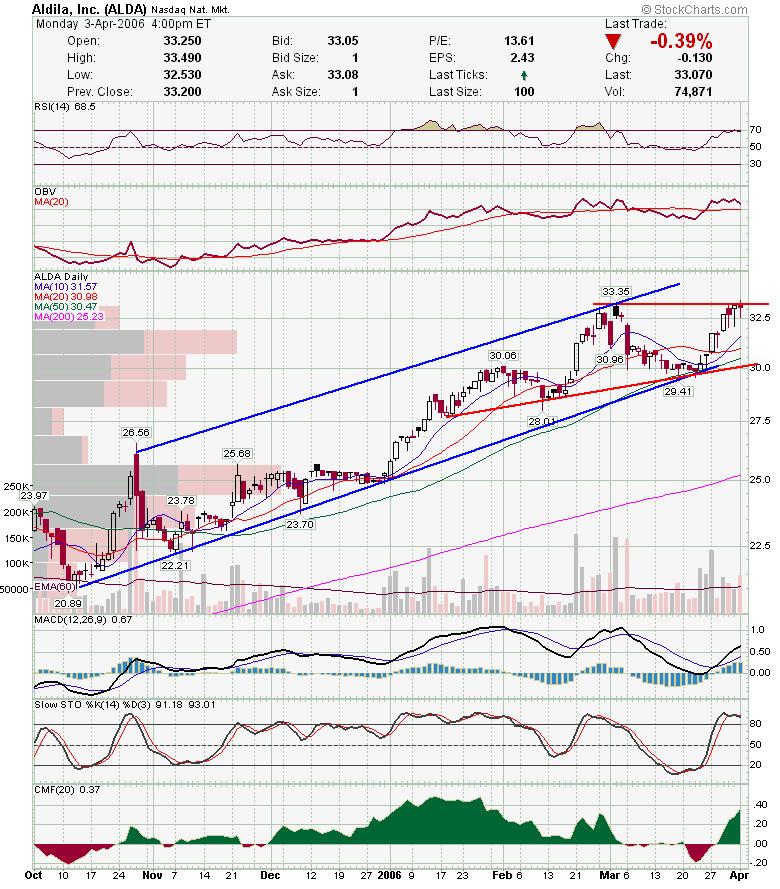 SLW is having a hard go of it here, but buying at this trendline has been rewarded recently.
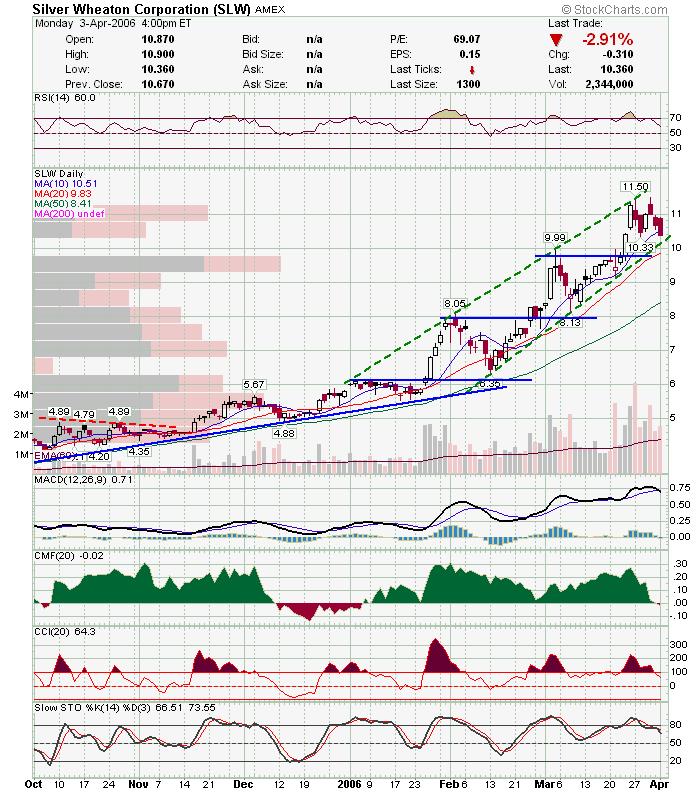 As I have been expecting, JOYG broke out today. The sector is looking good so follow through looks likely.
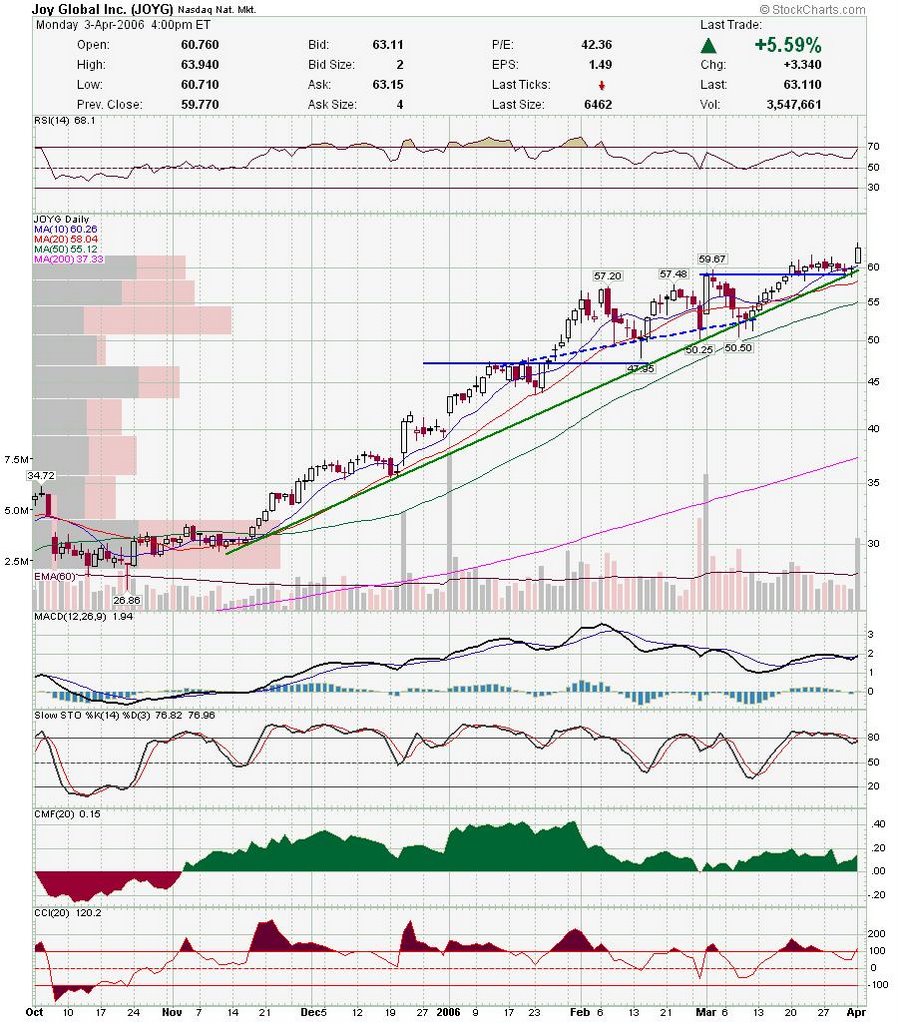 MNST looks like they are close to breaking out of this triangle.
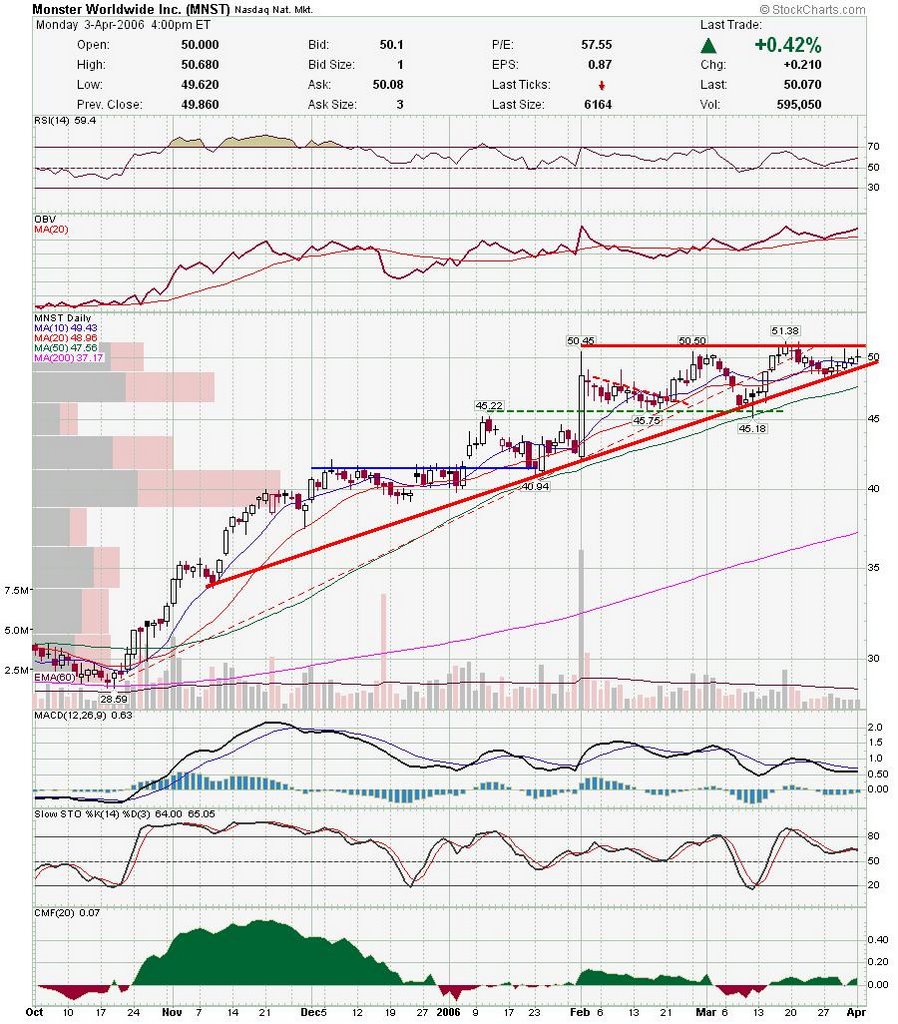 I hope some of you were able to get a piece of IIP after I posted the update this morning. They had a nice move today and look like they will clear 1.10 tomorrow.
Also, I am gonna try something new starting tomorrow. I entered the Squawk Box stock contest and will be trading solely using alerts from my Trade-Ideas setup. The tricky part is that the contest doesn't reward daytraders or momentum traders as it uses the closing price from the day you bought the stock. I think my strategy will be to scan for breakouts at 3:30pm and take stocks closing strongly. Either way, you can see all of my picks here.
Good Luck,
DT
Since I had saved it as a draft, the IIP post is below the current posts. Click here for it.
Good Luck, and be sure to read my updated posts below.
DT
Here are the rest of the charts from last nights post.
STRL is an ethanol play with a decent looking chart.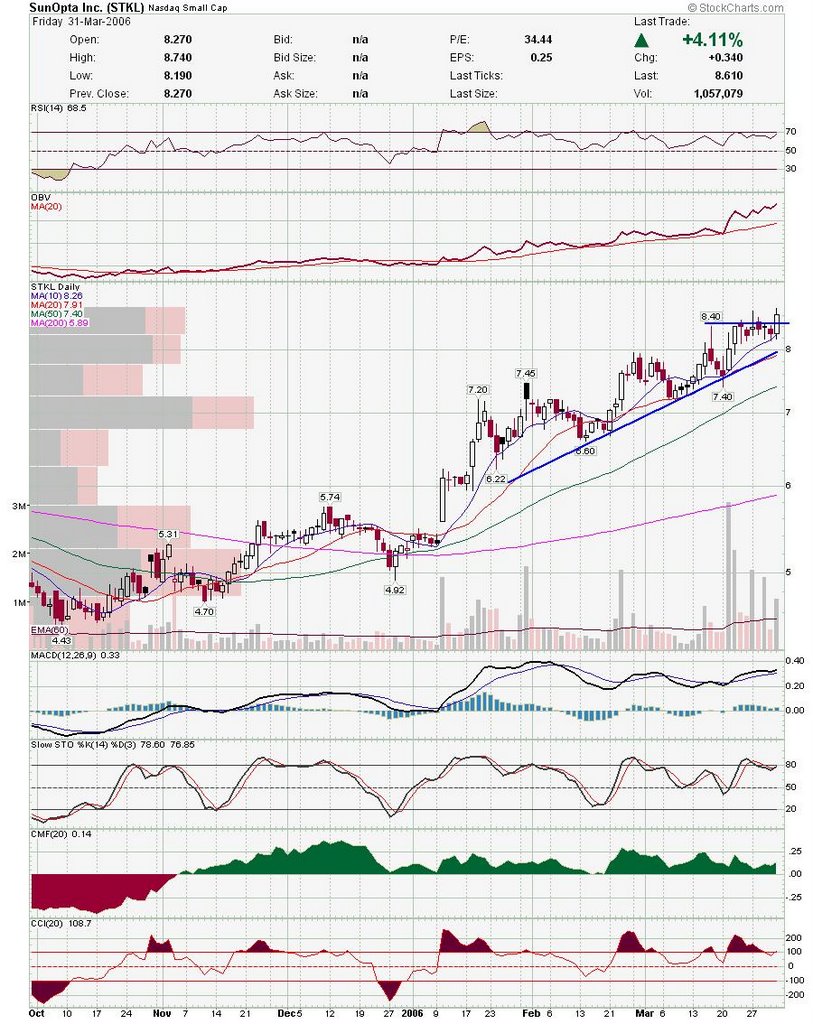 CPO is another ethanol type play which could have a nice move if it clears resistance.
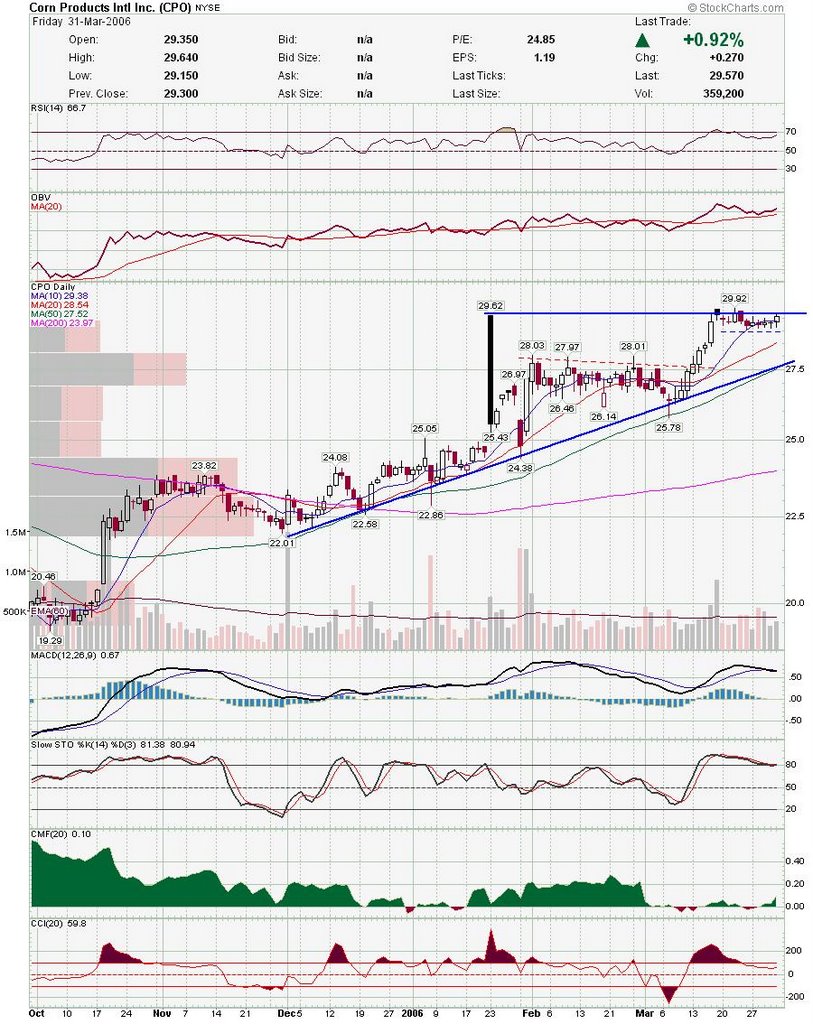 CCJ was looking like a short to me, but is starting to look better. Watch for a break to either side.
 CIB cleared resistance, but volume is pretty weak. I would watch to see if volume comes in here.
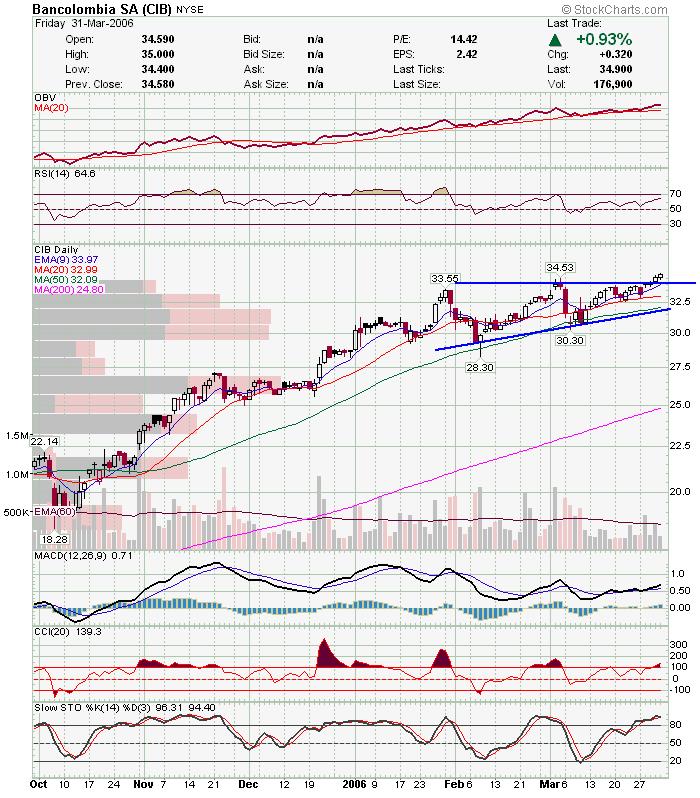 DRIV came back to test support and held pretty well. This may be the start of a big run.
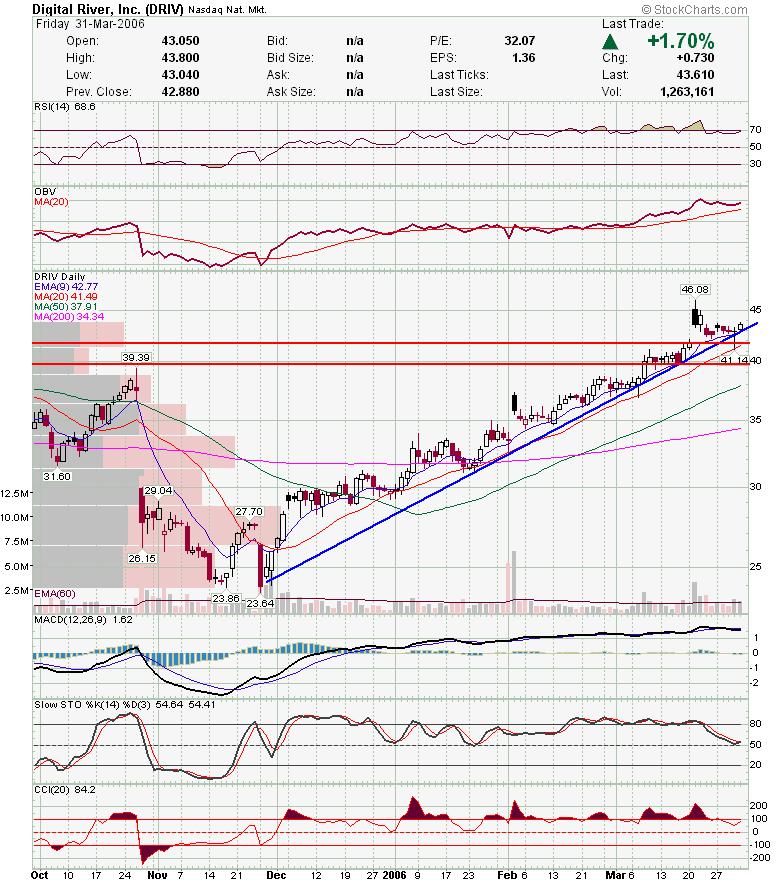 GDI had a nice triangle break and held support.
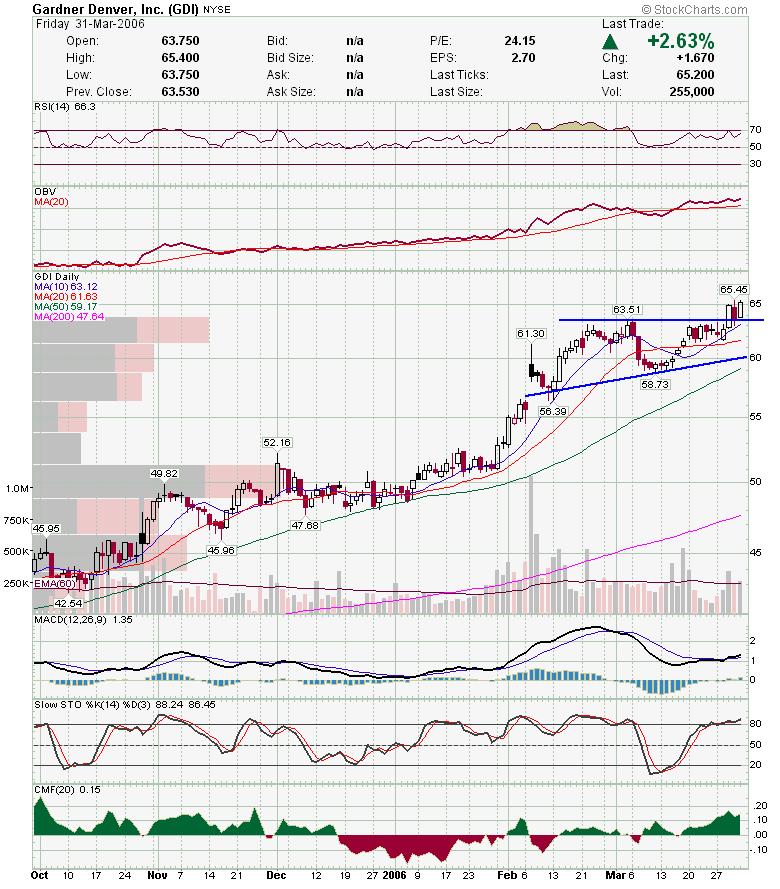 HITT cleared resistance and may breakout here.
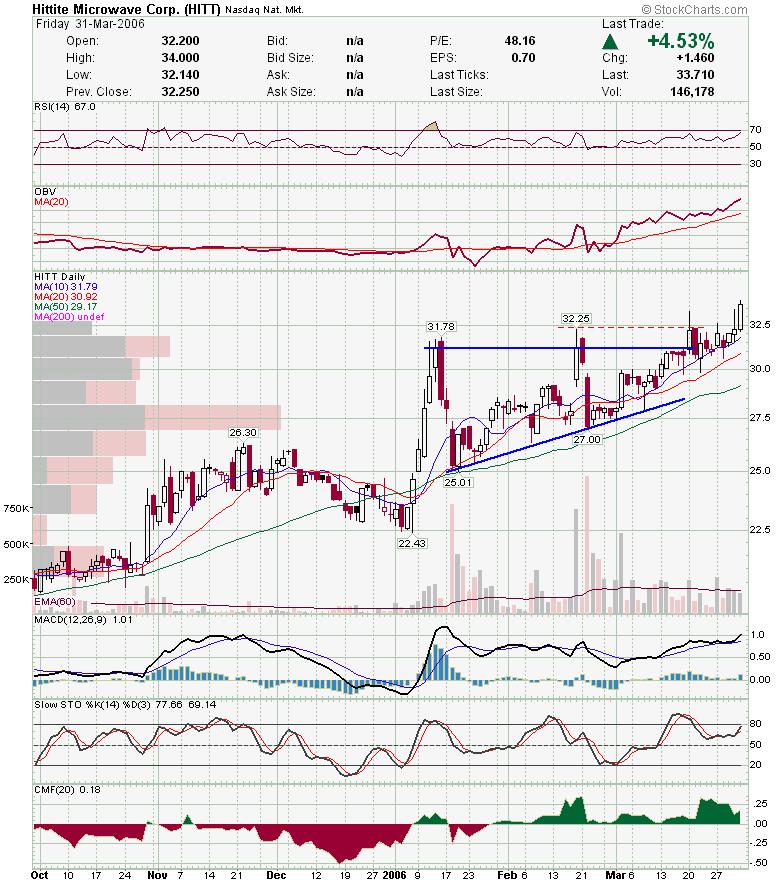 NWRE is testing resistance and has been strong lately.
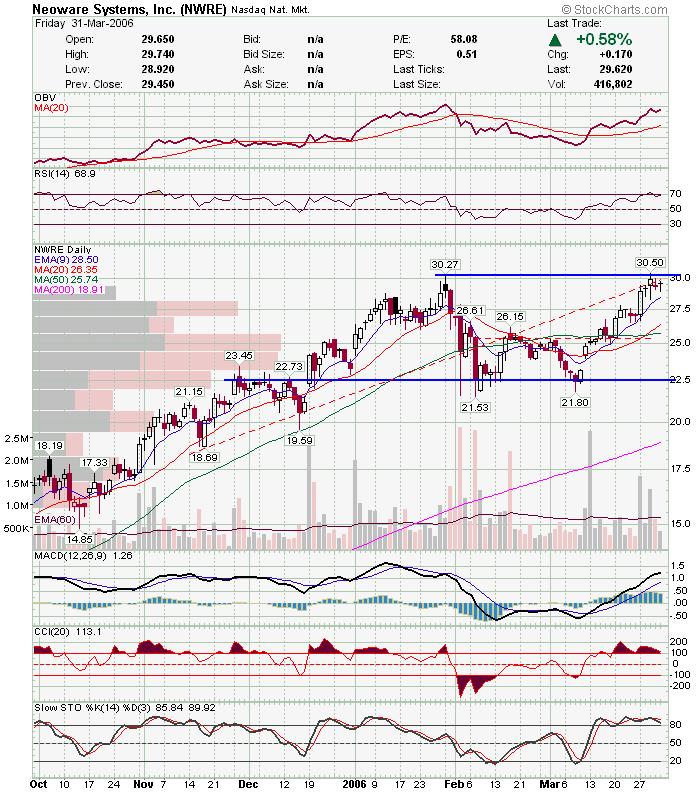 RS rejected the pullback friday. I will be watching to see if it can make a higher daily high.
 VTIV looks nice breaking out of a bull flag.
 If you missed last nights post, check it out here. I will post my IIP charts later this morning, but the short story is I think they are breaking out.
Good Luck,
DT
Sorry to get this post up so late, and it is incomplete at that. It seems that the Dow and Nasdaq can't move in the same direction. The DJIA is starting to break down as the Nasdaq firms up.
Here is a weekly chart of the DJIA. Notice the deteriorating participation in the rally. Here is the weekly for the nasdaq. Looks a lot better then it did a couple of weeks ago.
Here are some charts that I came up with tonight.
CLB has been a strong stock and may breakout here. FDG tried to bounce back but may be failing at 200sma here.
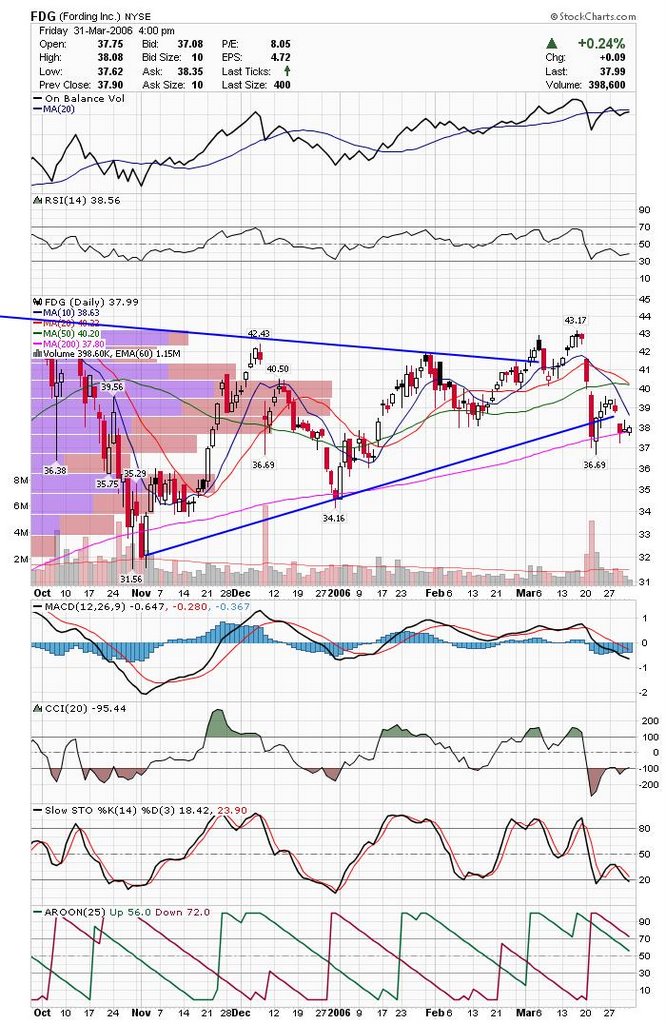 GIL fell out of the IBD100 and looks like it may be failing at the 50.
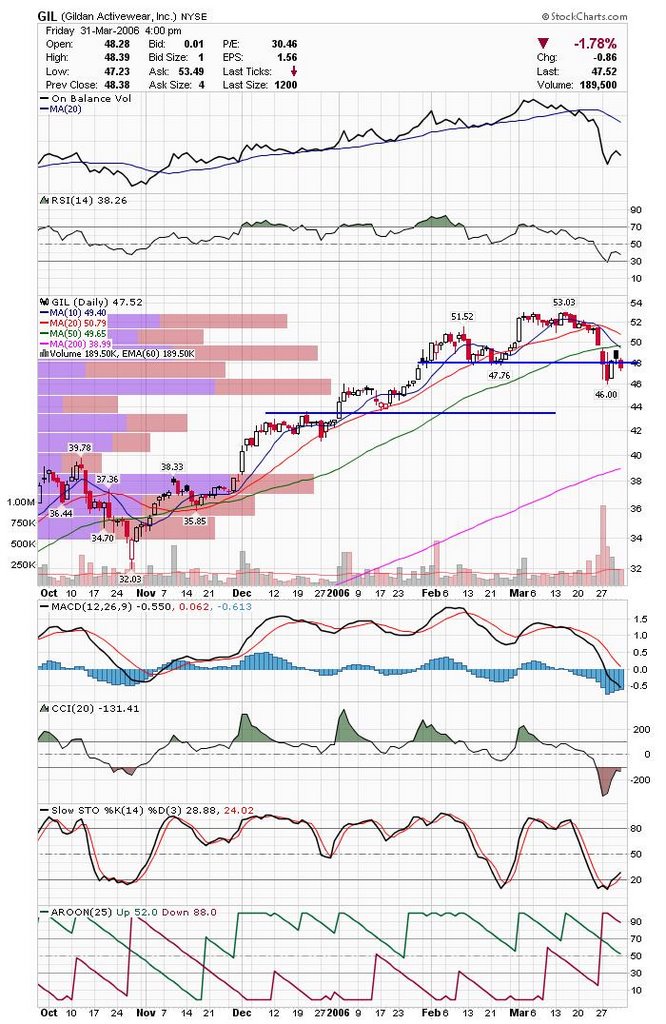 GRP has met up with stiff resistance. Looks like it will head down a little from here.
 IHS is an interesting chart. If it doesn't try and fill gap it will be extremely bullish.
 PAAS has come back down to test breakout area.
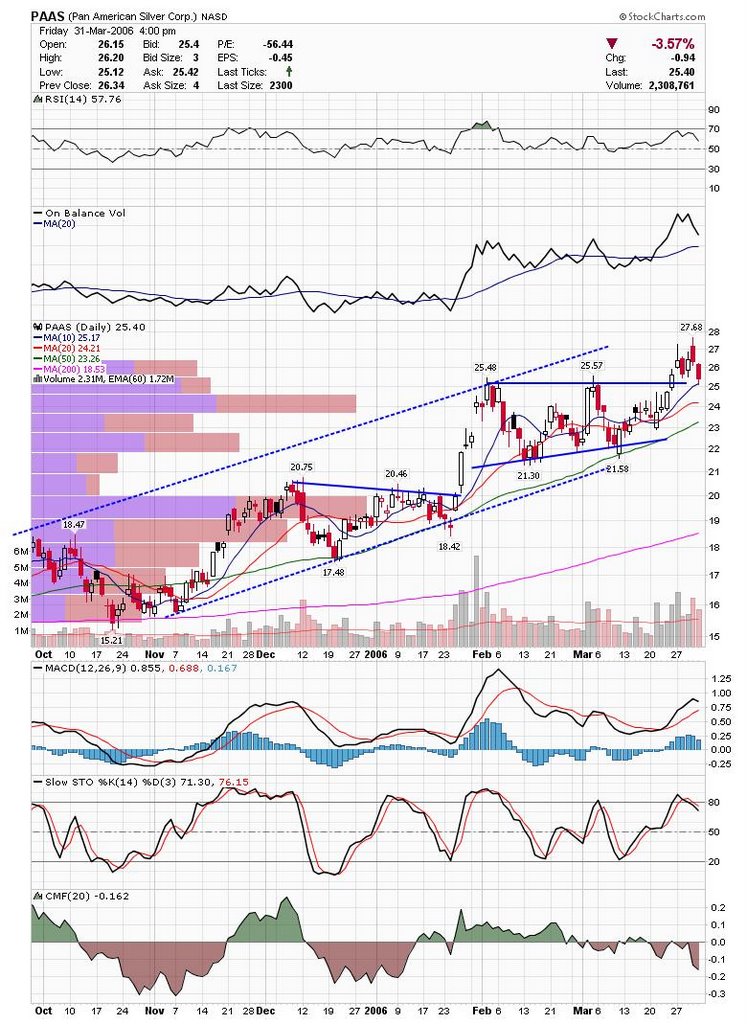 Most Gold stocks are looking good and TRE is close to a breakout.
 CMED made the IBD 100 again and looks to be testing the double bottom pivot point. If it holds, it should go up to test 50sma.
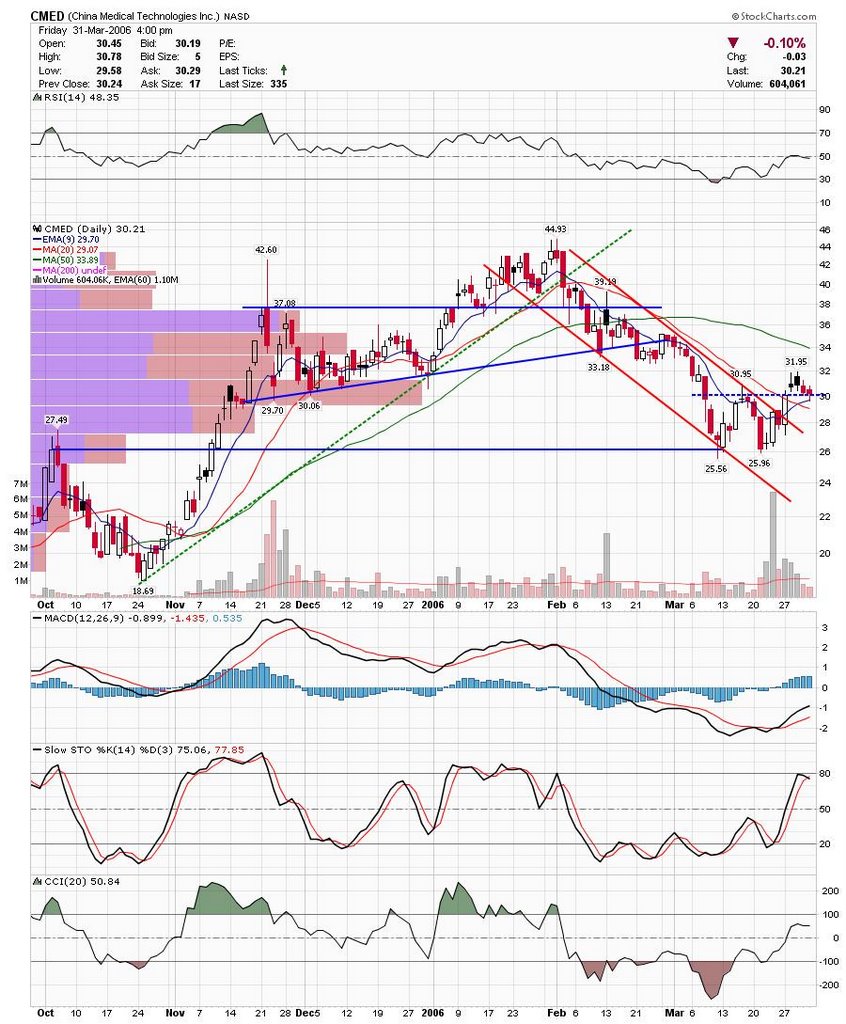 AMD has fallen pretty hard and is testing support. I would think institutions would support it here, but if it falls below the line.......
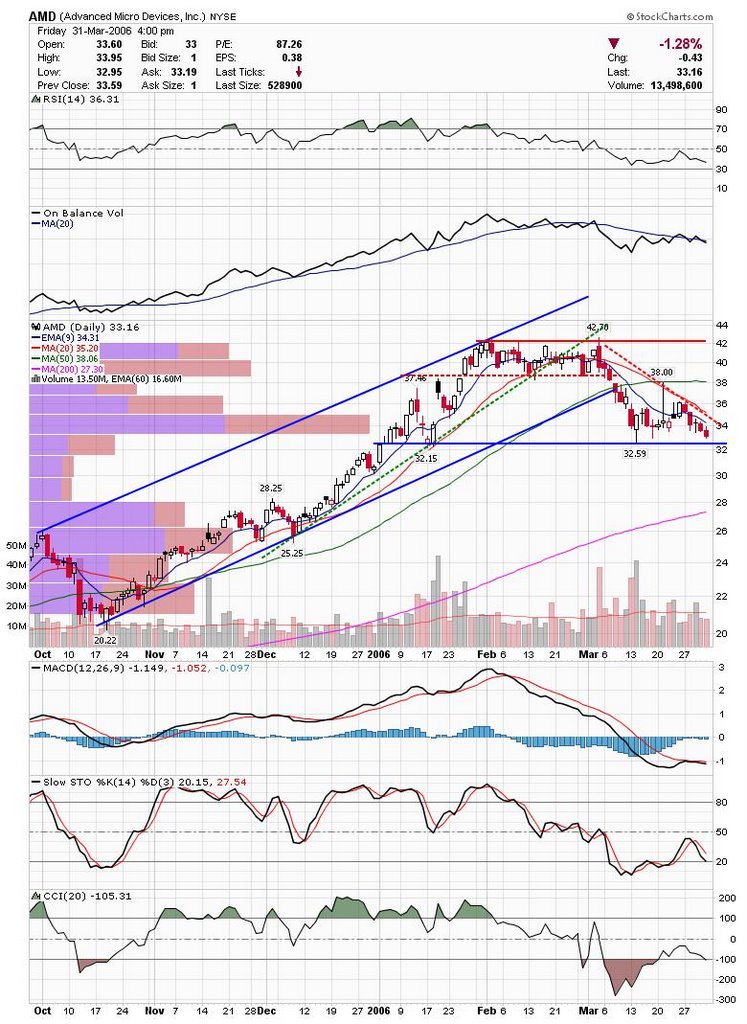 GRMN has been moving nicely and looks like it may get a bounce here.
 IIJI looks to be failing at the 200 sma and 50 may give it the death crossover.
 Sorry to make my post so brief tonight, but it has been a long day and it's late here on the East Coast. I have a bunch of chart I will try and post tomorrow morning before the market opens including IBD100 stocks and penny stock special IIP.
Also, A reader posted the following:
"Could you comment on SMSI and its 2 yr chart, it looks like a healthy breakout and key buy pt. Thanks!"
Scott K
Well, Scott, sorry I didn't have time to work up a chart, but I checked it out and SMSI looks good. I wouldn't be buyer here because it is a little extended, but I would expect it to hold 11.60ish from previous top if it pulls back.
Good Luck,
DT


