The Nasdaq has been out of synch with the other major markets and that can't last forever. There are a couple things to watch here.
Here is the Nasdaq bouncing off a support line for the second time after breaking it as resistance. If the Nasdaq can get past resistance they will lead another rally. The Nasdaq has managed to trade sideways to the middle of it's trading channel.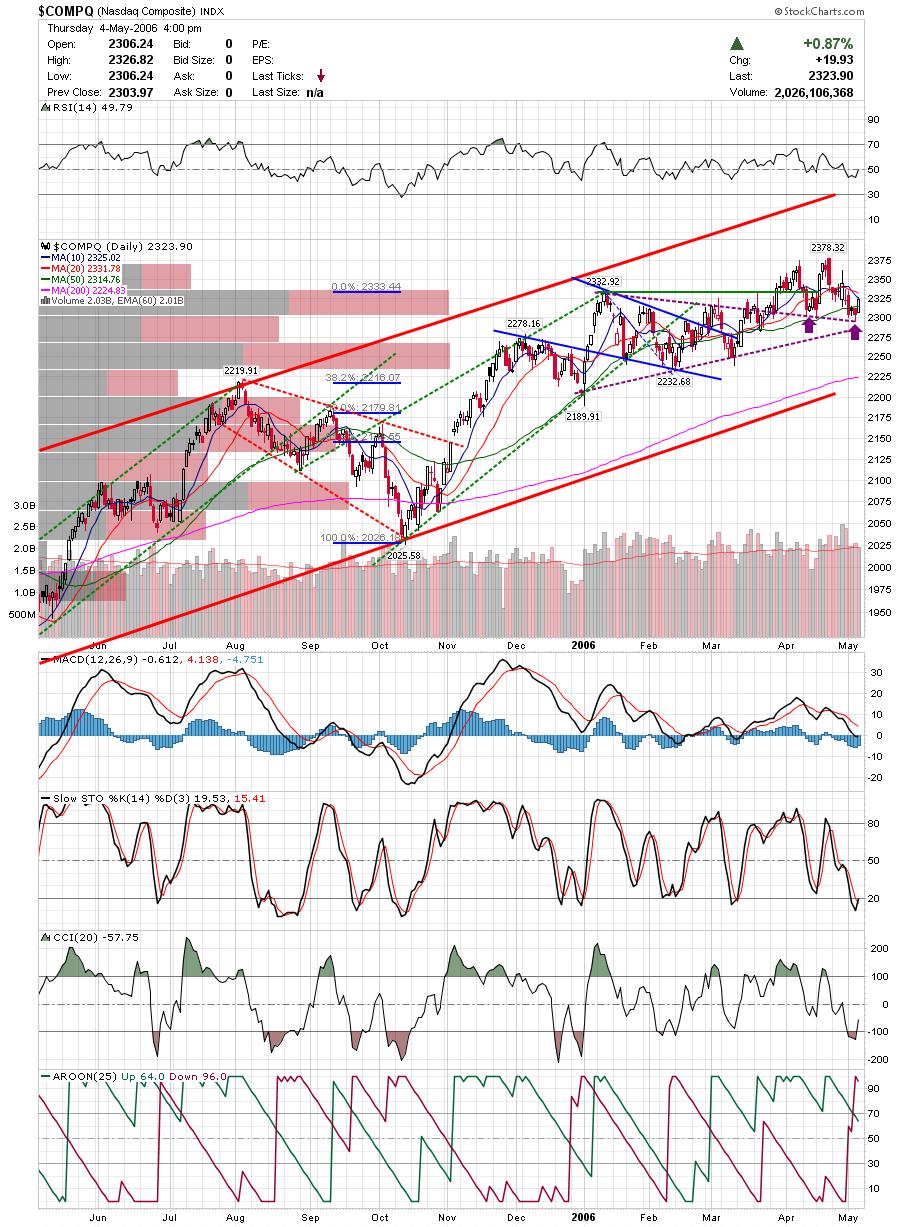 However, If there is gonna be another rally, then the SP500 needs to clear this triangle which is easier said then done. Look at all the wicks and reversals in this area. Keep in mind that the SP500 is at the top of a trading channel here and for it to breakout takes considerable momentum.
The key to this market is still the Nasdaq. The Dow is over the long term channel. Same goes for the Russell. The SP500 is at the top and only the Nasdaq has ample room before testing the top. I don't think the other markets can pull the Nasdaq up because they have divergences all over the place and deteriorating technicals. However the Nasdaq has been lagging and semiconductors have corrected to the point where there could be enough strength to lead the markets again. My view has been that a drop in overbought commodities could fuel a rotation to technology and the pullback in crude could be part of that. However, this is a tricky market and the rug could be pulled out from under any rally at this point. There is a chance that a bull trap is being set and that the Nasdaq will carve out a head and shoulders top. It really is too early to pick a side so the best strategy is to trade carefully and keep some dry powder until a more clear picture develops. Good Luck,
DT
I was out all day and won't be trading tomorrow so I can't really review where we stand. However, I went through the IBD100 tonight and I am highlighting a few interesting charts.
We'll start off with a couple shorts.
BER broke down and has formed a little bear pennant up to resistance. CIB fell out of an ascending triangle. Could drop to previous pivot low or worse.
 FMD has an interesting chart as it broke out of a base but has been having a hard time with previous gap resistance. If it can close the gap, it might make a move to the 70's.
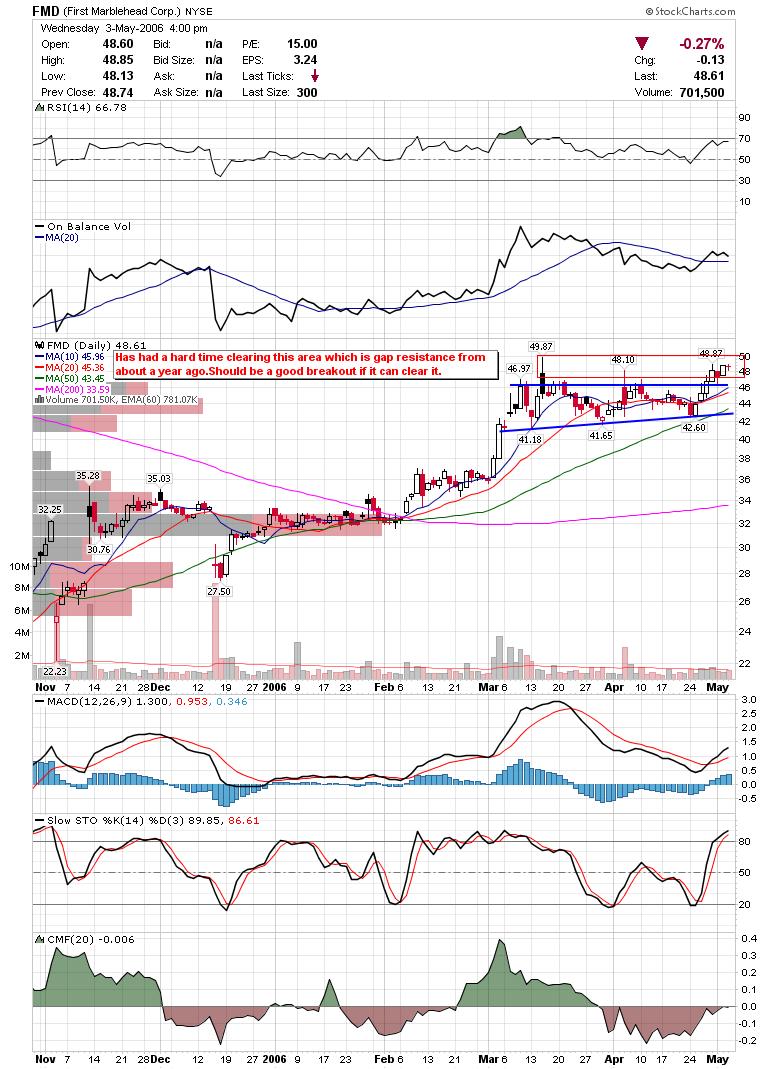 I highlighted MFLX as a chart to watch to see how it handled the trendline and it looks like it is bouncing off of it.
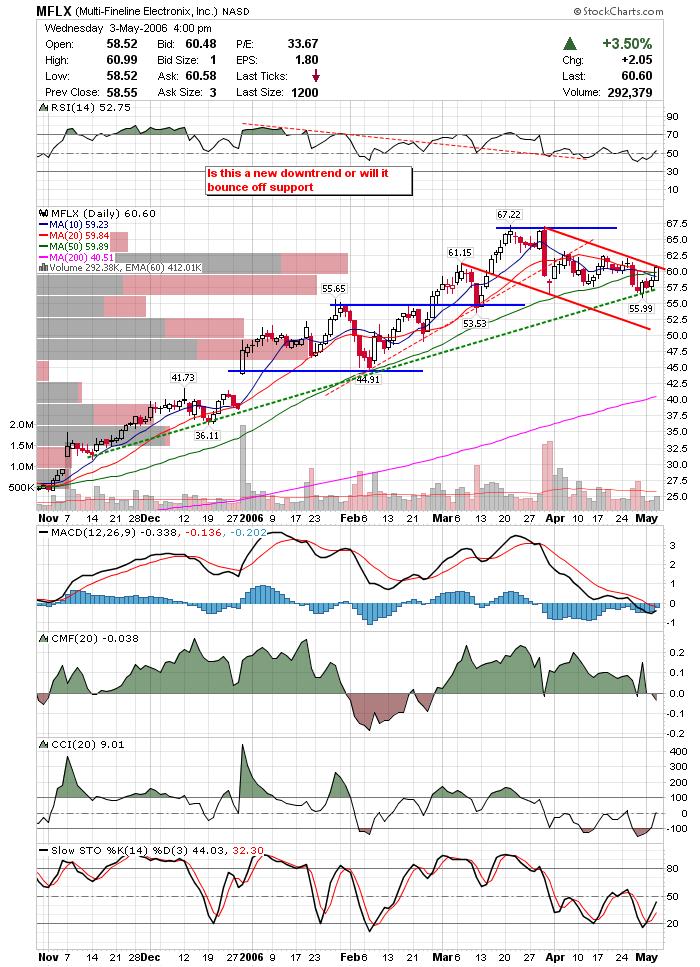 NEU is looking very strong here.
I ran out of time but a couple other charts to keep in mind are INFA and ITRI.
Good Luck,
DT
So we are mostly back to where we were yesterday before the Bernake misunderstanding drop. While we have deteriorating technicals we must respect that the indices are mostly at or near significant highs. The one thing that keeps puzzling me is how the Nasdaq is staying out of synch with the SP500 and DJIA. The Nasdaq was pathetic today while SP500 had a decent day.
Here is a chart of the SP500 showing a possible triangle (shown in red). A break higher would surely squeeze some early bears.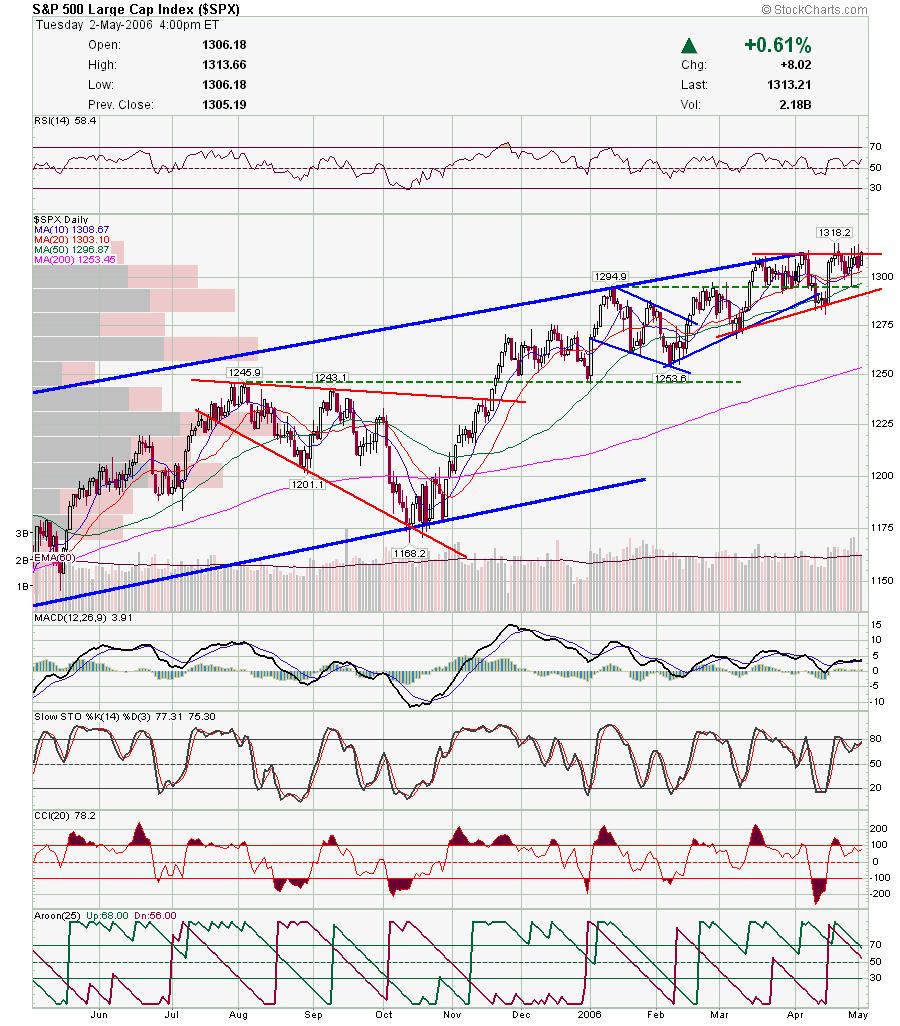 Here is a chart of SINA which I picked up for the Squawk portfolio today on a trade ideas alert. This stock can really move and I wouldn't be surprised wit a run over 30 in the next couple days.
 TDW is another Squawk pick off a trade ideas alert. Looks like a cup and handle breakout although it is not rounded.
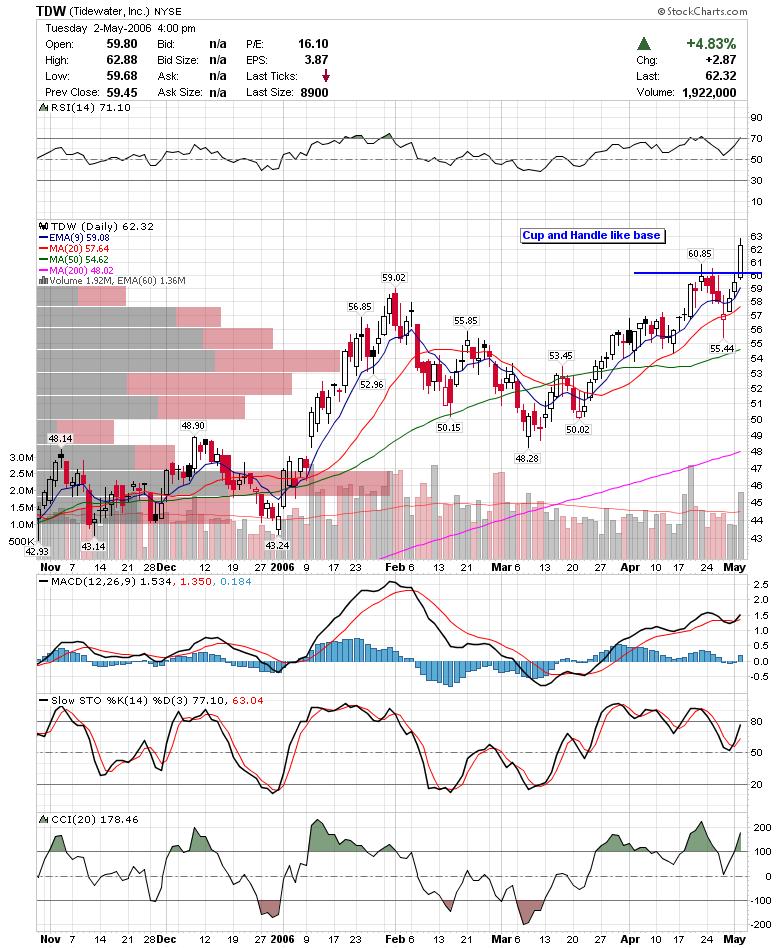 PDE looks like a deep cup and handle breakout and was another addition to the squawk portfolio.
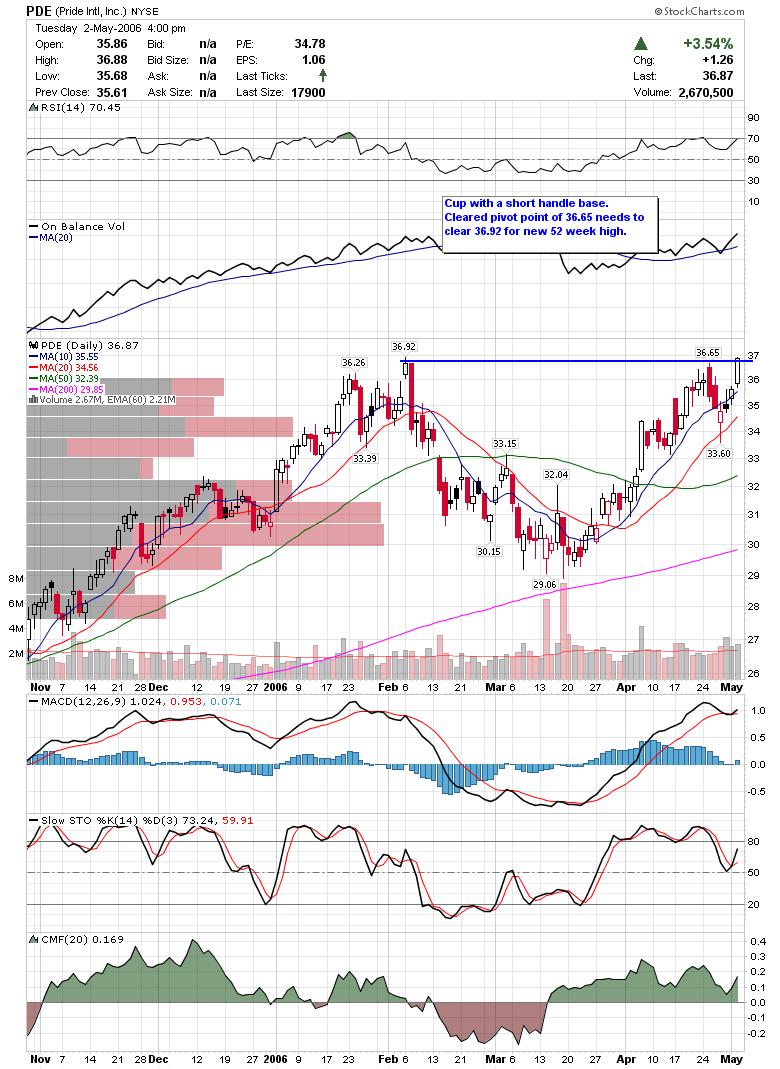 NBL looks like it is clearing a huge ascending triangle much like the TGE chart I highlighted recently.
 After UBB's move today I decided to check out BBD. Looks like it might head up to test the 52 week high.
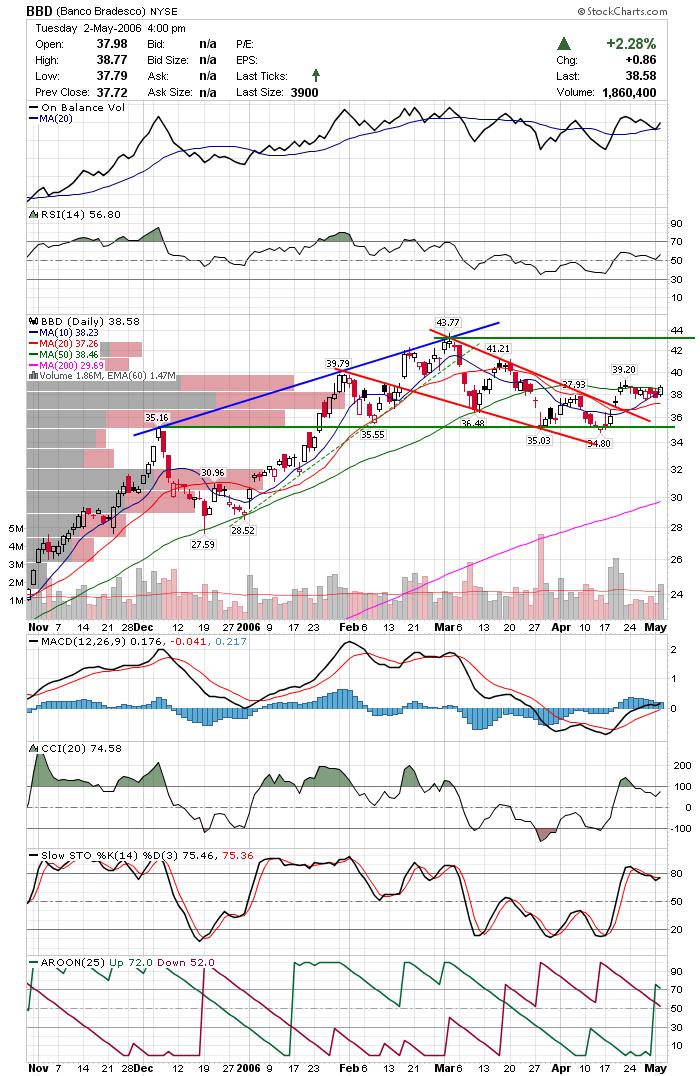
Good Luck,
DT
I had to look pretty hard, but I did find a few charts that still look decent on the long side. Todays late day reversal may be the nail in the coffin for this bull rally, but there is a chance we still get a bounce here, particularly on the nasdaq. If we are topping out as many believe, then I can envision the nasdaq forming a Head and Shoulders or Triple top. Here is an updated Nasdaq chart. You can see a possible double top or left shoulder and head. As the nasdaq pulls back to the trendline it could get a bounce. SCSS whethered mediocre earnings and is drifting to a trendline.
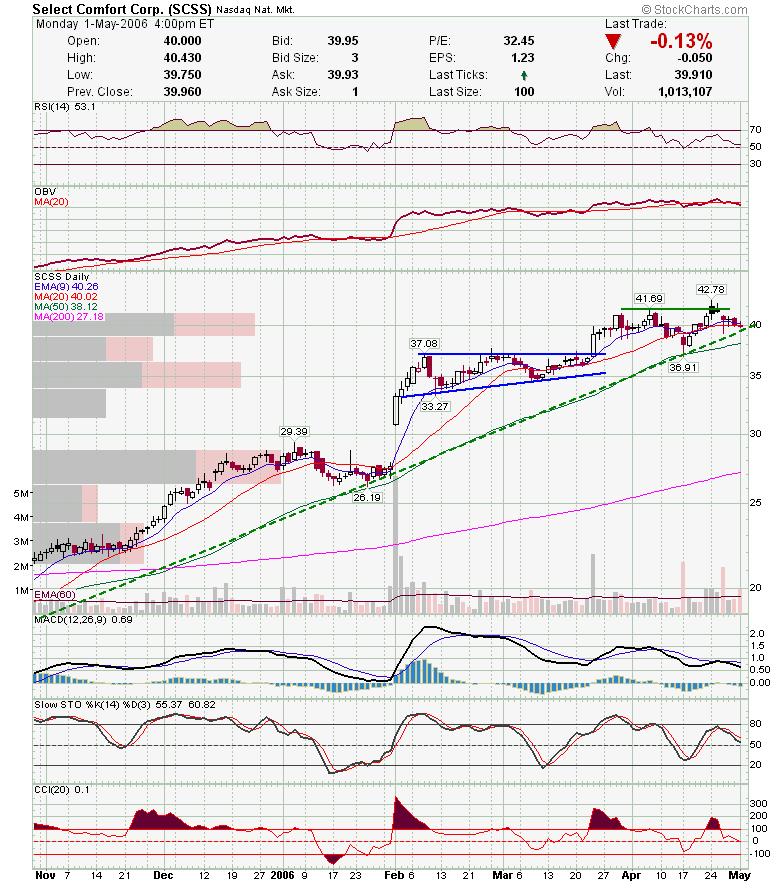 EXP looks to have finished the recent pullback and has support on the trendline.
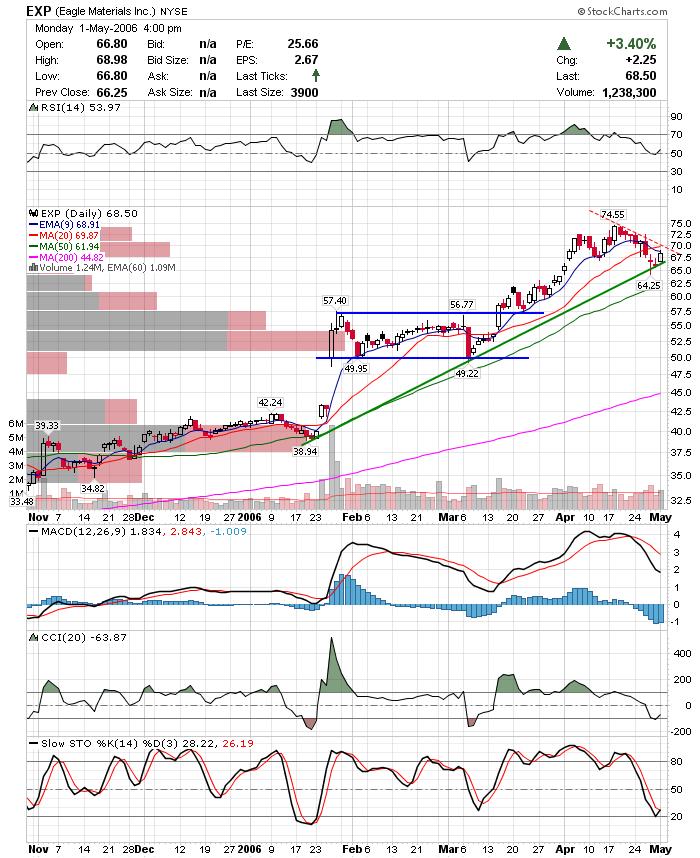 OVTI is one of the more promising charts I turned up. Nice consolidation here and indicators are perking up.
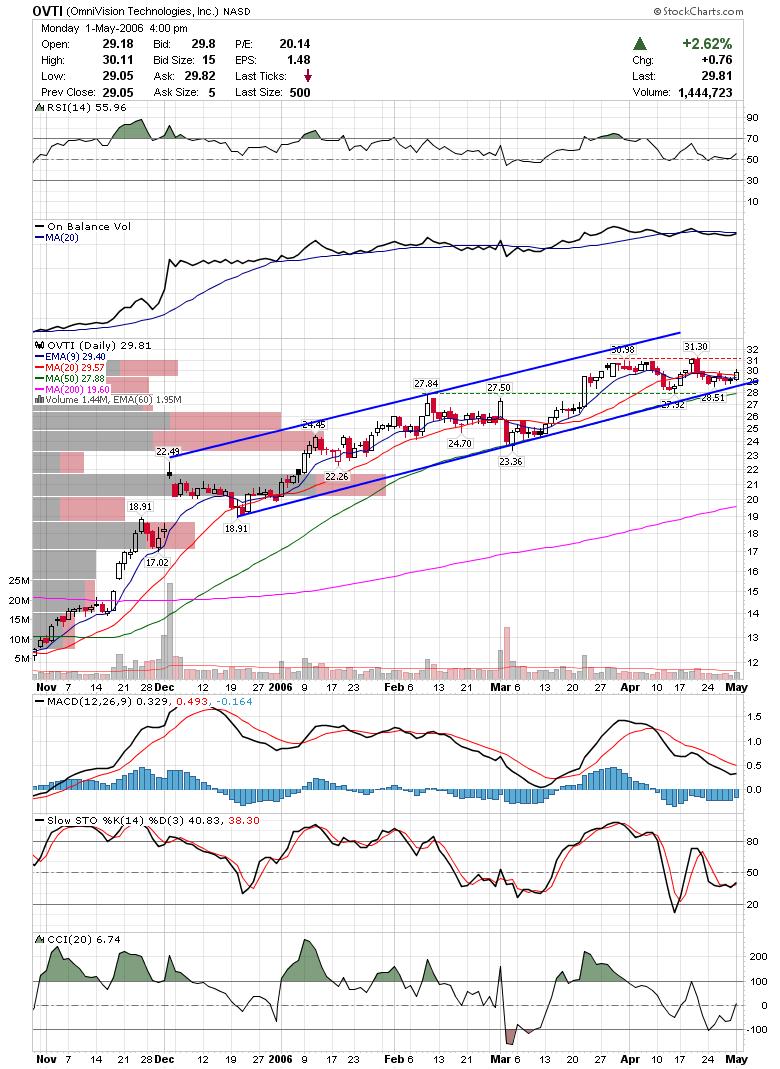 CMC managed to hold on to gains today and finished with a close over the previous 52 week high.
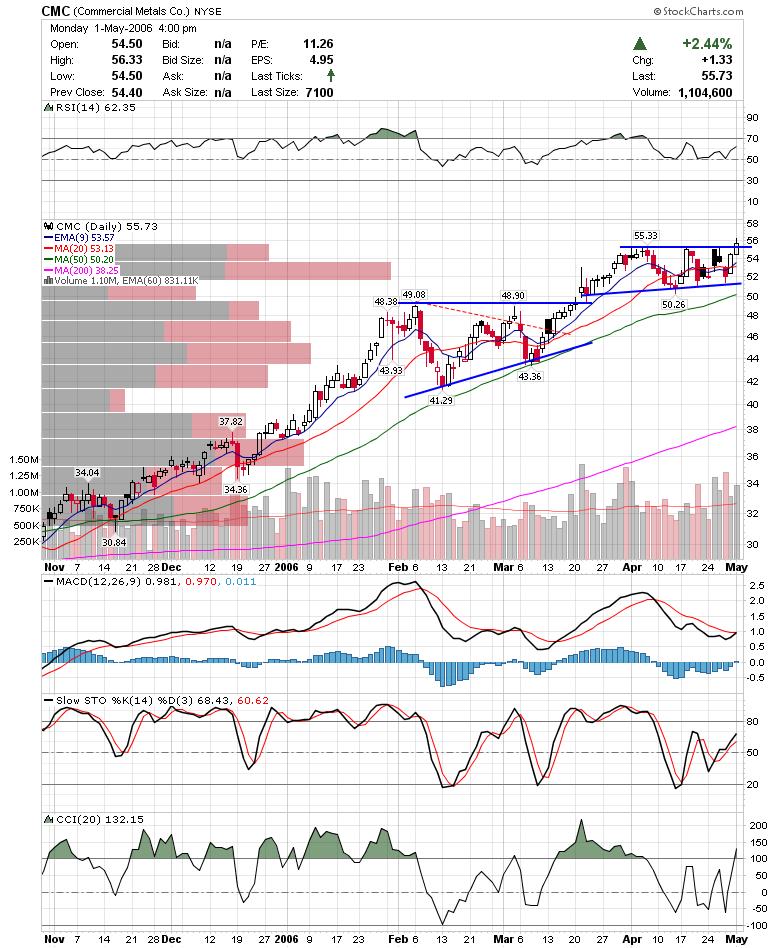 AKAM also hit a new 52 week high and held up very well when the nasdaq was tanking.
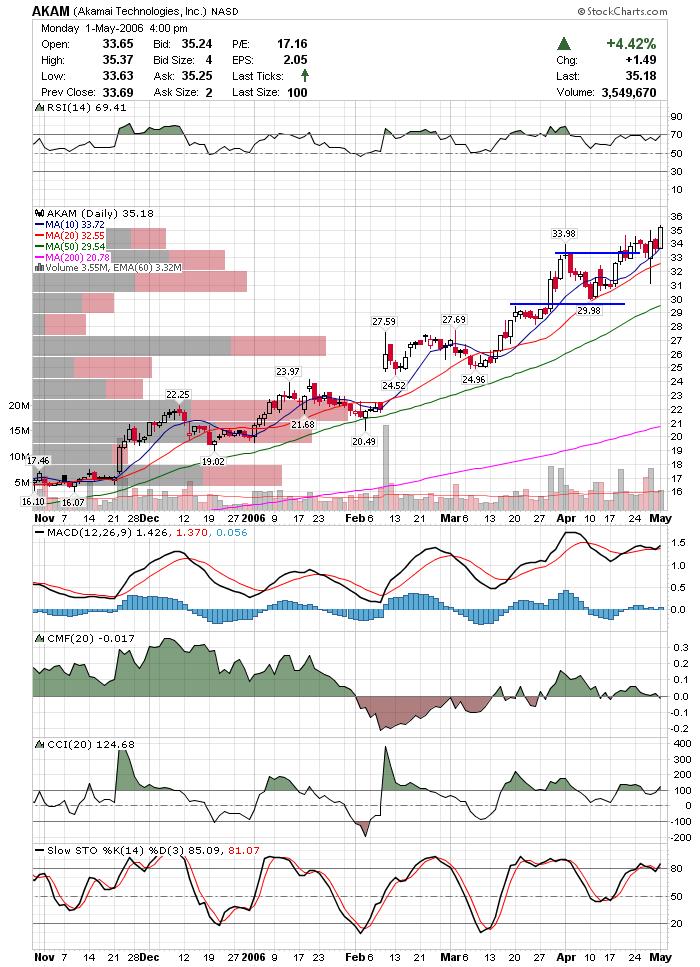 Here are a few charts to watch in case the markets are red tomorrow.
ISE has fellow exchane stock ICE reporting tomorrow. If ICE disappoints, then ISE could break out of the triangle to the downside.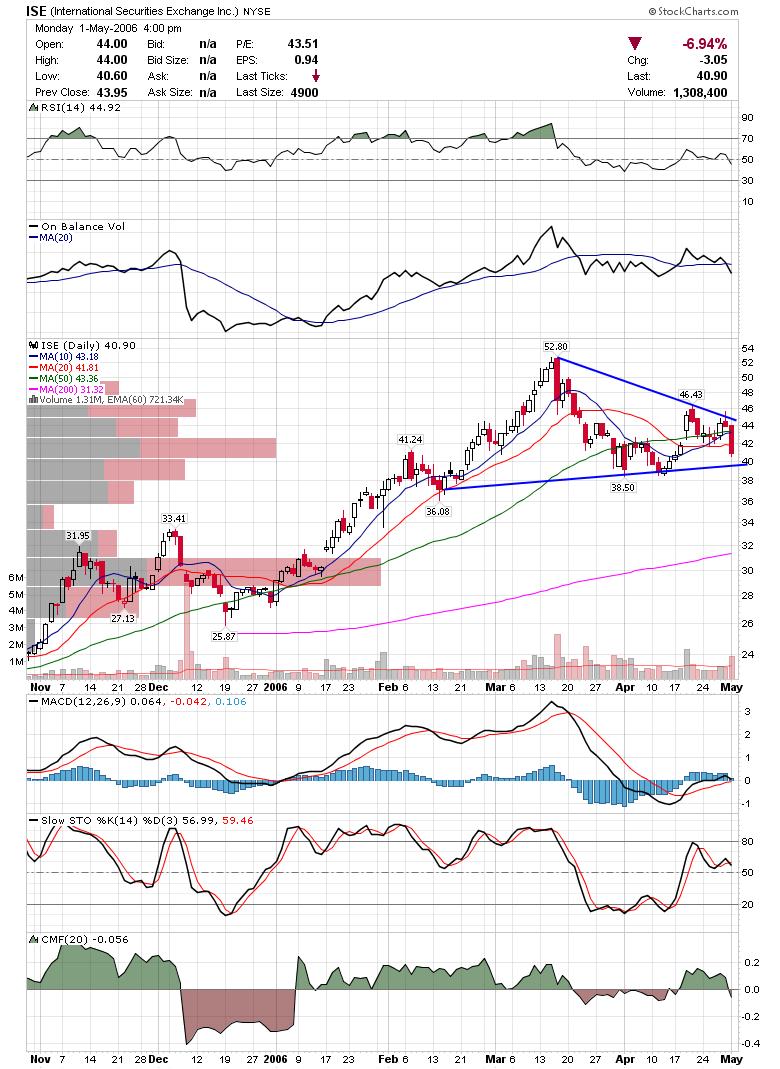 Has MFLX started a downtrend or is this still part of a normal pullback. Keep an eye on the trendlines.
 NSSC looks like it broke out of the existing channel and is testing previous support as resistance. Could break down any day now.
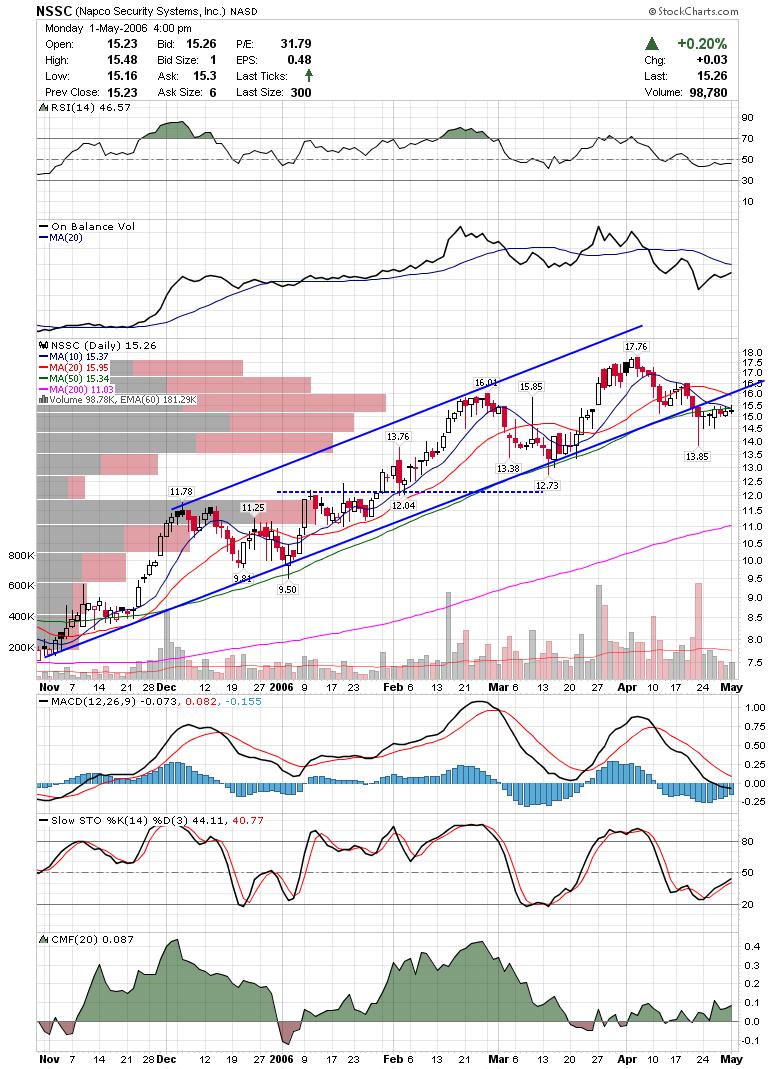
Thats it for tonight. Good Luck,
DT
I want to apologize for not posting any updates the past few days. I was moving over the weekend and the DSL was not ready. I hope to be at least settled in to the point where I can resume keeping up with the market over the next couple days. I do plan on posting some charts tonight. Good Luck,
DT
Downtowntrader will not be posting tonight!


