BOOM may be bottoming out here on climactic volume. While the volume spike is not huge, the day is not over yet. BOOM touched a penny below the top of the December breakaway gap and the gap may serve as support. I couldn't help but pick up a few shares there.
I will be taking tomorrow off as it is options expiration day. A couple of things though to keep in mind. AMD and DELL finally combined forces and AMD was trading sharply higher in the AH session. Also, DELL was trading higher on earnings and the AMD news. MRVL also reported earnings that were well recieved. It should be interesting to see how options expiration affects these stocks in particular. Looks like Semi's may finally get a bounce. Only one chart tonight.
FLSH looks like it is getting ready to break a pennant formation and test upper resistance. Also, some semis such as SMDI and TRID looked decent.
Good Luck,
DT
The selling continued today and every move up was rebuffed. The Nasdaq looked like it would bounce after a strong move down mid morning, but eventually it ended near the lows for the day. I have been expecting a bounce but it seems that everywhere I read people are expecting the same. While it seems likely that the near term bottom may be in, the market has a way of fooling the majority.
Here is an updated Nasdaq chart. I am showing the weekly chart to show the longer term lower trendline.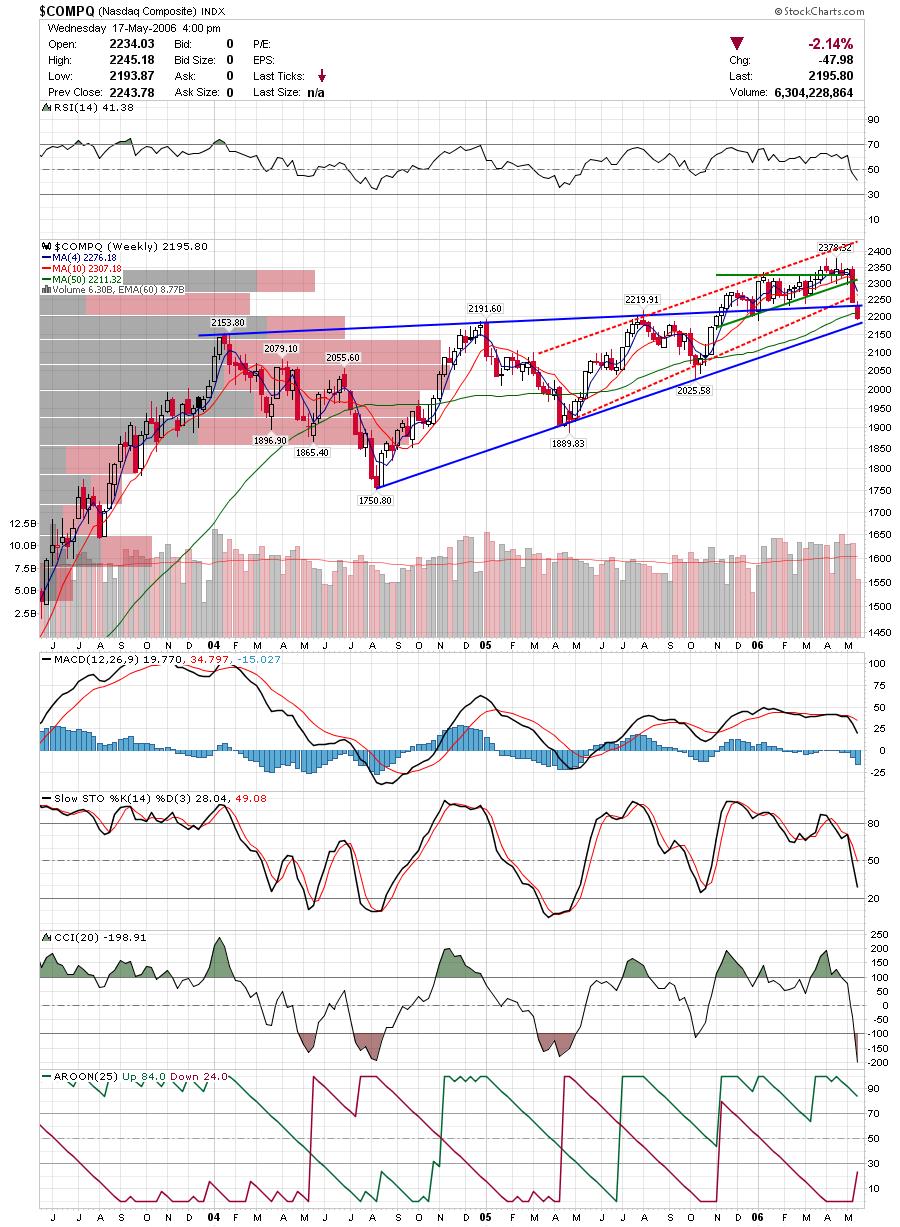
Here is the weekly SP500 chart. The $tick dropped to under -1000 today at one point and you could sense extreme fear with the down move. It looks like the SP500 may be headed to the lower trendline over the next couple of months.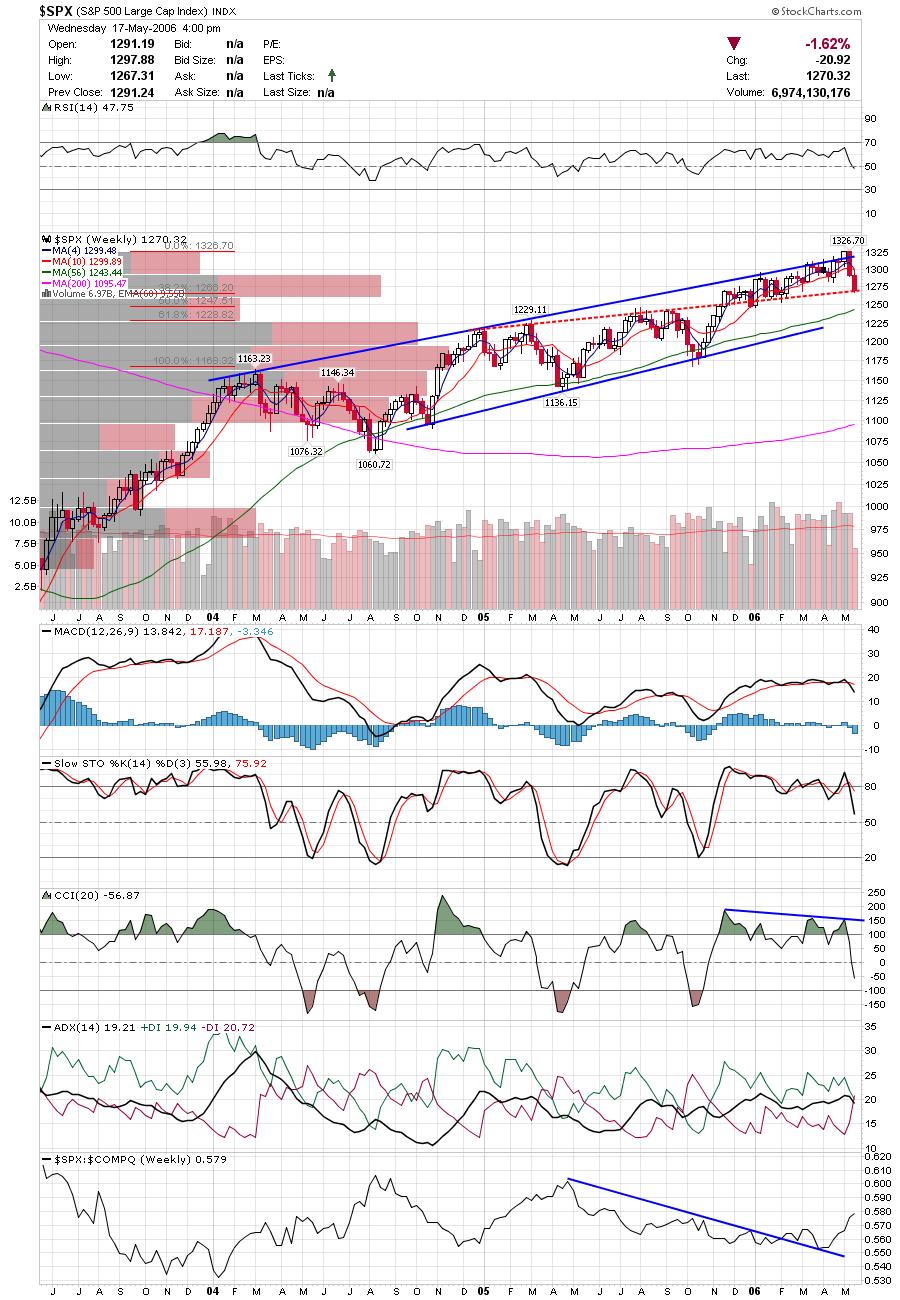
Here is a chart of Oil. Looks like it may get a bounce here as it is finding converging support.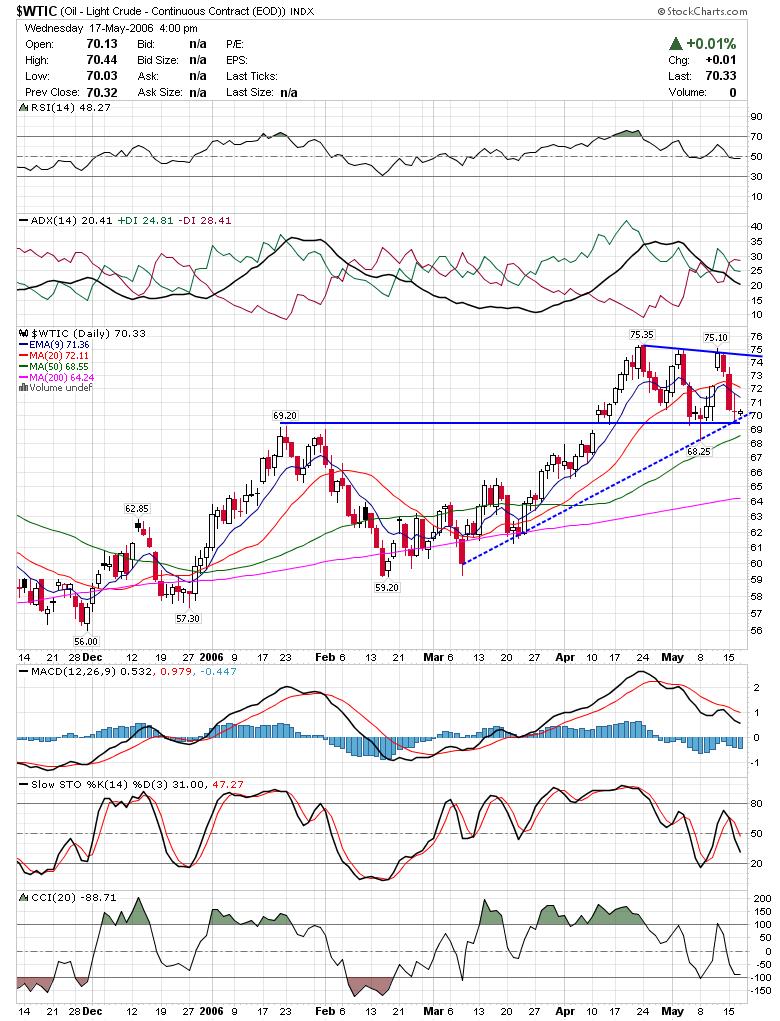
Here is an updated chart of DRIV. If Nasdaq bounces tomorrow then DRIV should break to a new 52 week high.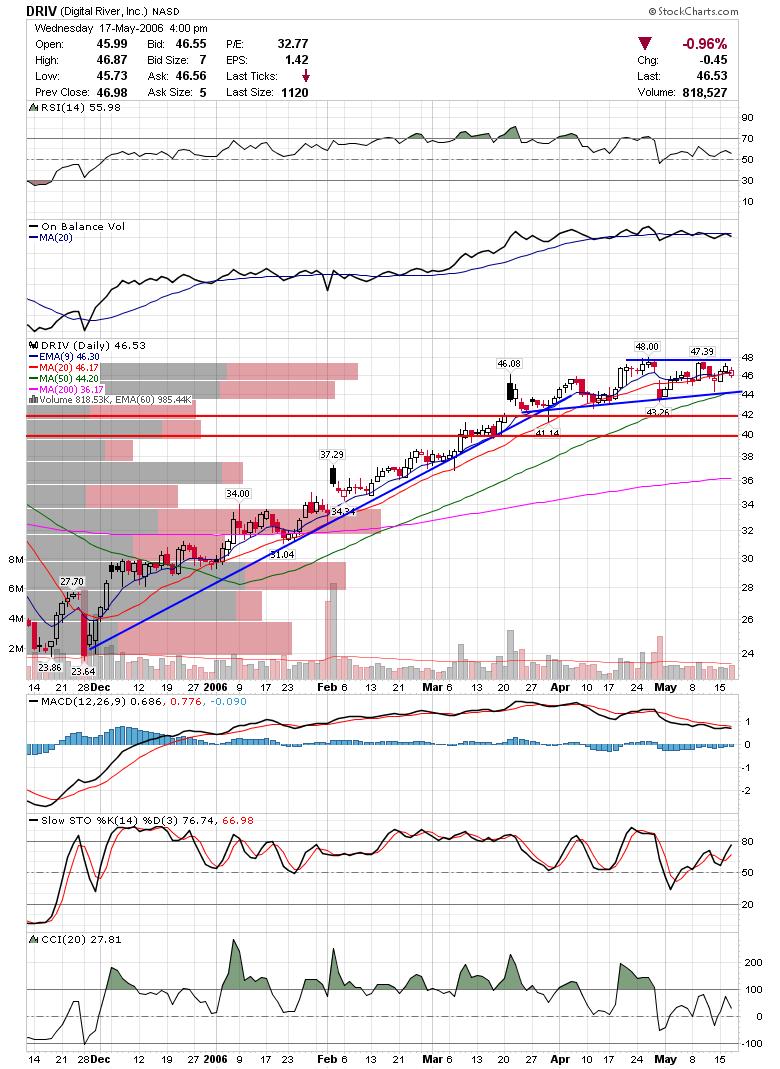
SLW has corrected pretty sharply along with silver. Here is a weekly chart showing a trendline in place since the IPO. Each visit to this trendline has been rewarded handsomely.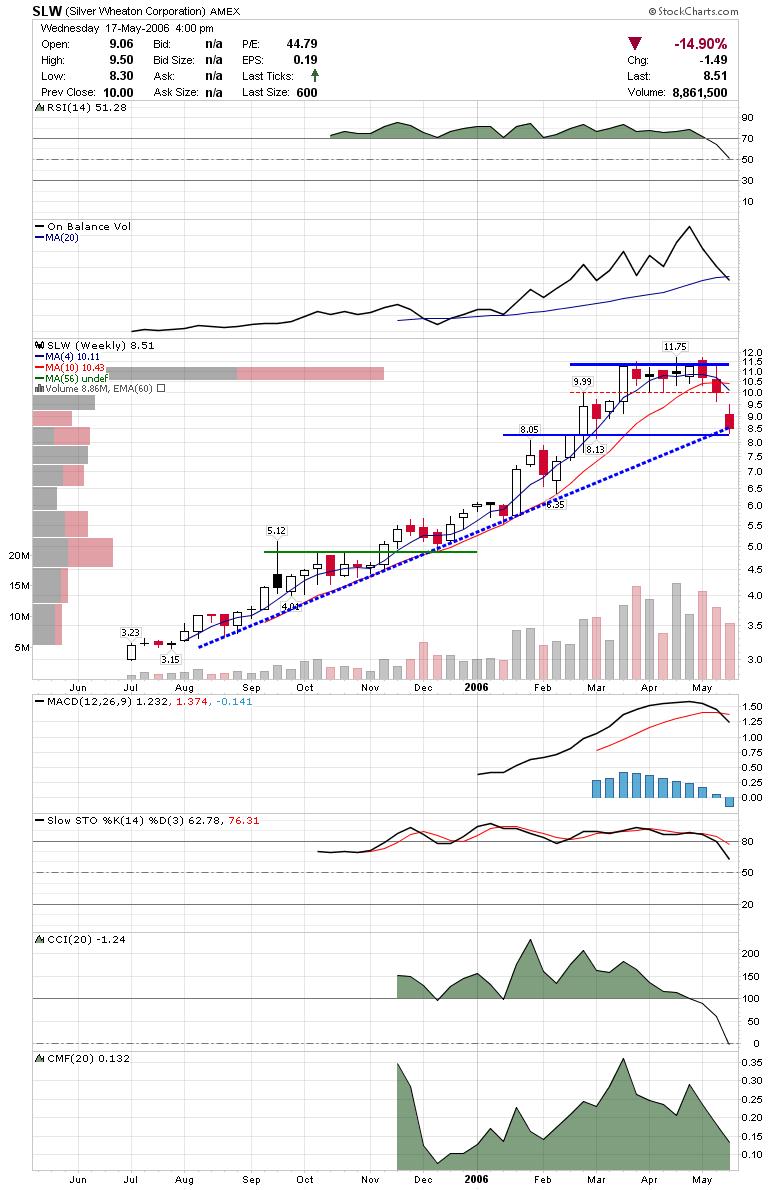
CTXS has been observing support and had an inside day signaling further consolidation.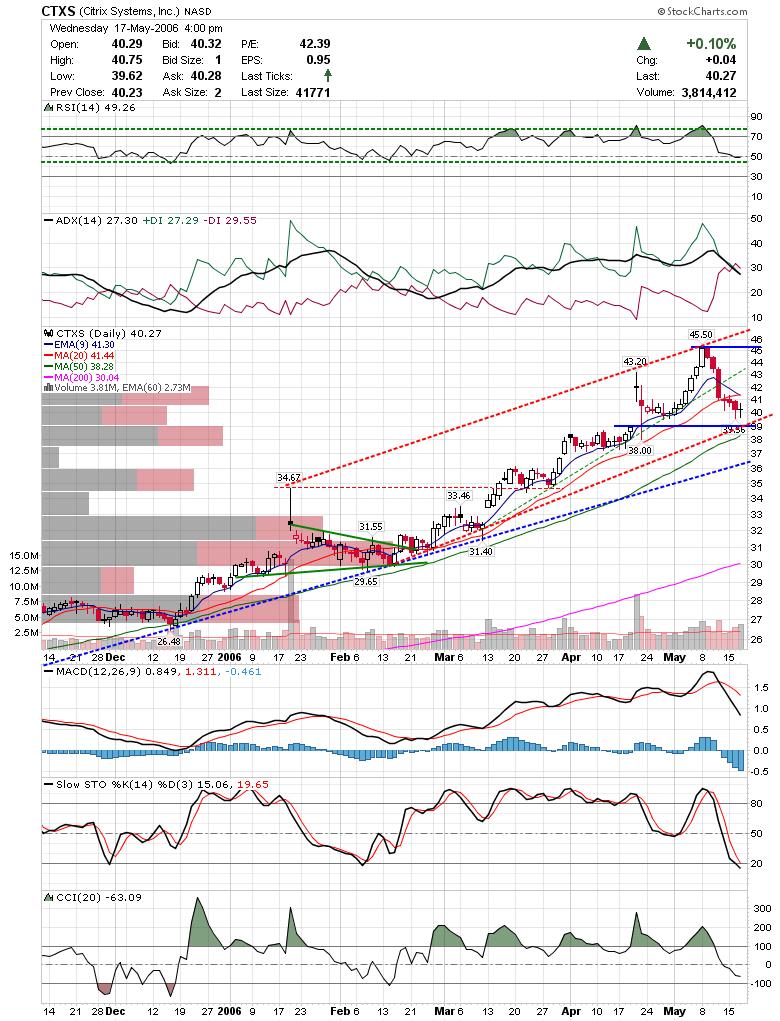
Good Luck trading tomorrow and observe your stops.
DT
Today was another day best served by sitting out. Markets are oversold, but I'm not seeing too many charts that I like.
Here is a chart showing the SP500 breaking a minor trendline. We still have plenty of room to the downside here if weakness builds up.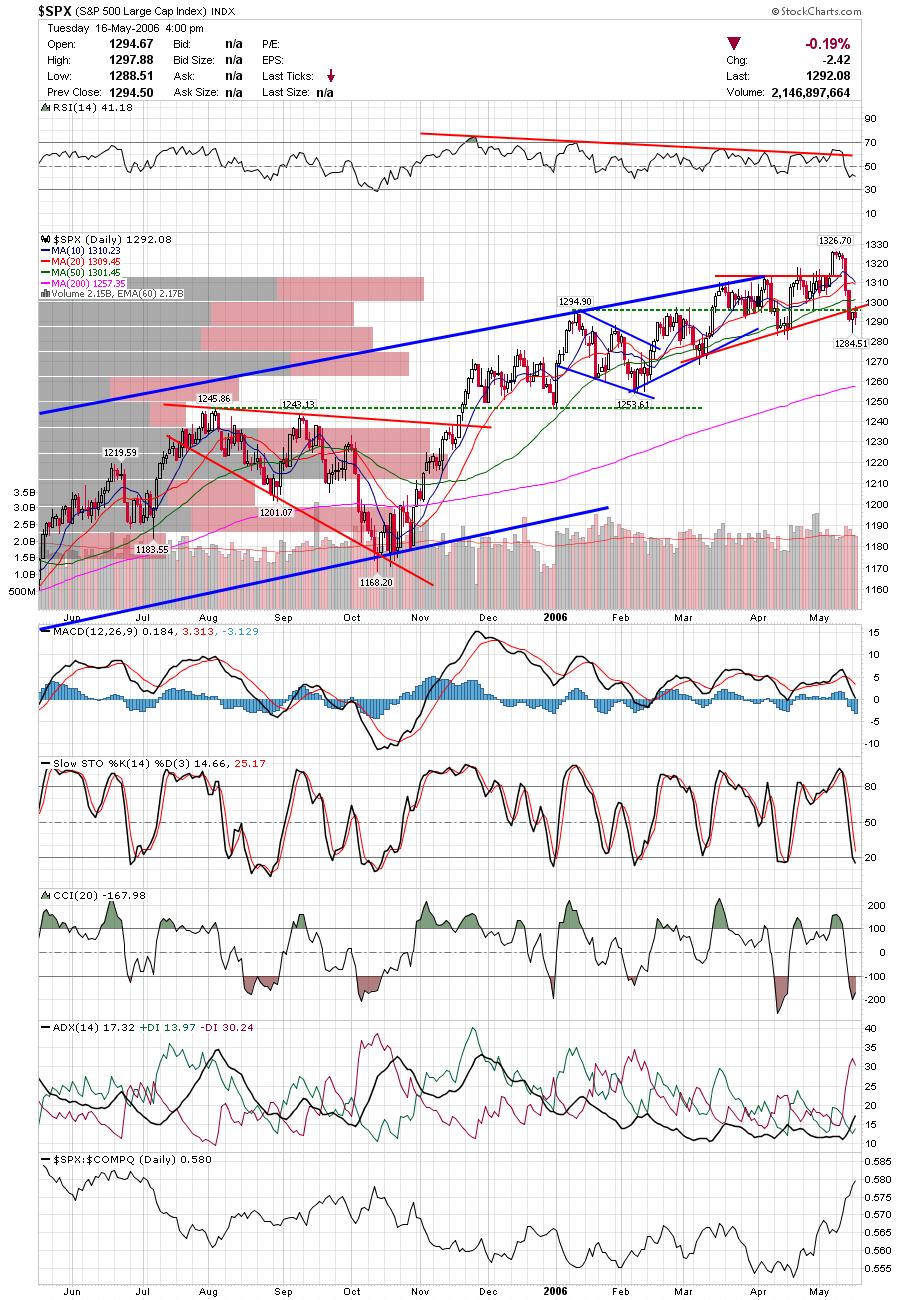 GOL remains well positioned here mainting above the previous breakout.
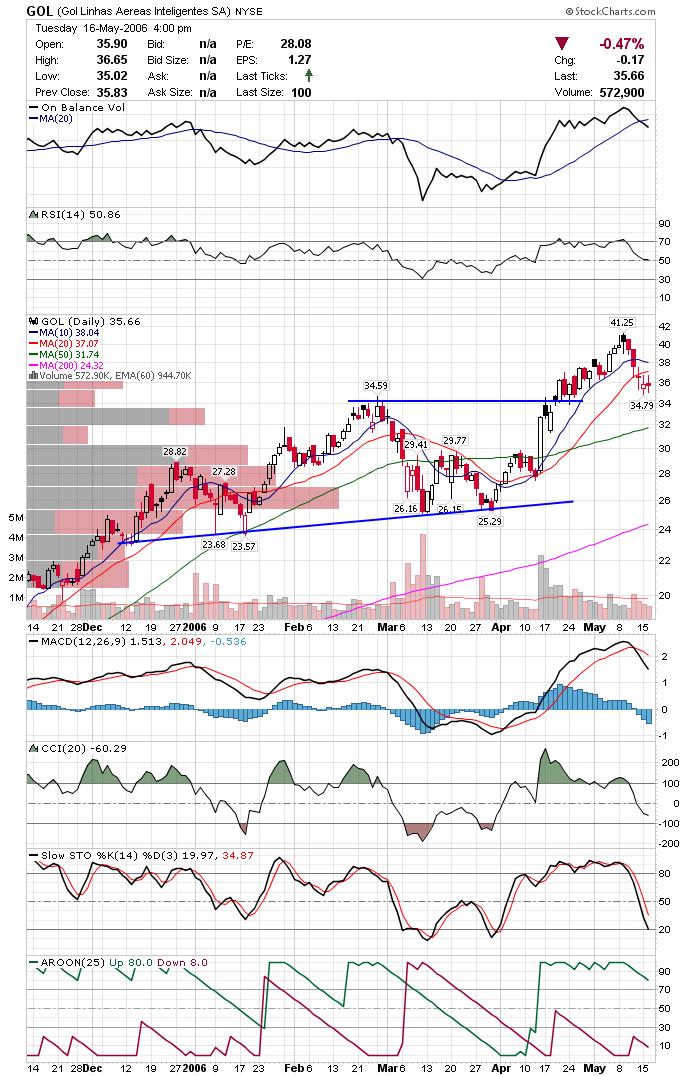 FWLT looks like it may take back the trendline as support.
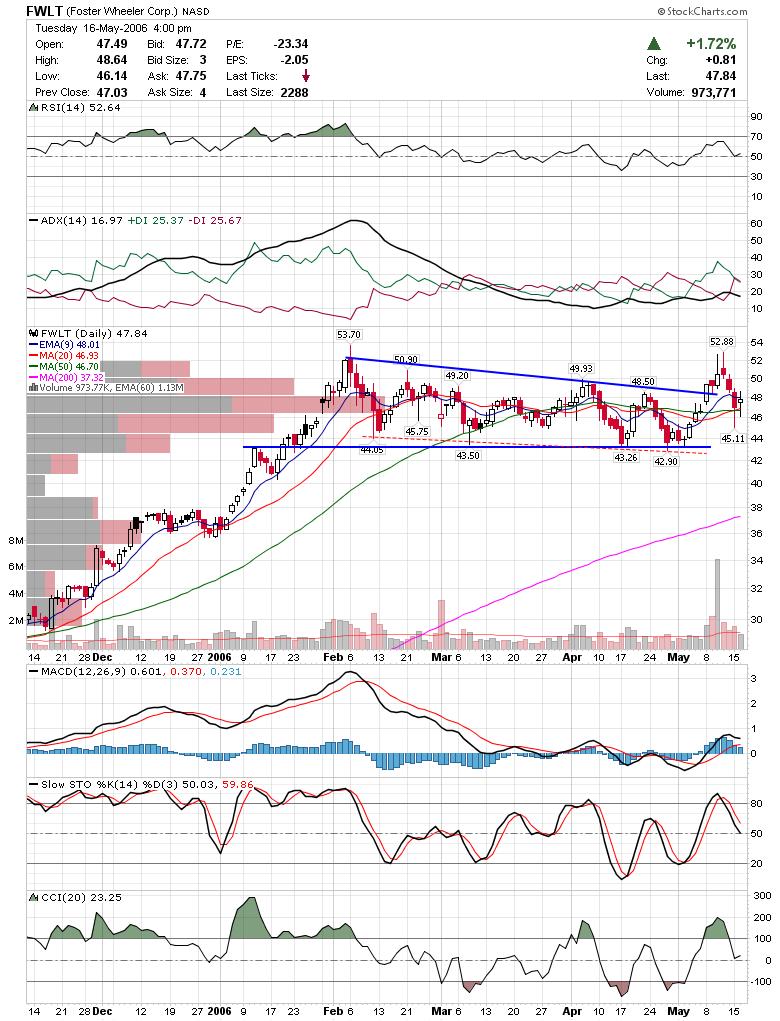 ASFI pulled back to test the gap as support and looks like it is holding it.
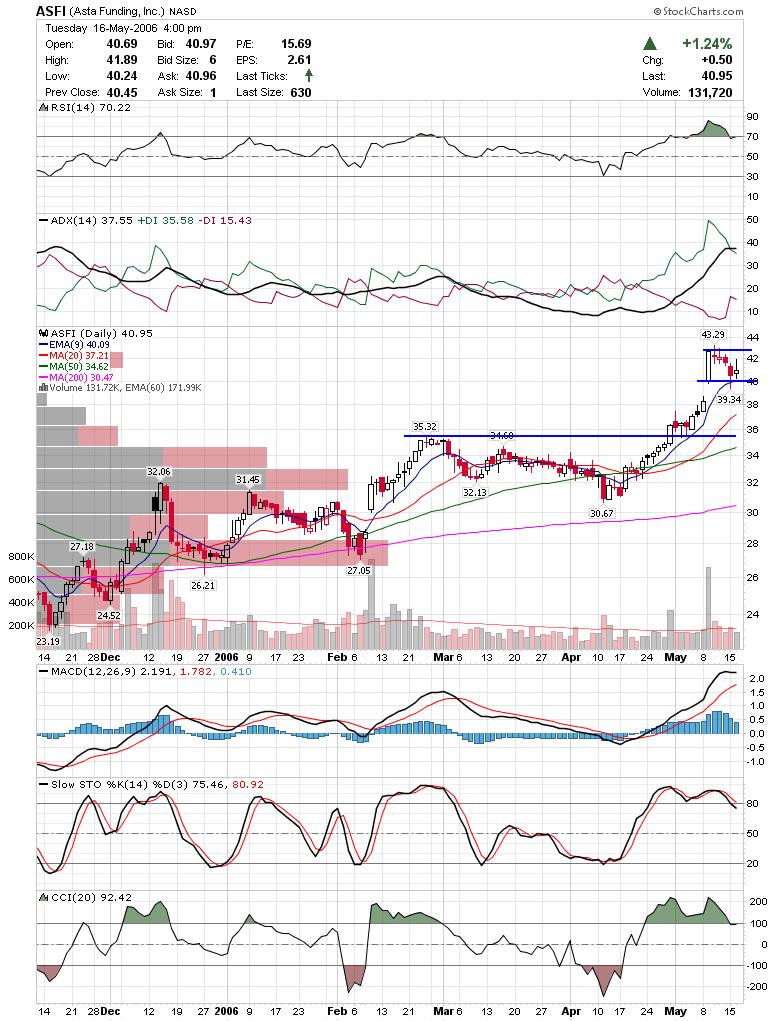
I was having a hard time finding decent looking charts for my trading style tonight, so I figure that if I have to look to hard something is not right. I will watch the few charts that I have turned up the past few days and take trade ideas setups for now. Trade ideas has given me a few decent shorts lately including aapl today.
Good Luck,
DT
Looks like we started to get a technical bounce after more weakness today. In reviewing charts tonight, I am seeing a ton of damaged charts. By damaged, I mean stocks that have made lower pivot points after double tops, failed breakouts, etc. It looks like a lot of people will be selling this rally, and with all the lower lows, there may be some good shorts coming up.
Here are updated weekly charts offering a better perspective on some of the indices.
Here is the Russell which actually has held above the previous channel.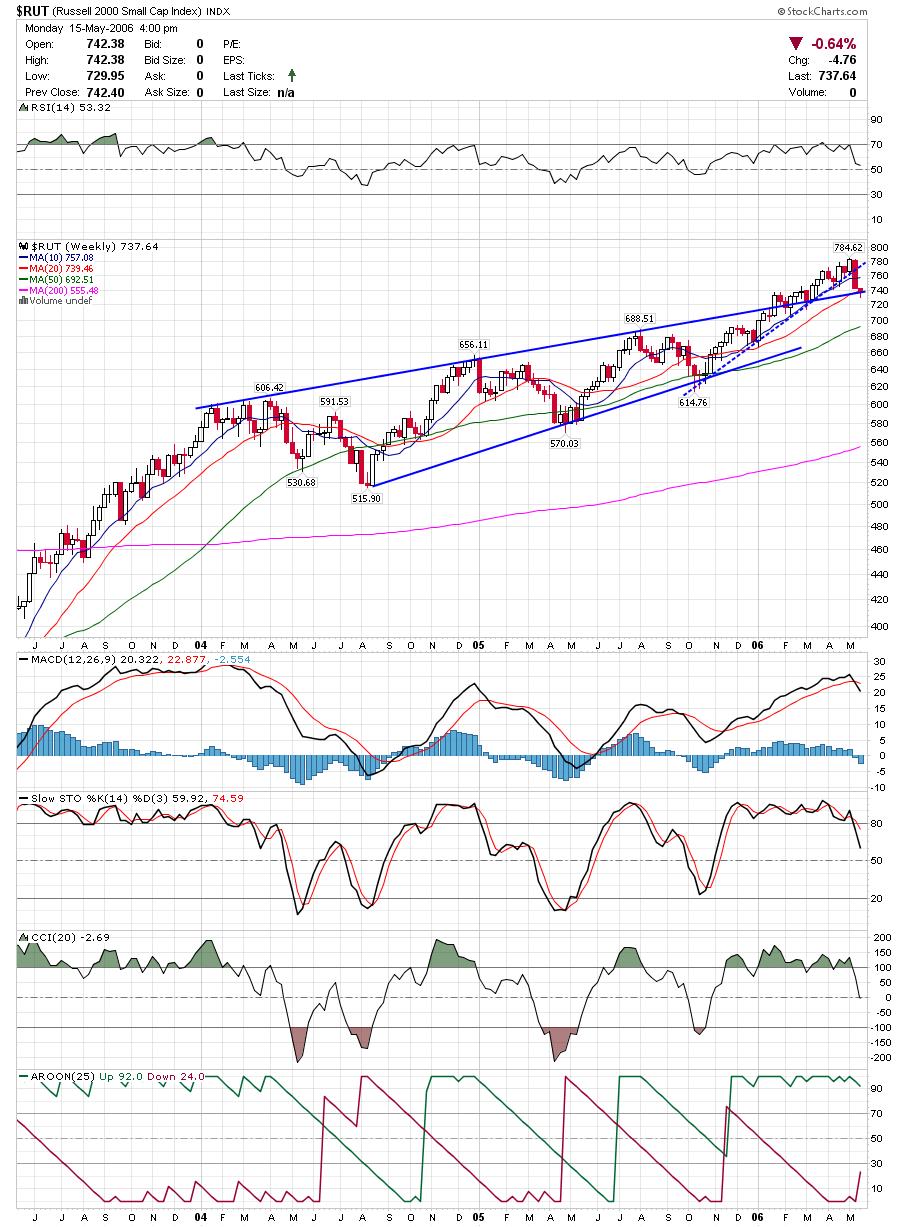 The SP500 rode the upper trendline for several weeks, but CCI, Slow Stochastics, and MACD are all on short term sell signals.
 DRIV has held above the red lines I have as previous resistance. If it clears this triangle, it could be a great move.
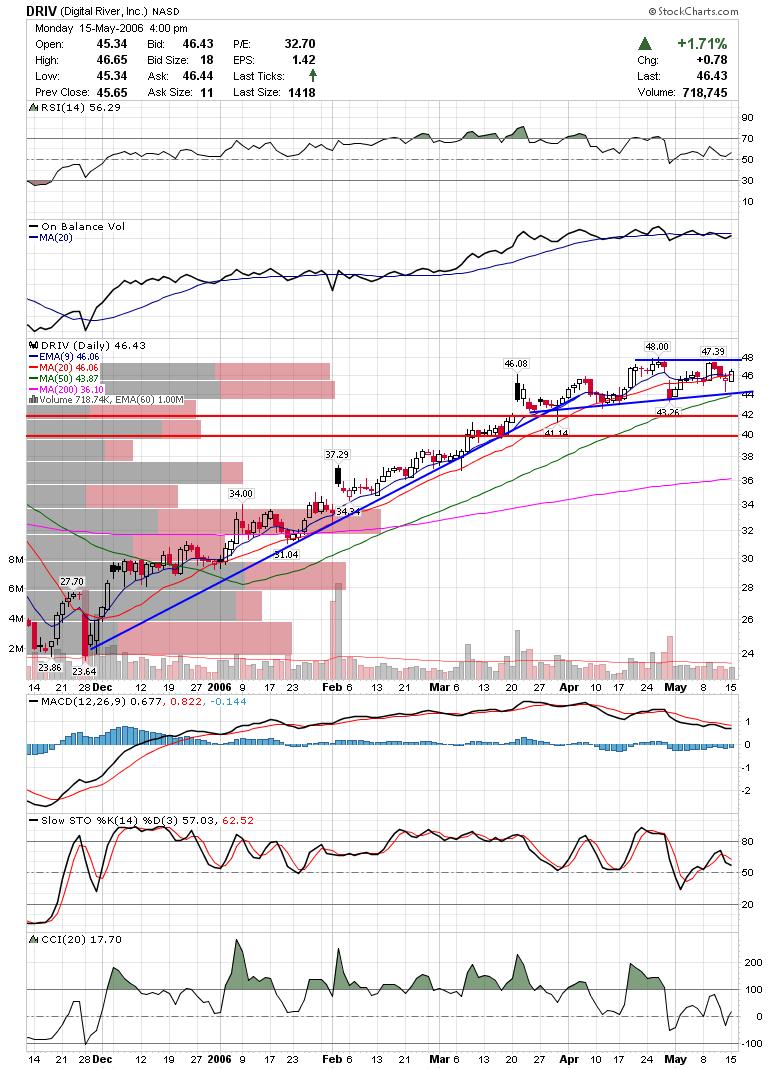 ICE has also held above the triangle breakout without too much chart damage.
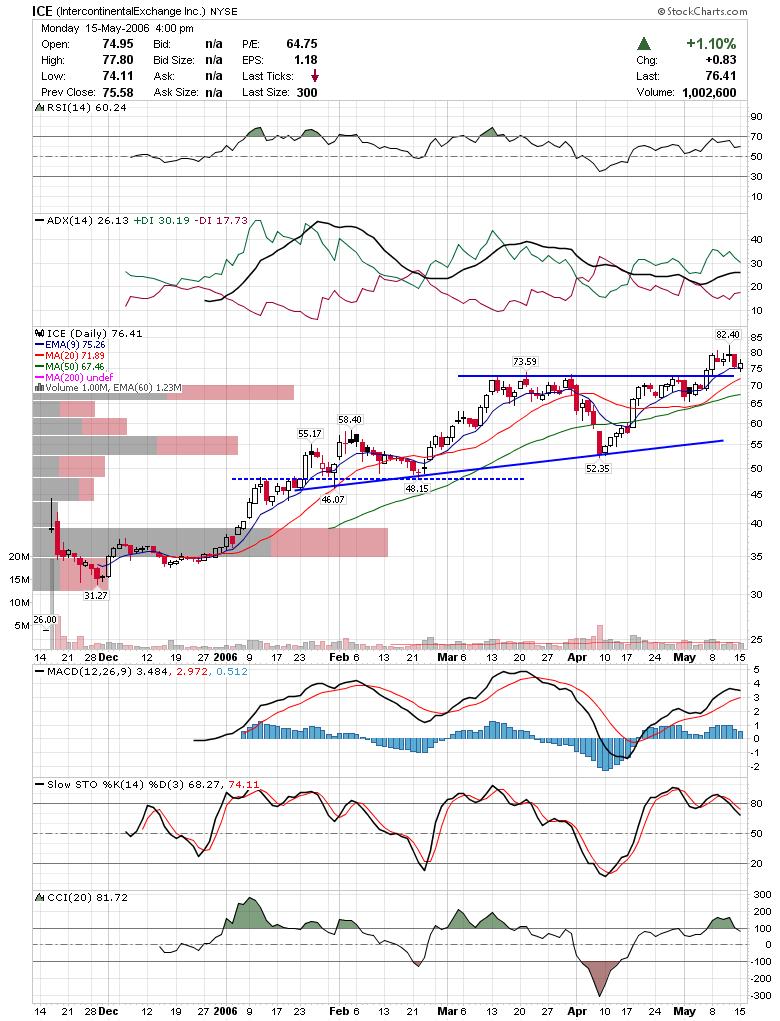 TWGP looks like it may challenge recent highs.
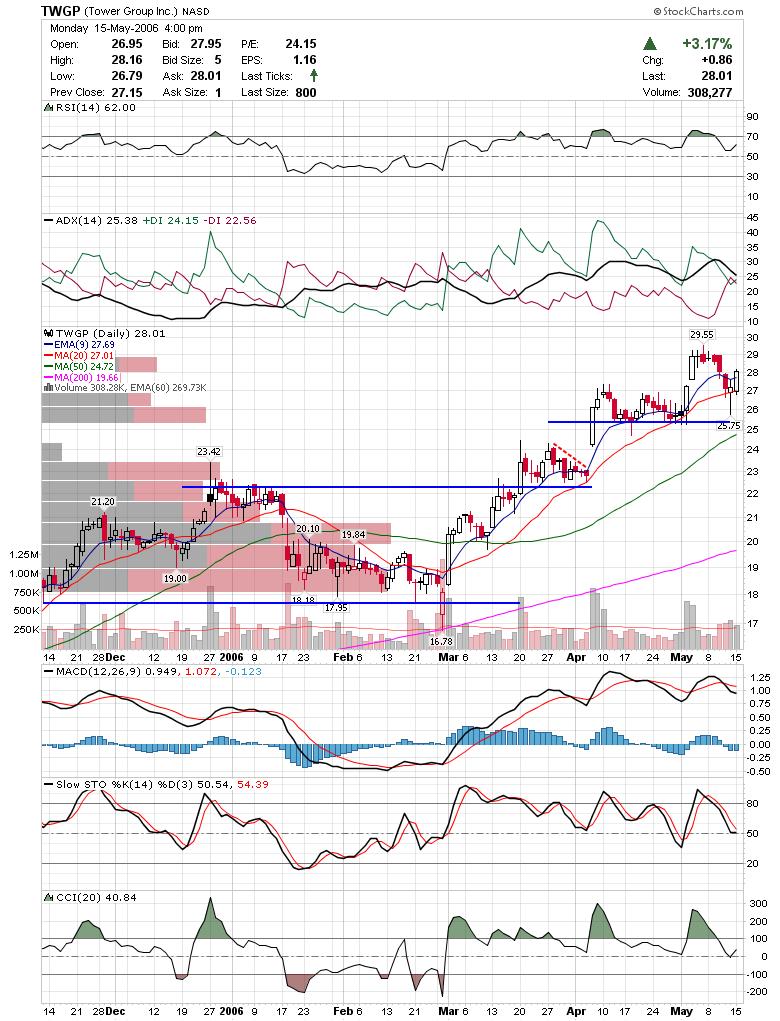 OMC didn't pull back with the indices the past couple days and made a new 52 week high today.
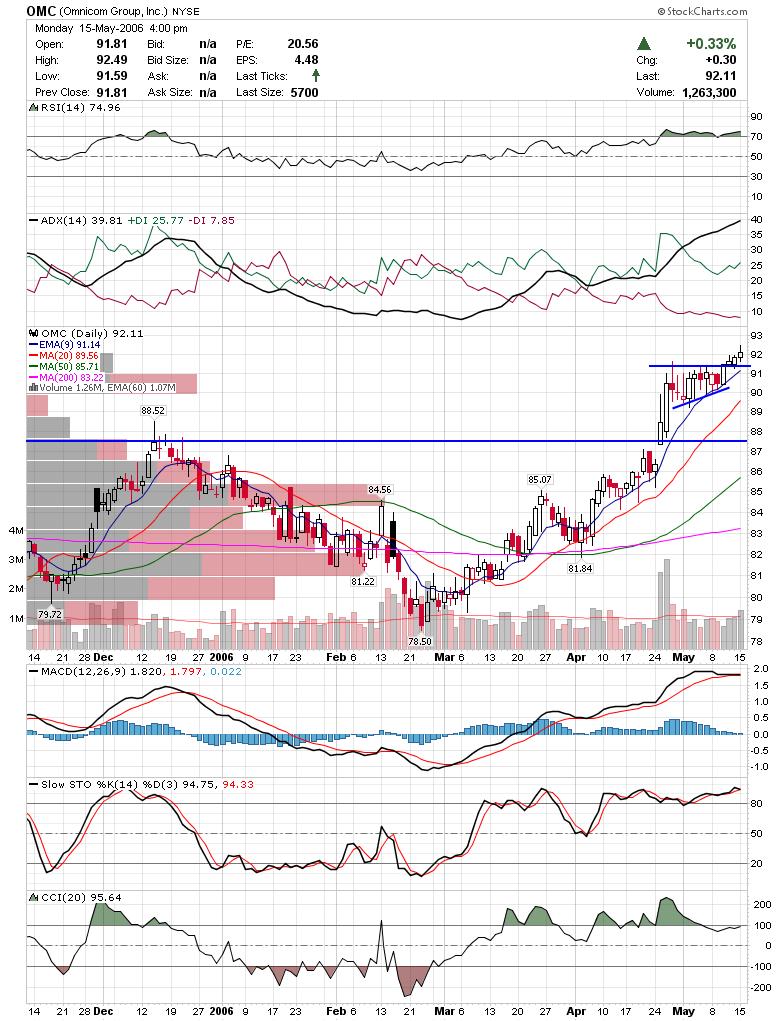
Thats all for tonight.
Good Luck,
DT
This is a tricky spot to trade as the markets are clearly showing weakness, but are very oversold in the near term. I noticed that while most were taking a beating, semi's were doing well until some late day weakness. Small have been getting pummeled.
Here is a chart of the Sox which has clearly broken support. However, this doesn't mean it won't have a tradeable bounce here soon.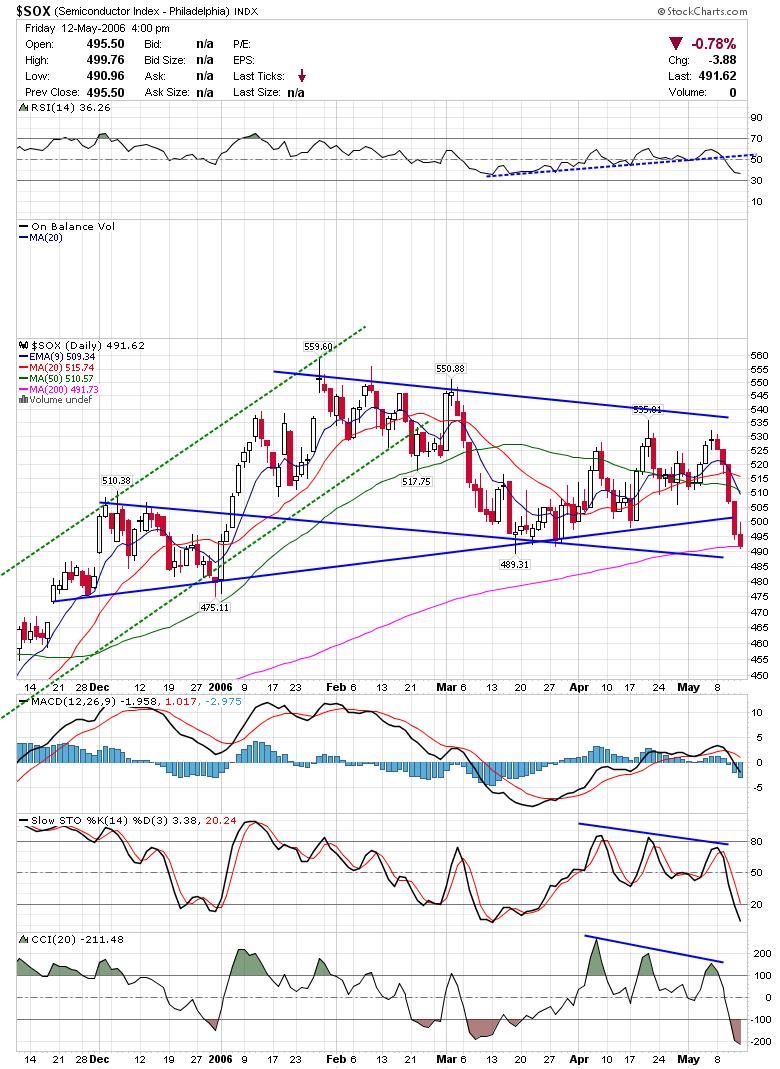 MRVL broke under support however, buyers stepped in strong volume possibly setting a bottom.
 TRID is another one that may of found support.
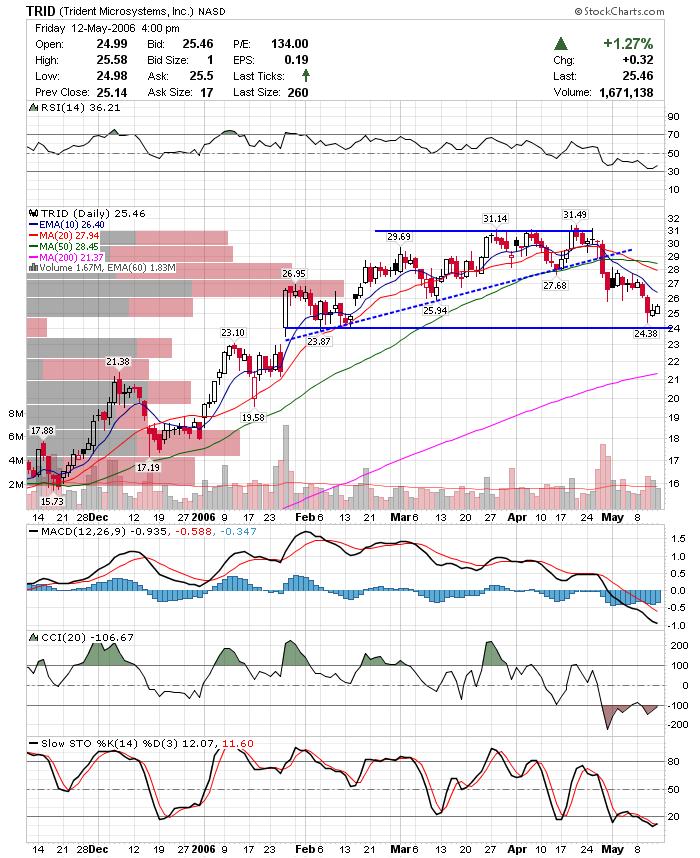 SNDK has been following the lower trendline and may be resolving into a triangle.
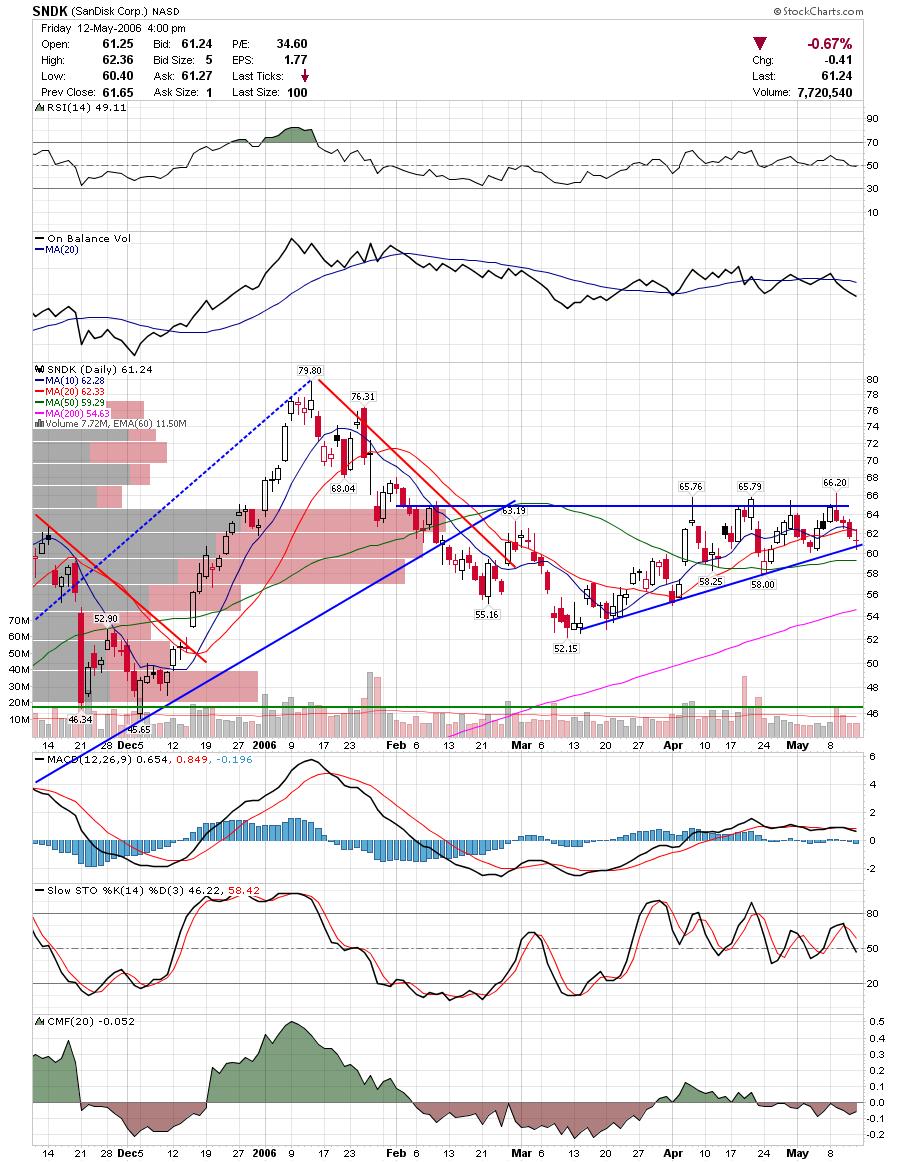 GOL may be setting up for another high.
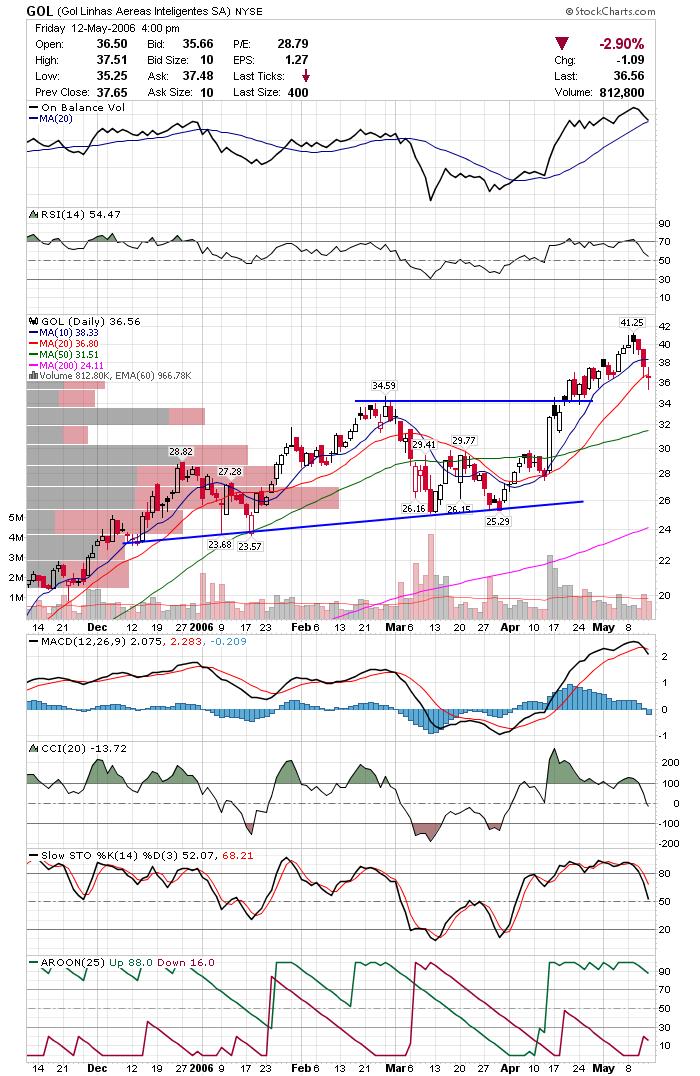 NEU may of found support at the rising trendline.
I probably won't be looking to initiate any swing trade shorts due to how quickly the markets became oversold.
Good Luck,
DT
Subscribe to:
Posts (Atom)


