The major indices got bounces today as expected. Tomorrow will be interesting as lot's of people will be taking the day off ahead of the extended weekend. While a reversal has been in the cards, there has been a lot of chart damage done to all the indices and many stocks. The weekly charts of most of the indices are on sell signals from multiple indicators.
Here is the weekly SP500 chart. It is holding up at the 50% fibonacci retrace which is positive, but parabolic sars is on a sell signal. It is looking like it will retrace up before turning back down.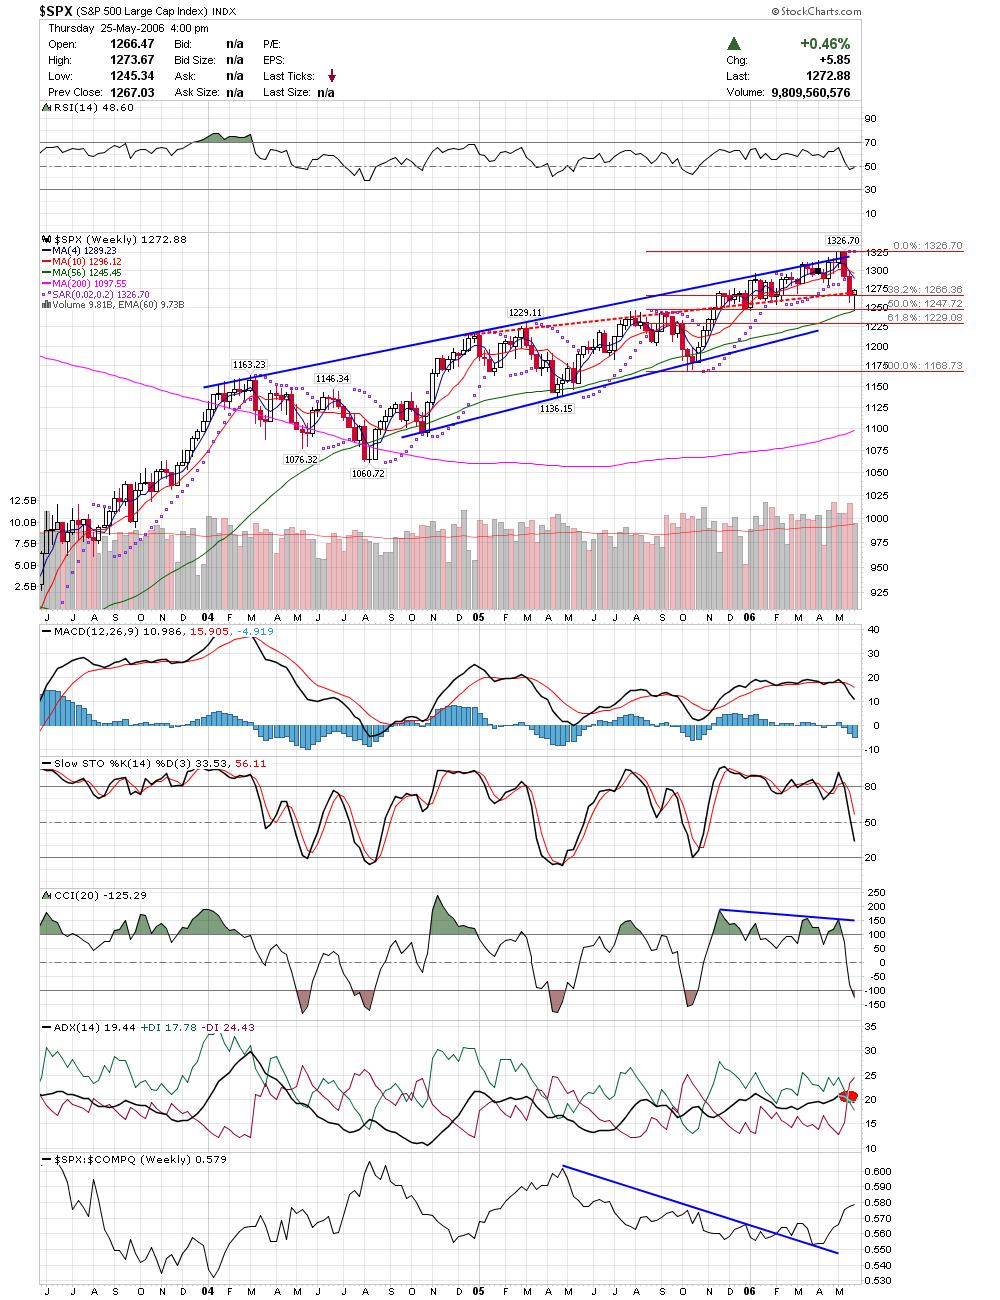 Russell 2000 index printed a morning star reversal pattern today. Lots of damage here, but it looks like it will move a little higher.
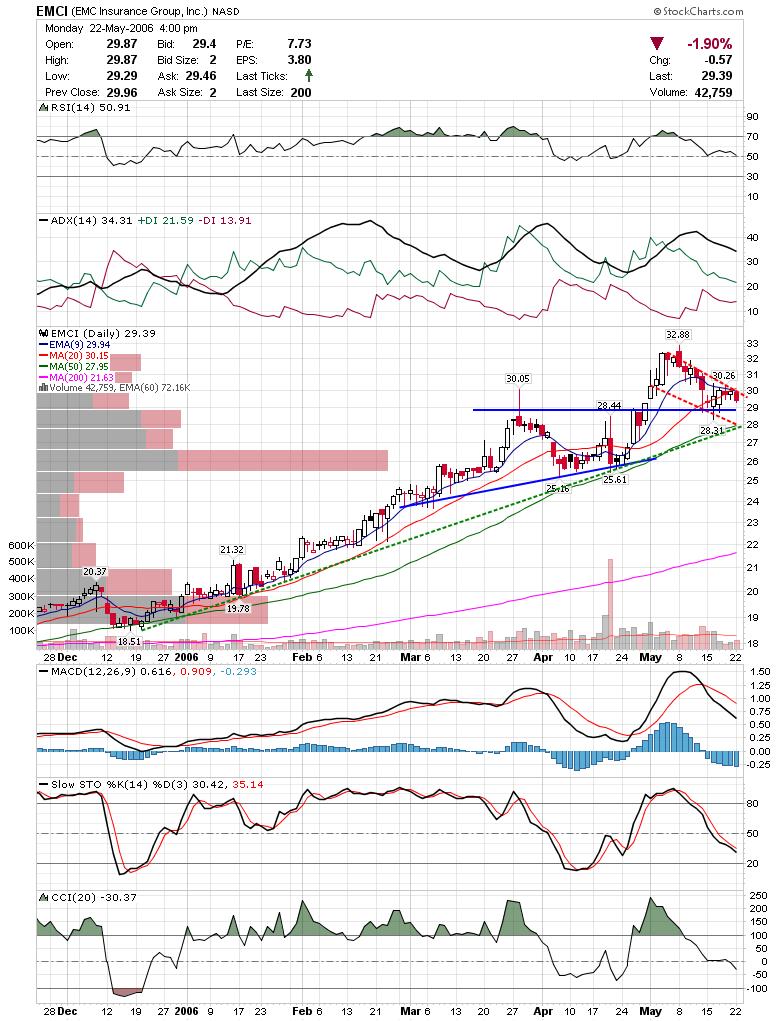
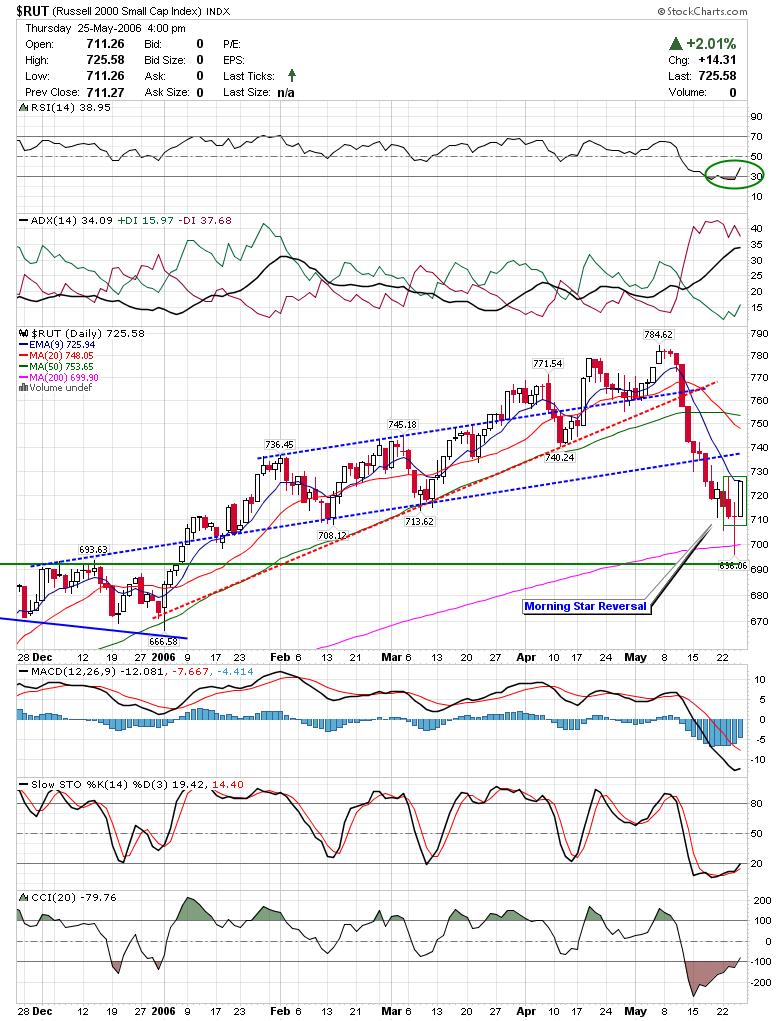 Here is an updated chart of EMCI clearing the downtrend channel.
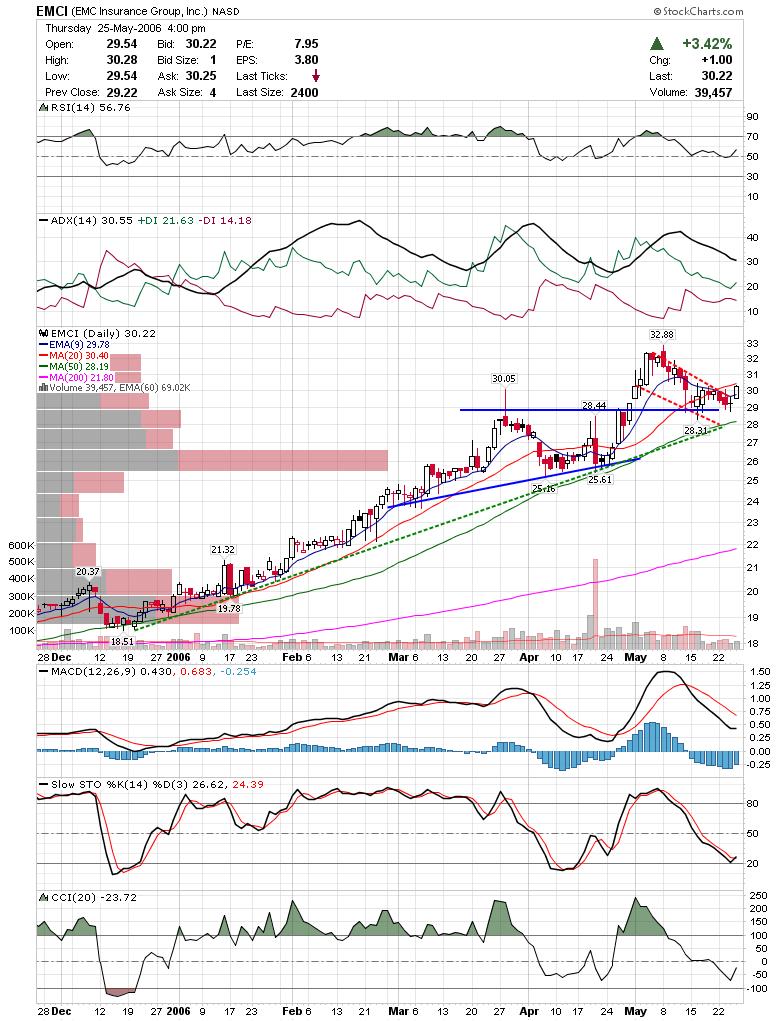 PCLN is looking pretty good breaking out of a bull flag pattern.
 LIFC looks like it found support at the breakaway gap. Watch to see if it can clear the pennant pattern.
 OII is another bull flag pattern in the works. Looks like it just cleared it today.
 PLXS has been pulling back steadily into support. Finally got some buying today and may be ready to retrace some of the pullback.
 PAY is clearing resistance here and may head to top of channel.
 NTRI may be getting gap support here as well. They still have some resistance to work through but the risk reward is decent here.
Thats it for tonight. Keep in mind that the indices are trying to hammer out a near term bottom and could give back any gains fairly quickly.
Good Luck,
DT
I had to leave early again today to attend a graduation, so I didn't see the markets finish. I do know that when I left things looked pretty bleak and when I got back tonight things were off their lows. It's hard to say what will happen, but I found it interesting that we had a high volume day today where normally volume would be muted. The fact that we closed stronger may be a hint that a near term bottom is in place, with the key word being near. Here are a few interesting charts I found.
TRN has some long tails here into support. TGE looks like it may hold the trendline after breaking initial support.
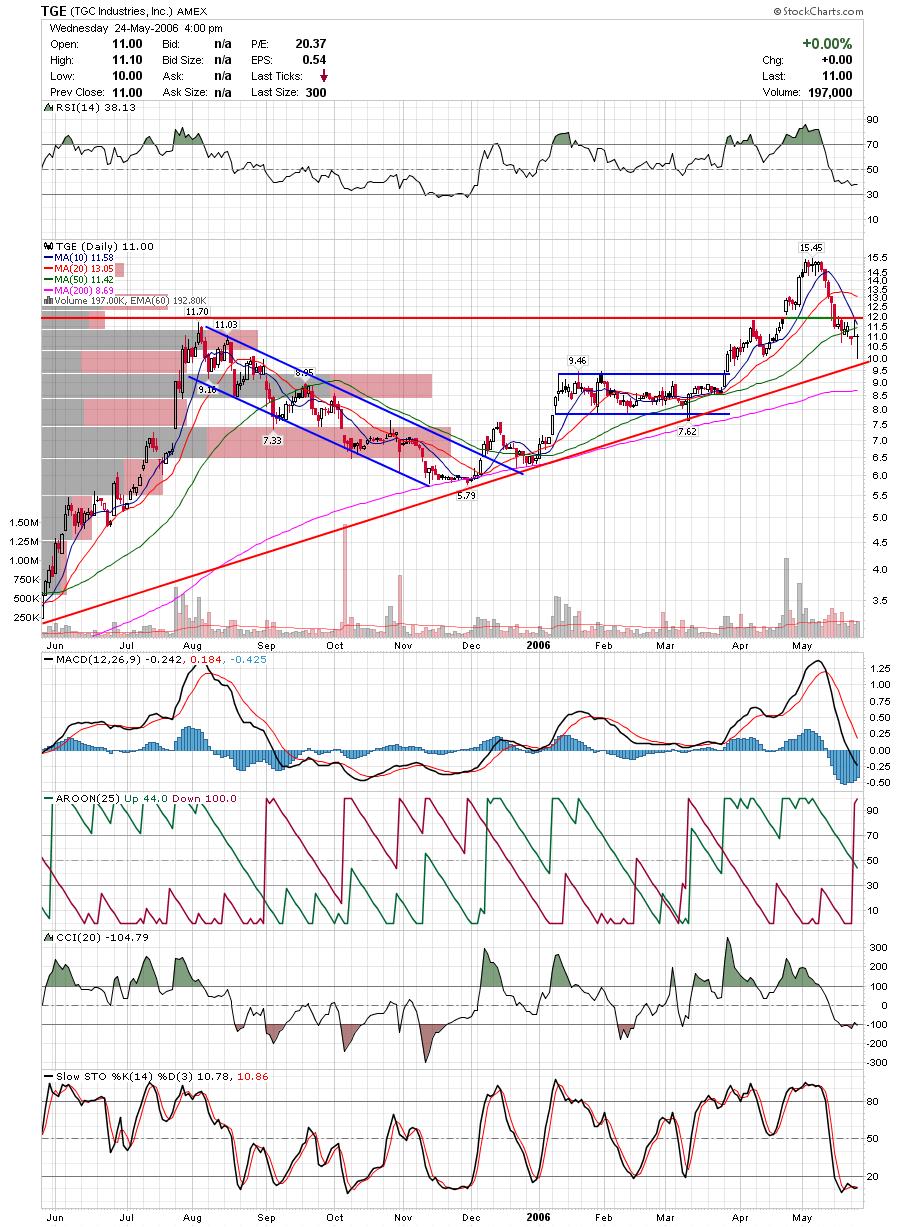 OMC has shown some relative strength refusing to go down as the markets have tanked. Although todays move was not huge, it did make a new 52 week high on strong volume.
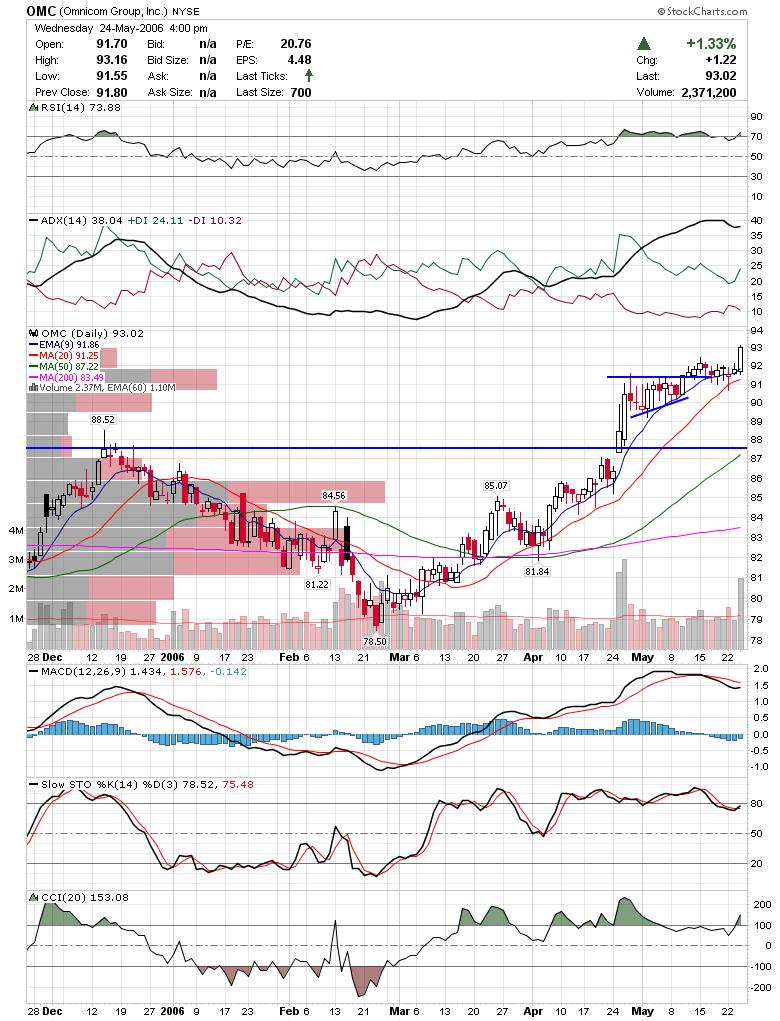 I meant to post LUK last night but somehow I missed uploading the chart. Either way, they look decent especially if they can clear yesterday's high.
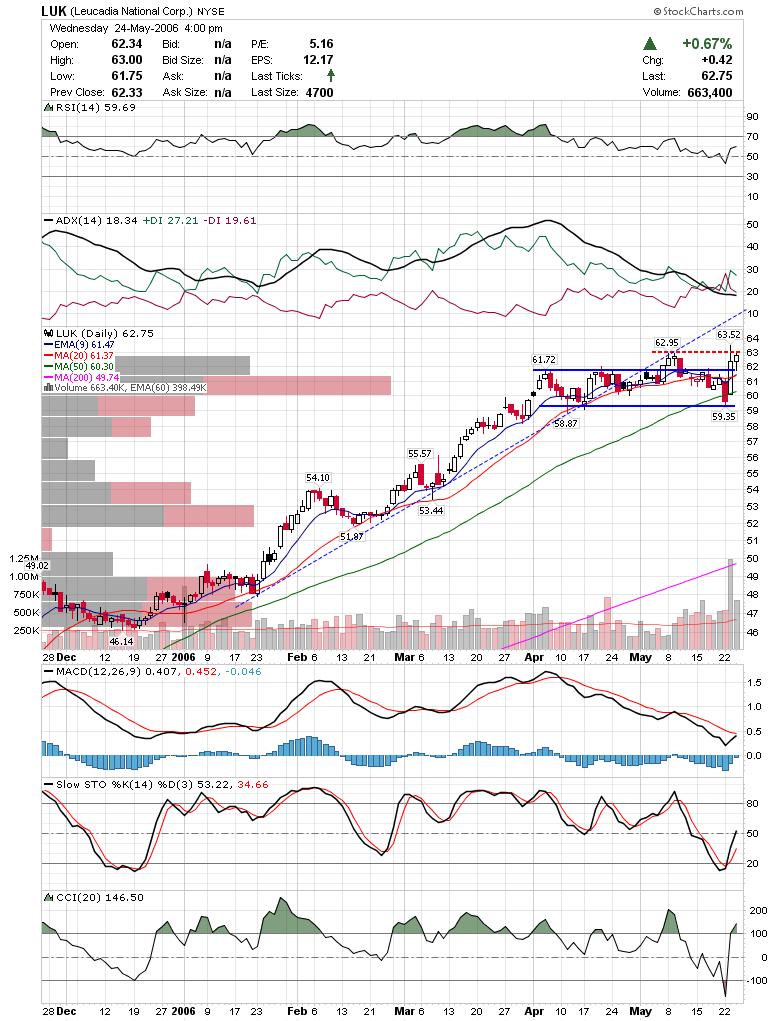 PANL fell out of the near term channel but looks like it may bounce here at a previous breakout point.
 SAFT closed it's gap and finished near the high of day. If I was short I would be nervous about it failing to breakdown.
 RBC looks similar to some of the charts I have been seeing lately pulling back to it's previous breakout area.
 FTC is another one pulling back to a breakout, although technically the breakout area was before the gap up.
I've been watching FMD tread along this triangle for a few weeks now. This looks like a decent area for early birds not wanting to wait for the triangle break.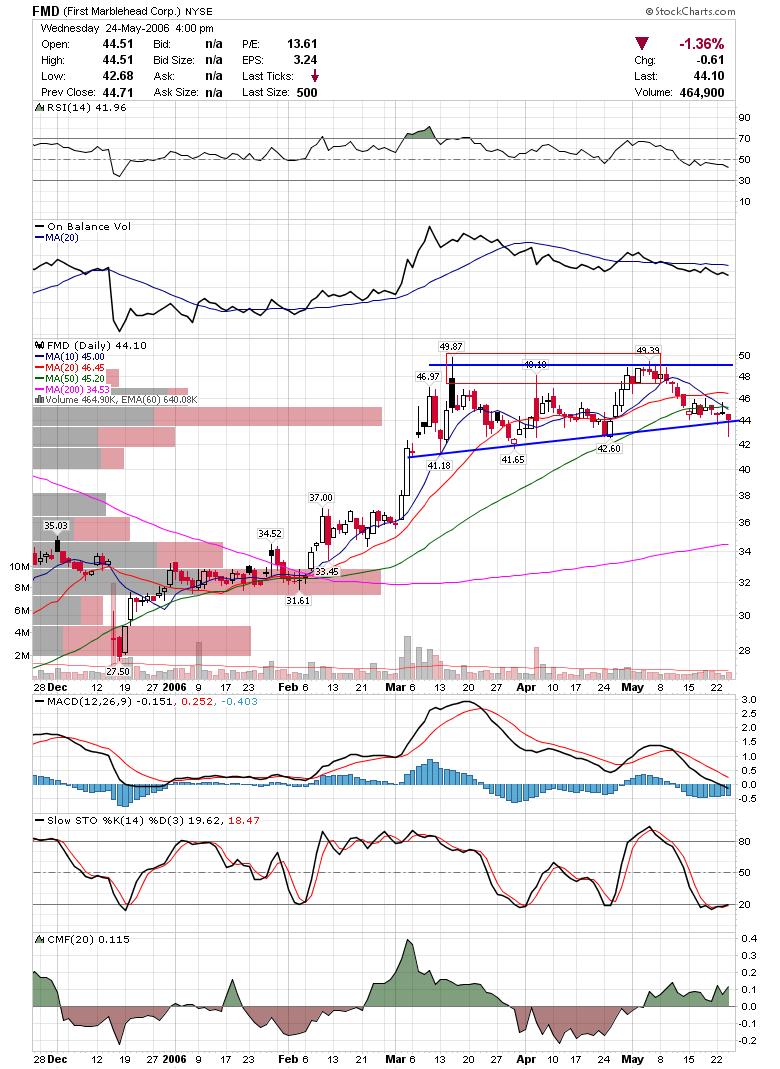
Thats it for tonight.
Good Luck,
DT
The markets pulled back sharply in the last hour as news of a possible human to human bird flu strain took front stage. While sometimes news is used as the scapegoat for price action, I think this time the markets were rattled by this development. Bird Flu stocks such as NVAX and BCRX were trading higher as well. I was a little surprised to see gold pull back as it is usually a safe haven in troubling times but the dollar strengthened as the news came out. As the dollar strengthens, commodities weaken. Here is a link saying as such.
Here are a few charts that held up well today after the pullback.
ADS was highlighted here last night and the held most of their gains today.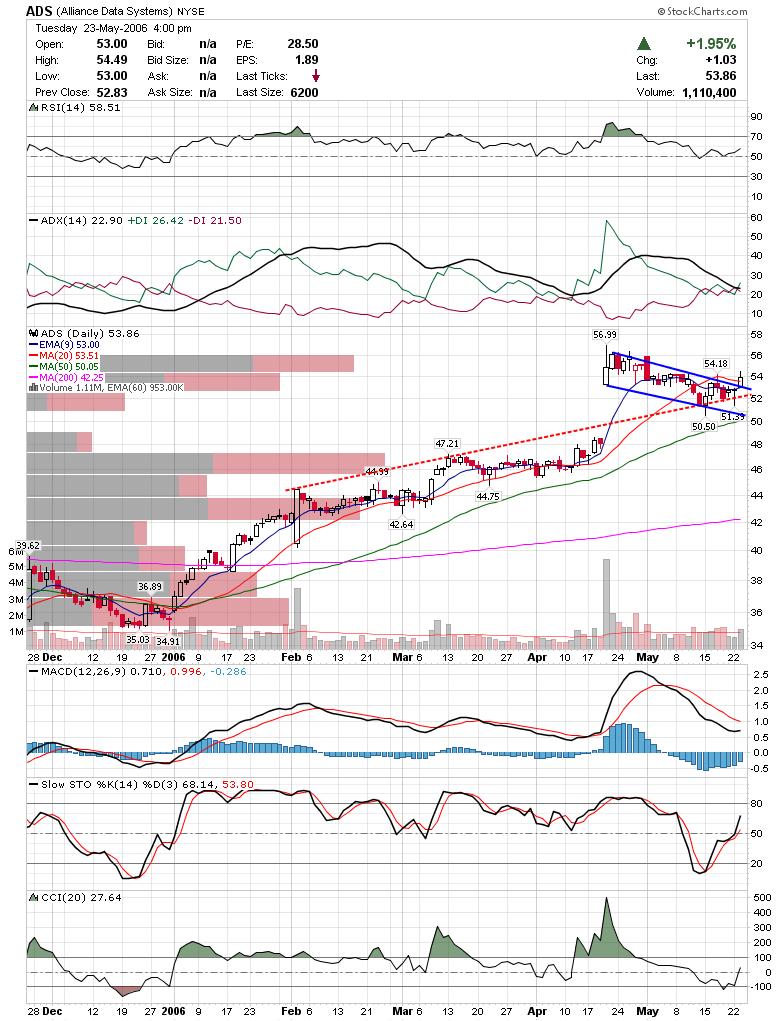 JLL took out the descending trendline on big volume. Watch for a follow through.
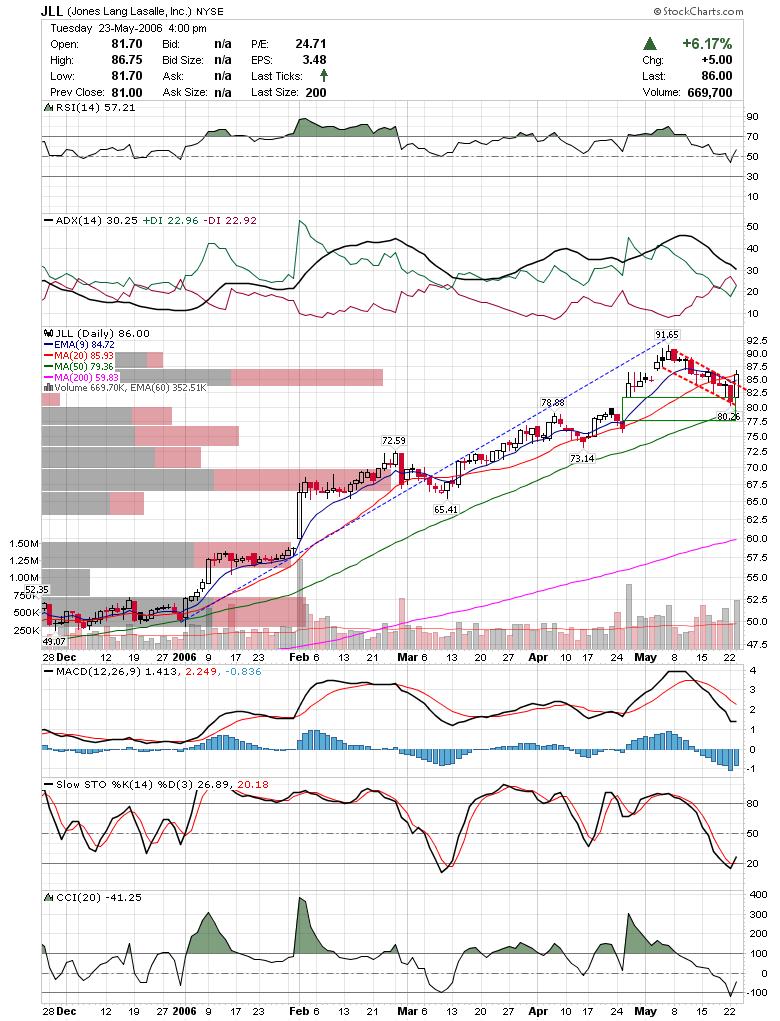 XTXI cleared a choppy flag type consolidation and managed to close above all the noise.
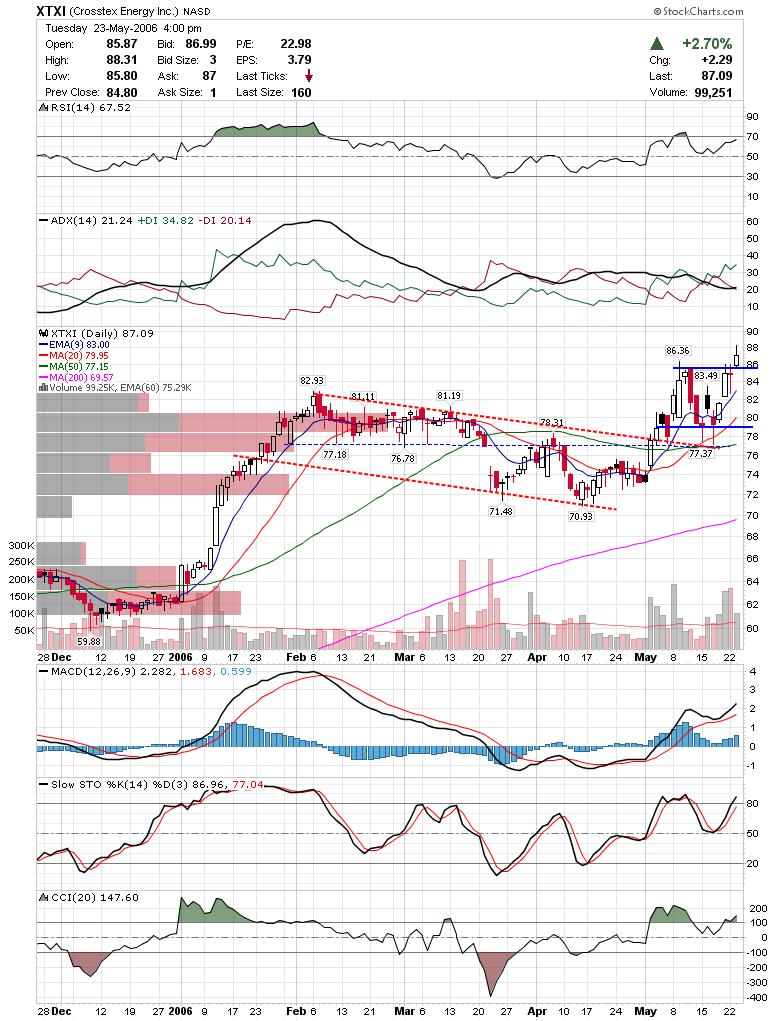
Watch to see how tomorrow closes. It is much more important then how it opens. The markets have a funny way of absorbing overeaction to news and working it's way back to where it was originally. Think about the famous Bartiromo / Bernake comments. The market sold off and ended up right back where it started a day later. I will be watching to see if the markets follow through on the selloff or if they rebound again.
Good Luck,
DT
Not sure whats going on yet, but futures are falling after hours. Also, birdflu stuff is up pretty sharply. I will post more when I know something.
DT
Missing charts from last nights post.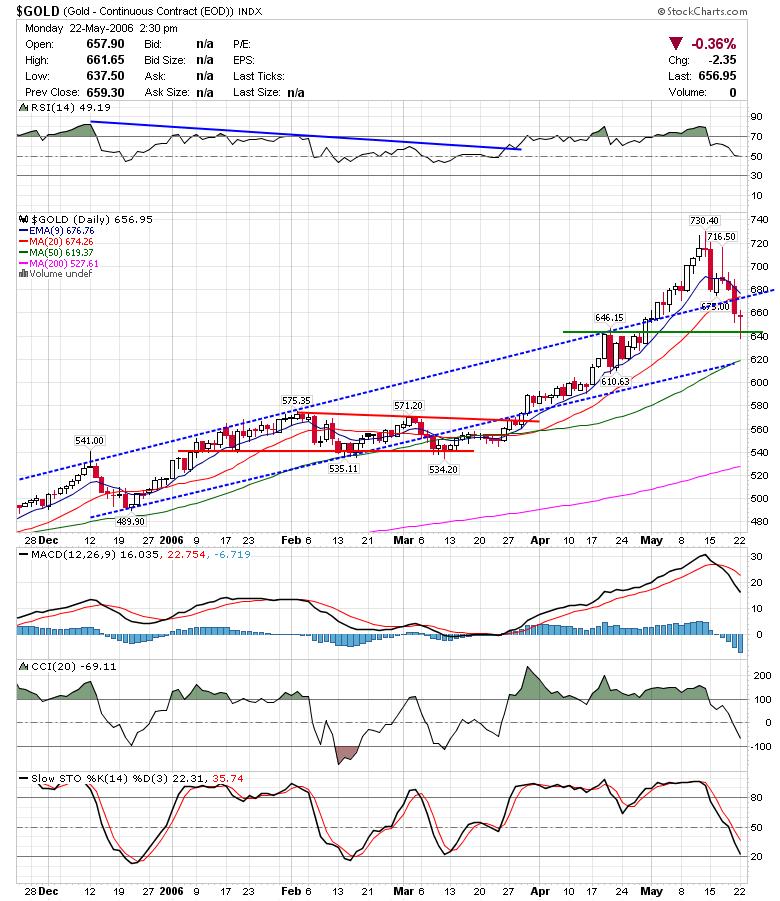


I'm having problems with blogger uploading charts so I will post the charts tomorrow. I will still discuss what I am seeing though.
There are tons of hammers on the charts tonight and actually I am seeing a lot of consecutive hammers after Fridays reversal too. Keep in mind that the smart money closes the market and we have had two consecutive "halfway decent" closes. I can't say they were bullish because we haven't taken out any resistance at all. One of the things am looking for are stocks that have yet to make a lower pivot low. A pivot low is the low of the last leg up. These are the stocks that are maintaining their uptrends and may move to new 52 week highs on the next leg up. Most of the stocks that made lower pivot lows are more then likely destined for a retrace up followed by possibly another lower low.
Some of the stocks that I found tonight meeting this criteria were ADS and EMCI.
Other stocks that look bullish to me are as follows:
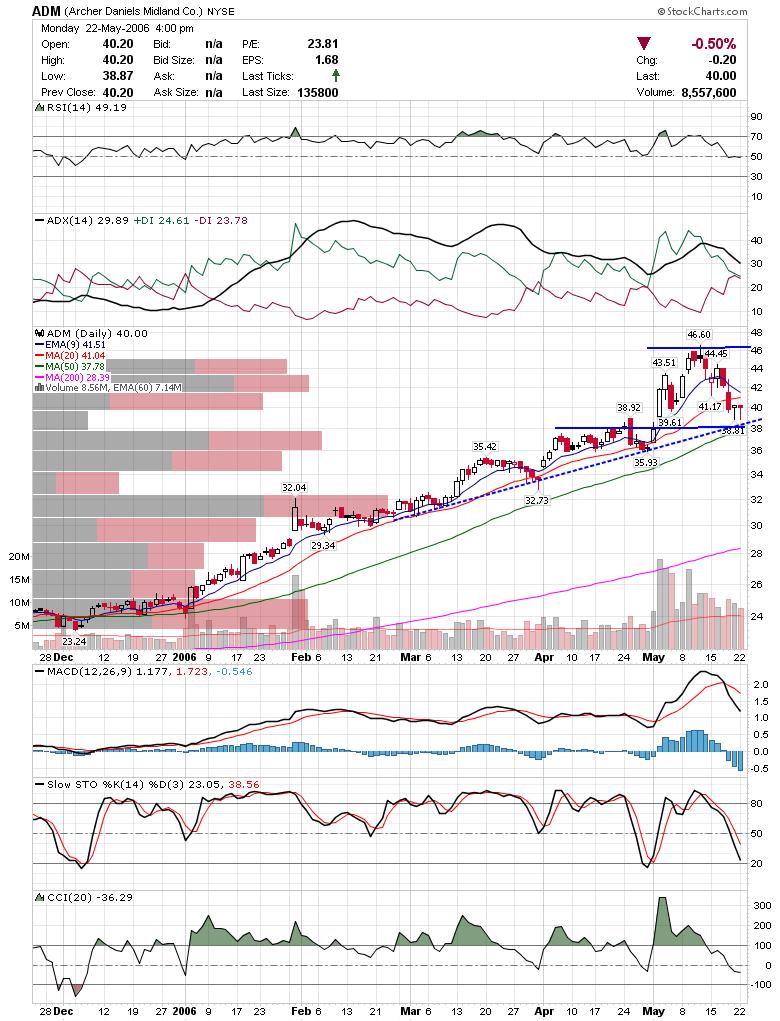
ADM: Two hammers into support. Watch for a break higher.
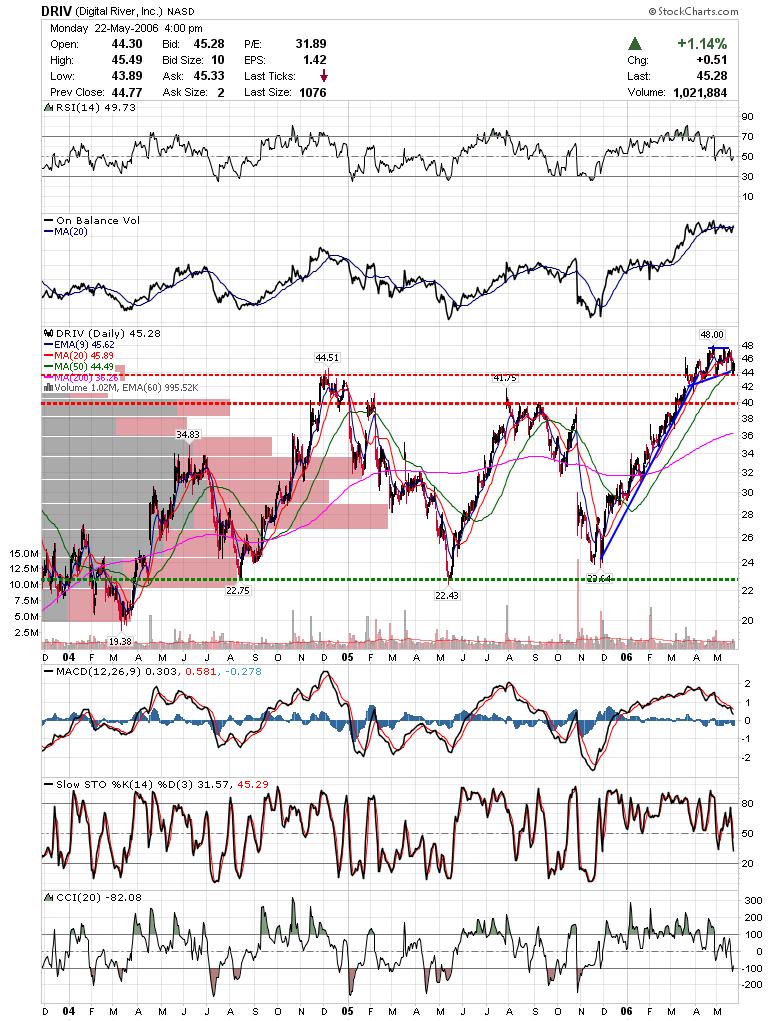
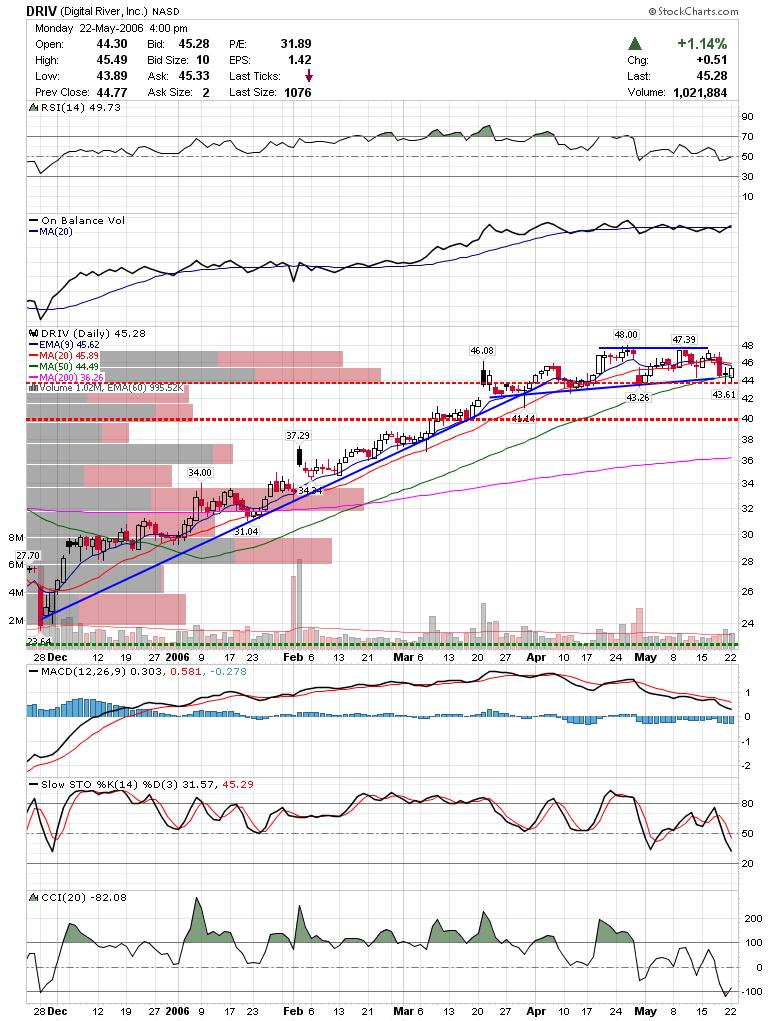
DRIV: Take a look at a 2 or 3 year chart on DRIV. Draw a line over the previous 52 week highs and notice that DRIV is consolidating above previous resistance. If DRIV breaks out of the current two month triangle the move could be outstanding.
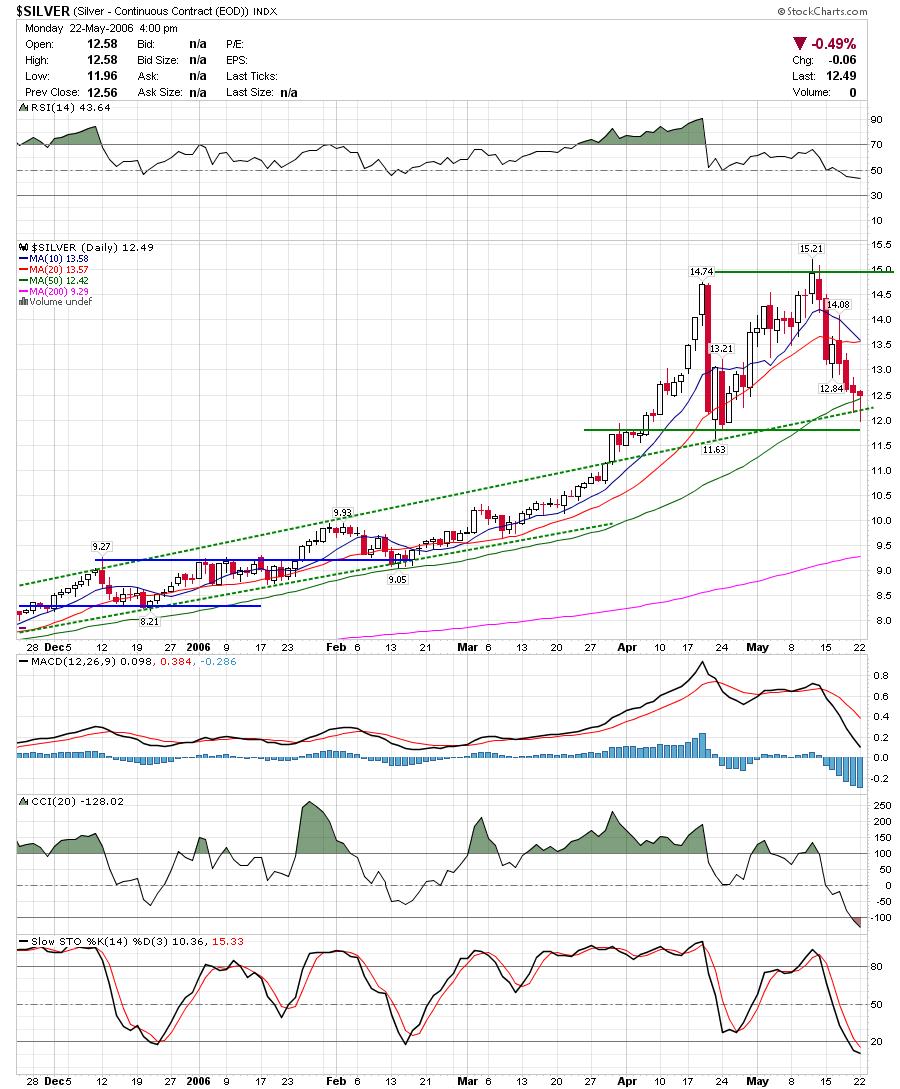
It looks like gold and metals in general are ready for a bounce up. The gold and silver charts are touching support and had long tails today closing near the highs of the day.
I am liking GLG,GG and SLW in the metals group. SLW held up better then PAAS,CDE, etc. on the recent pullback.
While I am what most would consider a pure technician, I have been a gold bull for more then just the technicals. Here is an article that a friend passed on to me that summarizes what I tried (and I'm sure failed) to explain in an earlier post on gold. The bottom line is that the increase in gold and commodities in general can be tied to the world not being fooled by currency manipulation.
Also, a reader named Jim had asked about boom after todays action. BOOM came back to test the gap as support and sucessfully held and reversed again. It looks to me like BOOM is headed up to retrace some of this leg down before coming back down to test support. It is too early to tell if it will come back to 26 but my expectation is for at least a 38.2% retrace into the 31 area. I added more today, but I will add that BOOM is in a correction and not headed to a new 52 week high anytime soon in my opinion. However, the rebound is tradeable.
I will post all the relevant charts tomorrow.
Good Luck,
DT
Here are a few interesting charts
Watch ANDE in this area as it is in danger of falling apart. MED is one of the few stocks looking to go higher lately.
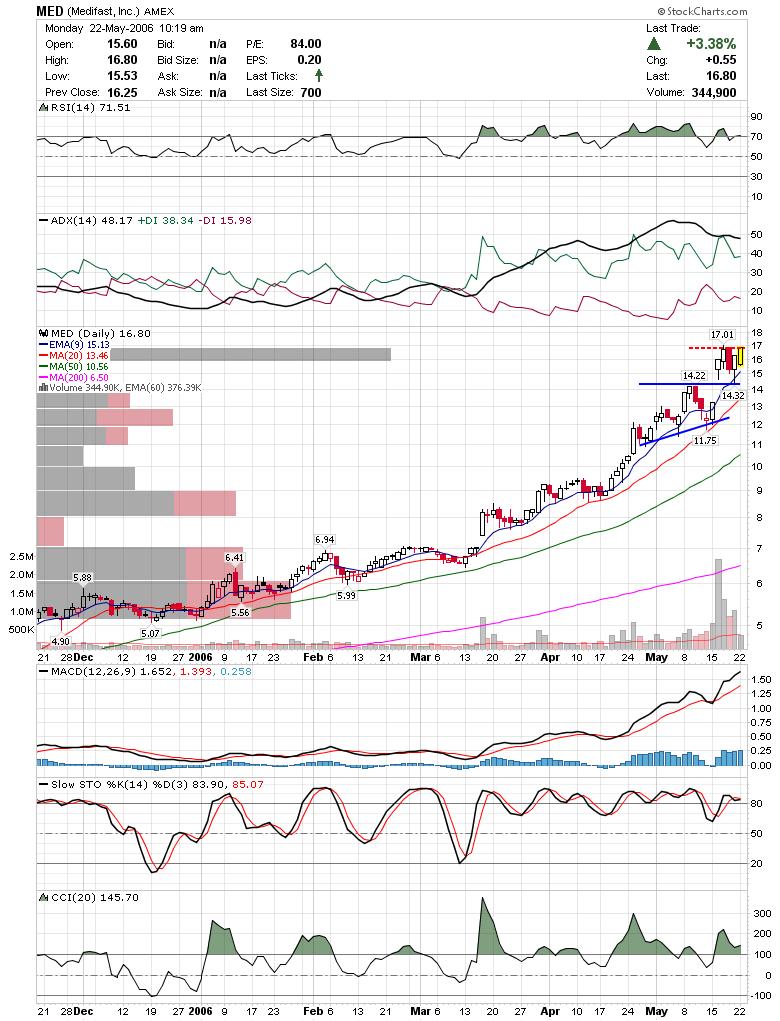 HOC broke minor support and is testing major support. Watch to see how it breaks here.
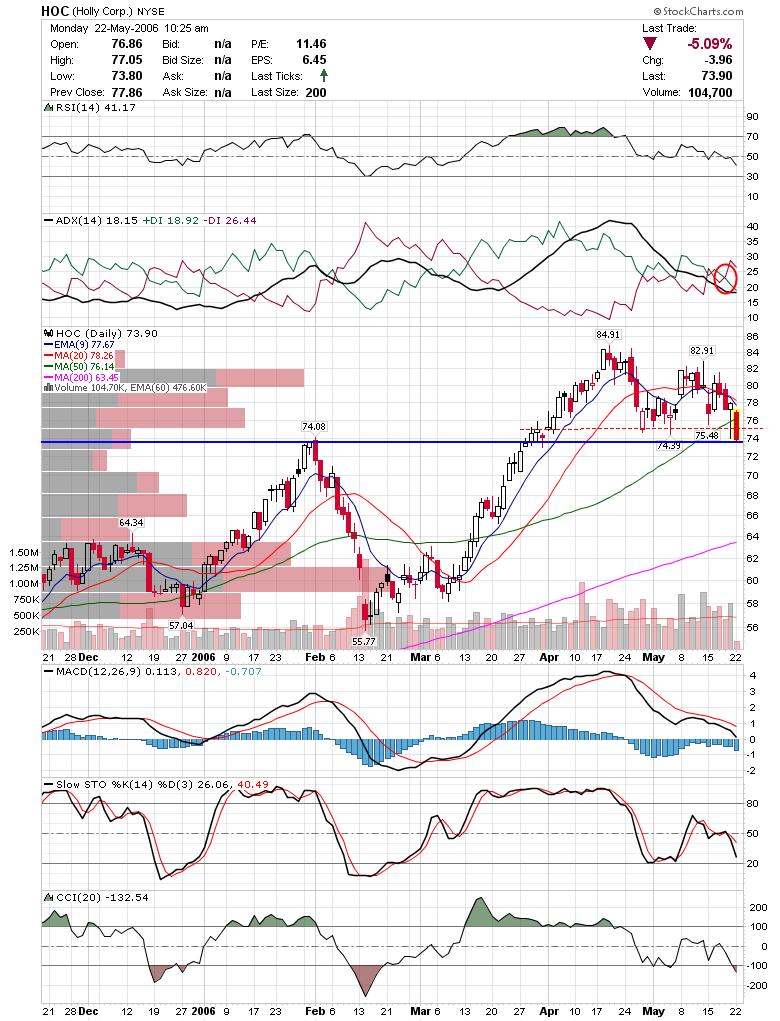 HUBG looks like it may be in trouble.
 I'll post a more thorough update tonight.
DT
I won't be home till later tonight, so I will post an update tomorrow morning. Keep an eye on gold and silver as I think we may get a little bounce this week. Good luck,
DT


