I'm having all sorts of dsl problems today so I'll keep it short. Today may of been the confirmation of the rally I've been expecting. I think we need to keep things in perspective because days like this tend to get the majority of people too excited. The major indices are all still weak with Nasdaq still below 200sma. That being said, today was a very positive day and if tomorrow holds up it would keep the sp500 monthly macd in positive territory avoiding a major sell signal.
Here are some good looking charts.
CELG tested the breakout area and had a nice move today. ADM looks like it will hold this line as support.
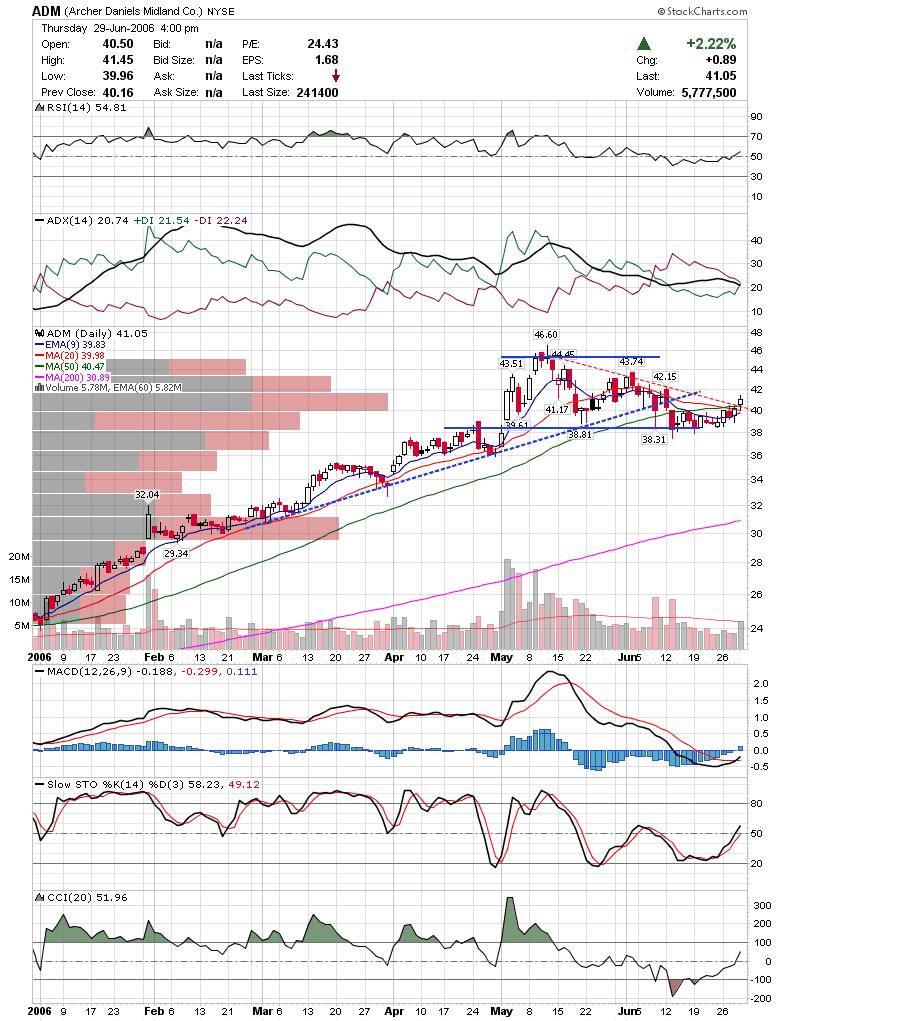 ADS may be breaking out here.
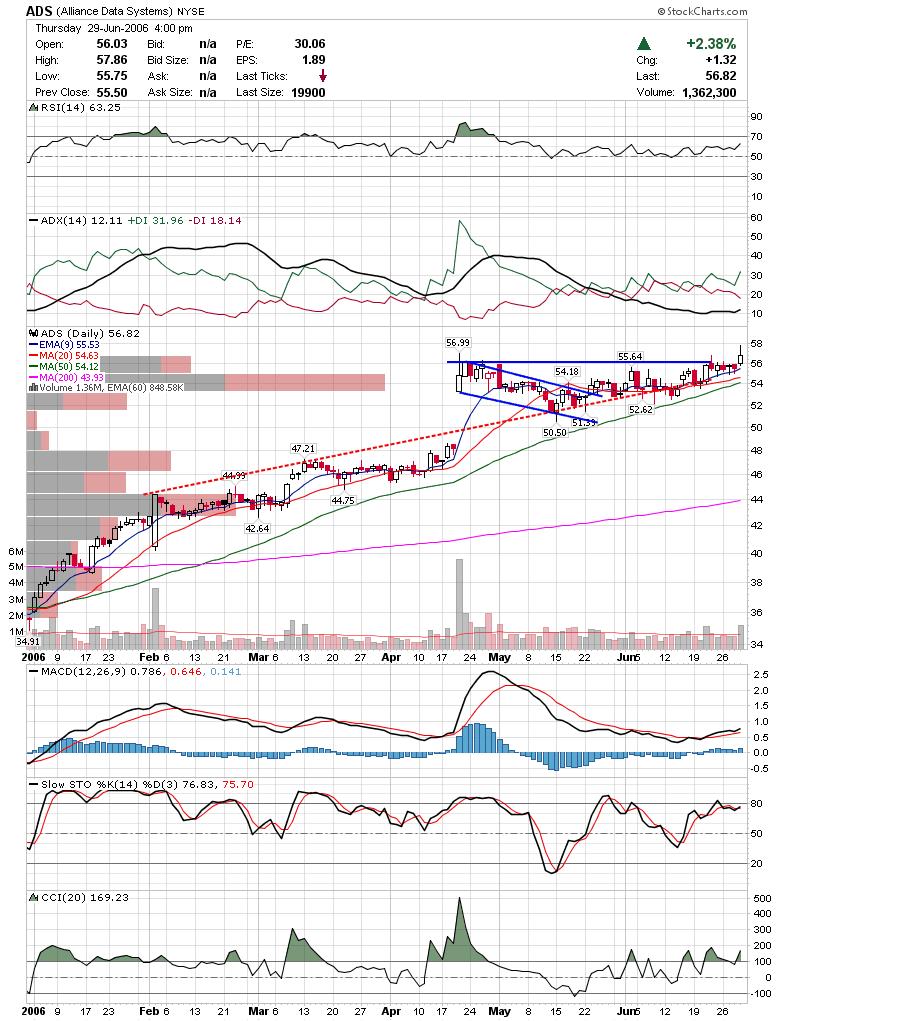 CLDN tested it's breakout and may be off to the races.
 EYE came back strong the past two days and looks good here.
 KSS looks like it will finally clear resistance here.
 NTES tested support after breaking out of this channel and had a solid move late today.
Be patient and keep in mind that there are a lot of stocks that look pretty good right now. Be selective and don't chase. If this is the beginning of a multi week rally then there will be plenty of chances to get on board.
Good Luck,
DT
Not much really happened again today as the markets have been happy to stay in the current trading range. Lately, trading typically gets light coming into the Fed meeting with lots of wild swings following the meeting minutes release. It will be interesting to see how the markets react, as it seems like everyone expects this meeting to set the tone for the market in the near term. Here are updated charts on the Nasdaq and SP500.
The Nasdaq has held this very steep channel so far and while I still don't expect it to hold the channel, there is still a farily decent chance it takes another leg down. It looks like we will at least get a retest of the recent lows. I am watching the range shown by te horizontal blue lines over the recent price action. We are in a trading range until either of those lines are taken out on a closing basis. The same goes for the SP500 chart, except that the index remains in the longer term channel while the nasdaq has remained below the channel.
The longer the indices remain under the 200 sma the more likely that we have indeed entered a bear market. Some can argue that we are in a secular Bear market following the 2000 top and that we are now at the end of the cyclical bull that started in 2002. What will be interesting to see if we indeed are headed toward extended weakness, is how the impact of so many hedge funds and program traders will be felt.
Good Luck out there,
DT
The markets were down today pretty sharply and it looks like they may retest recent lows. I think it's best to wait till either after the fed meeting, or until the recent lows are taken out, possibly at the same time. My guess though, is that we will trade higher after the meeting, but the chances are pretty good that we are in for a deeper correction. I won't recommend any trades today, rather, I will highlight who and what I read every night as I begin preparations for the next day. I don't think most beginning traders realize how much work and preparation it takes to trade succesfully. I start each night by reading the following:
John Murphy: John publishes a market message a few times per week and he generally focuses on sectors and indices. He tries to incorporate a technical analysis lesson with each of his posts, such as how he uses bollinger bands or moving averages. You can only read John Murphys analysis with a paid membership to stockcharts.com and Murphy is extra.
Ken Tower: Ken is the Chief Market Strategist at Cybertrader and he publishes a daily and weekly comment. Ken is very good too, and his daily comment tends to highlight the short term trend of the indices. I believe his analysis is only available to Cybertrader users.
Financial Sense Wrapup: Great site and I really like some of the writers such as Ike Iossif.
Investors Business Daily: I check the market review each day and I read the online version of the next day Investors Business Daily. I don't have time to read the entire paper, but I read the market review sections and scan for any interesting articles or charts.
Martin Pring: Martin Pring is another technical analysis heavyweight and he offers up some outstanding content on his site from time to time. I am thinking about subscribing to his paid newsletter. If anyone has used it I would appreciate their opinion on it.
Then I read the following blogs to get a sense of how other traders are feeling. (note: I read other blogs when I have time, but I make a point to check these out nightly)
Trader Mike: Mike has been blogging for a long time and offers very sound advice for every level of trader.
Wall St. Warrior: Jamie tends to watch similar stocks to mine and he is a very good daytrader.
Maoxian: I like keeping tabs on Maoxians notable stocks making new highs and his trading system has a lot of followers.
Tim Knight: Tim is the founder of prophet.net and he offers a bears point of view on the markets. He has a very good long time SP500 chart showing why he is a bear on tonights update.
Marketspath: Very good free newsletter. They offer up a daily market review and post charts of potential picks. I find that we overlap stocks from time to time.
Then I review all my charts. I usually review most of my charts on Sunday night and then focus on certain sectors throughout the week. I review the indices and my watchlist every night. I use stockcharts.com for storing my annotated watchlists. After narrowing down the list, I go through each chart in more detail and annotate them. Once I have annotated the charts, I upload them to blogger and work on updating my blog.
One thing you'll notice, is that I don't waste my time on public boards or forums. I am a member of a couple private boards and I read the updates via email. I find that most of the posts on public boards are pure trash and not worth the time. Another thing worth mentioning, is I don't read all the above looking for stockpicks, I read them for the commentary and their interpretation of the markets action. I have plenty of picks from my watchlists and Trade-Ideas. I also try to focus on sites that focus on concepts or ideas that enhance my trading strategy and timeframes.
While I'm not saying that everyone should read what I read, I think every trader should try and establish a nightly routine for being in synch with the markets.
Good Luck,
DT
Since the markets aren't doing anything I decided to show why I use weekly charts even though I am a short term trader. A lot of beginners assume that they only need to look at the time frame they are trading however, it is very important to check out several different timeframes to try and determine possible support and resistance areas. I like to use the daily and weekly charts to determine what stock to play and then use the 5,15, and 60 minute charts for fine tuning my entries and exits.
Here is XPRSA which I took near 24. This still looks pretty good on the daily chart with volume expanding as it moves higher. However, it is sitting pretty much at my target which isn't apparent anywhere on this chart, unless you measure the triangle breakout (which also yields a target near 27).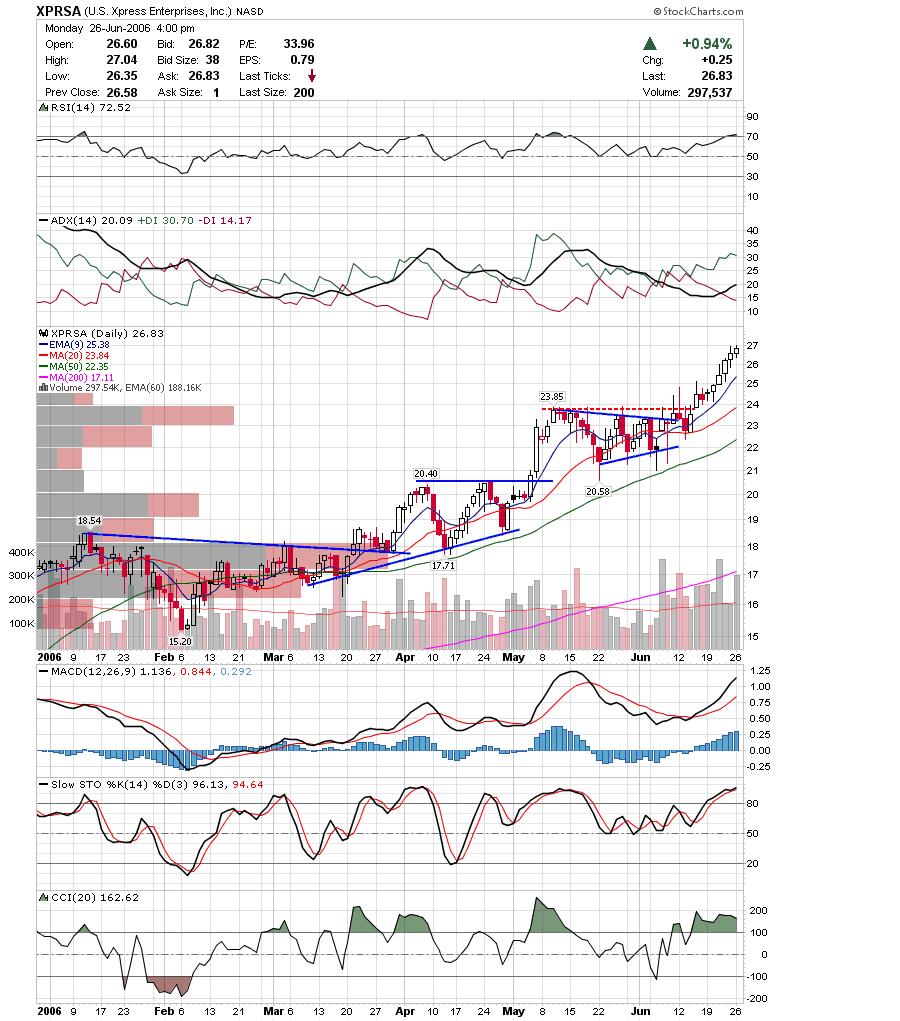 Taking a look at the weekly chart you can notice a resistance area that begins at 27. There is no guarantee that it will stop at 27 on the dot, but this is a logical place to tighten up on my stop. It is very doubtful that it will zoom past the resistance area altogether, so the risk /reward diminishes each move higher.
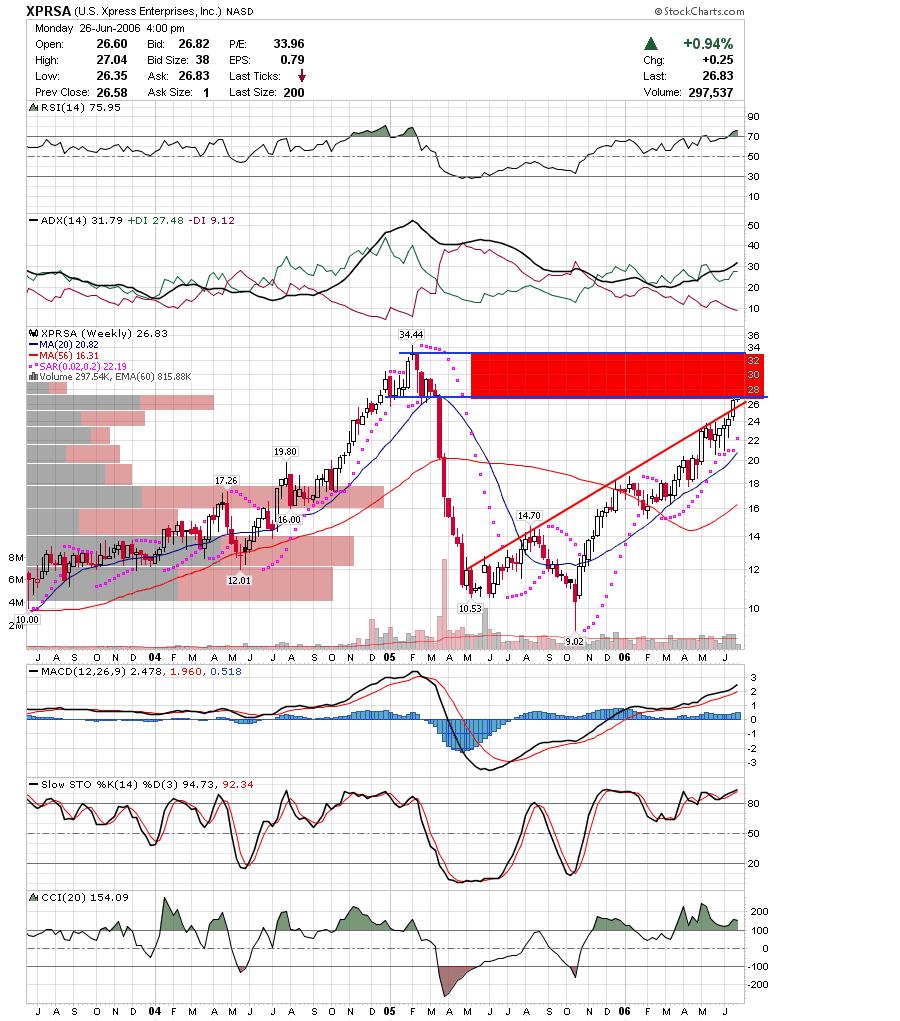 Here is another example. I added to OMNI today on a test of the breakout area. While this is a risky move in the sense that the stock was falling, I felt comfortable with the risk I was taking vs the potential reward. Flag breakouts offer some of the best moves and OMNI has already cleared substantial resistance.
 Here is the weekly chart which shows OMNI trading over significant resistance. OMNI looks to be accelerating the trend since it moved over the ascending trendline. Most of the time these accelerated moves can't be sustained, but I could care less since I am trading this for a short move.
I monitor 15 min, 60 min, daily, weekly and monthly of the major indices as well. I think that anyone trading short term should be aware of what trend is persistent in all of those time frames.
Good Luck and trade carefully as we are in a dangerous place yet again,
DT
With the Fed meeting coming up, the markets may not move meaningfully in either direction. If we get a sharp move one way or the other, I would expect a reversal of that move after the fed meeting. Since we have worked off some of the extremely oversold indicator readings, it makes sense that we will get a retest of the recent lows soon. Lot's of charts tonight, so I'll get right to it.
Long Charts
OMNI just cleared a bull flag chart pattern. EYE traded to a new 52 week high and while it's a little extended on the daily chart, the weekly chart looks pretty good.
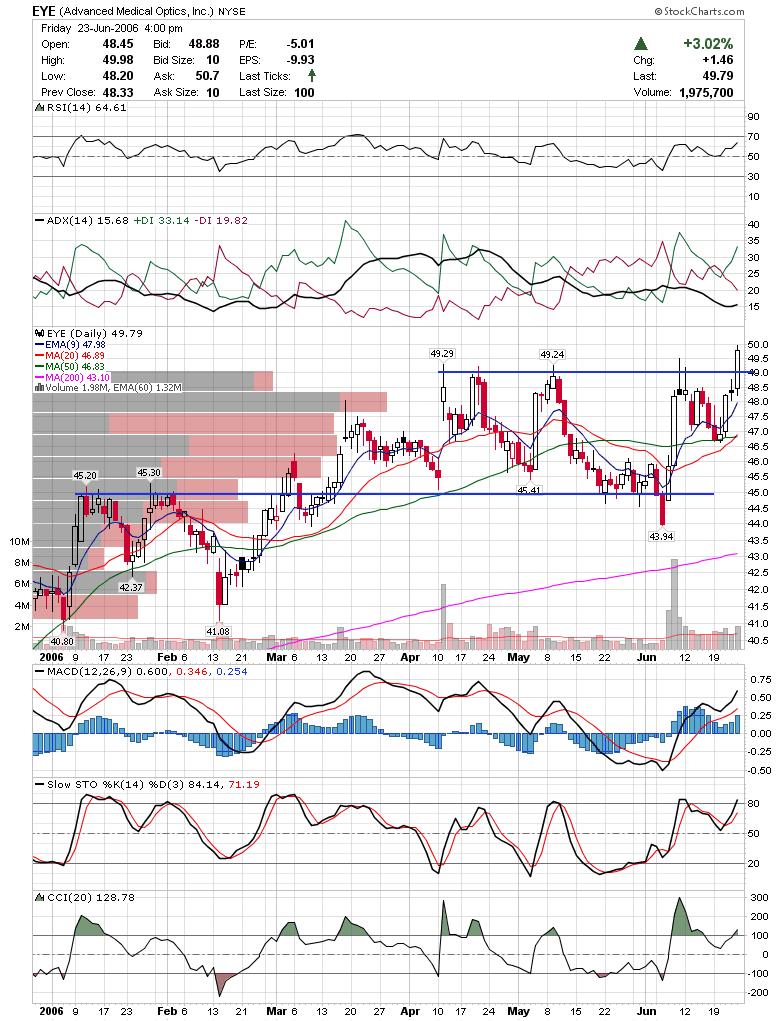 Looks like BLS confirmed support at the breakout area.
 CHH cleared a downtrend channel Friday.
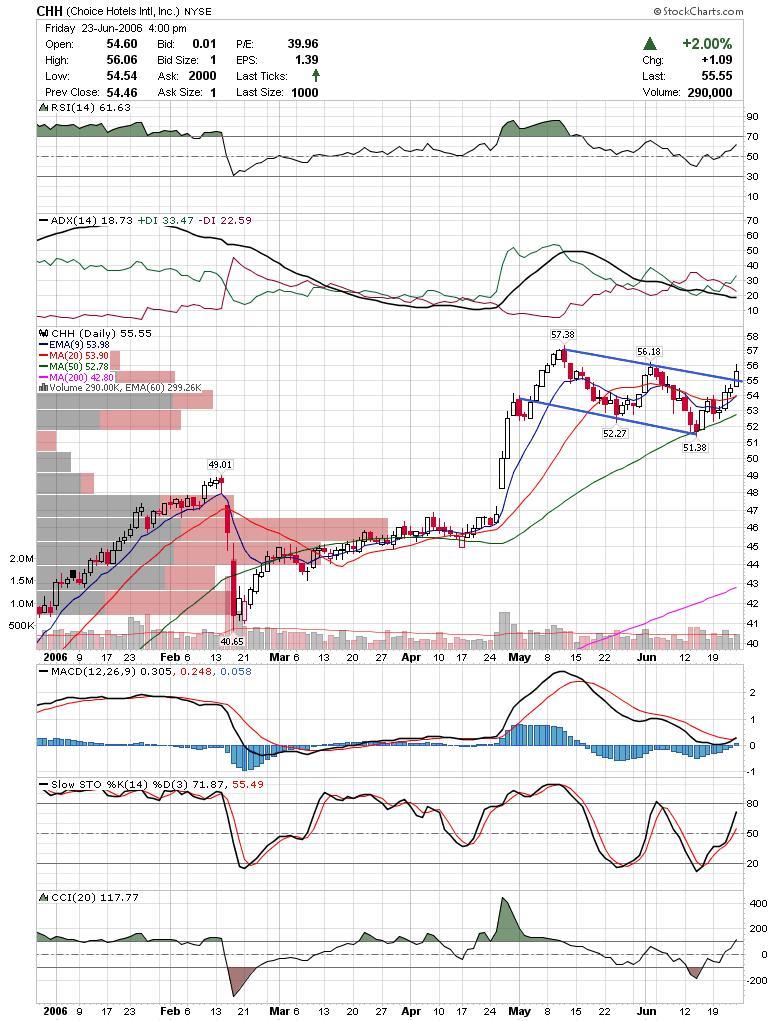 CLDN is close to breaking resistance and volume is confirming the move.
 ENS is clearly extended, but if it clears this pennant it could have a nice quick move.
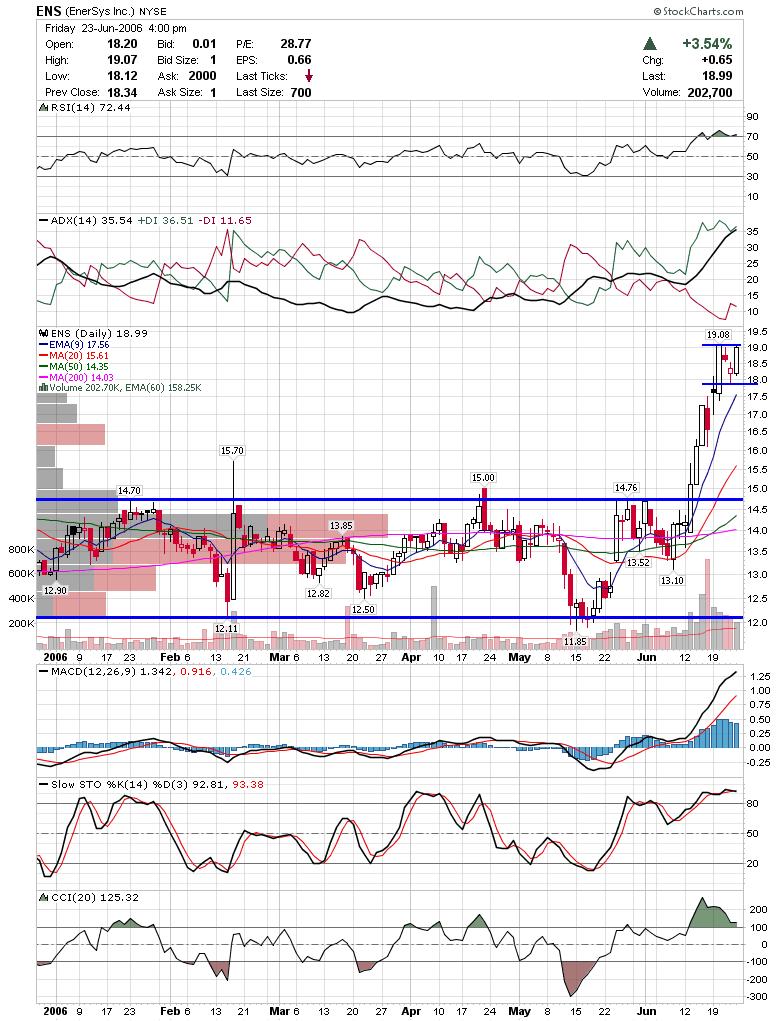 FORM is looking like it might clear the downtrend channel here.
 JCP looks a little tired but it has stayed overbought for long stretches before.
 KSS has been trading a very tight range for a few days right up at resistance. If it clears resistance the move may be powerful.
 OII is testing resistance here.
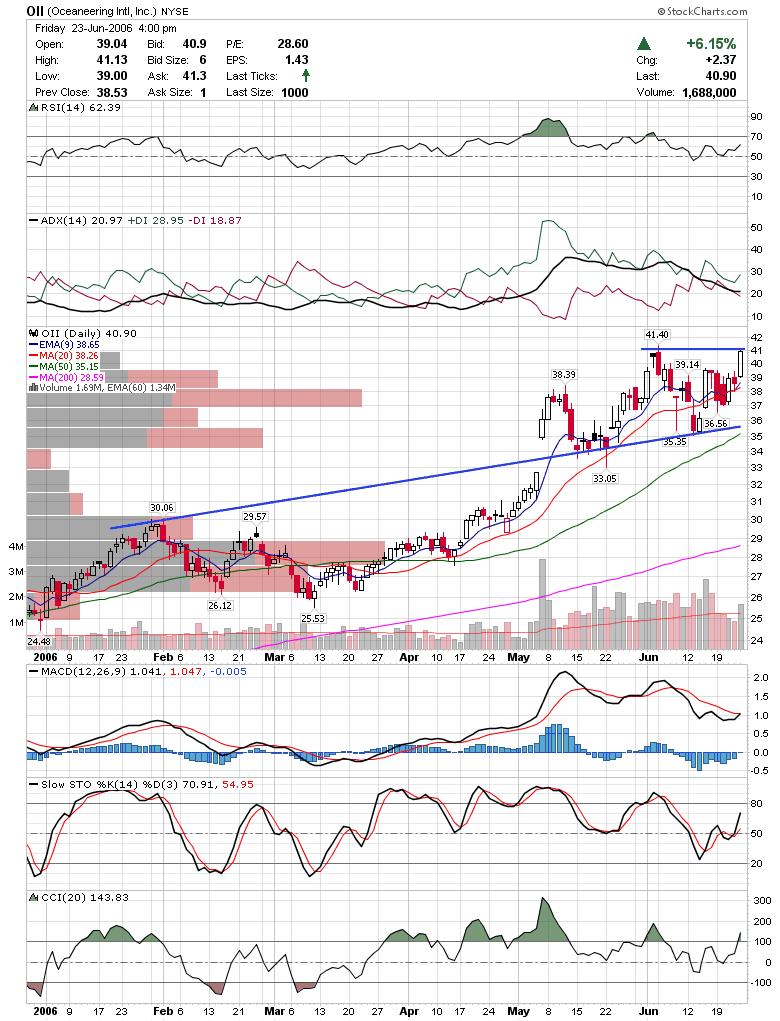 XTXI looks like it wants to test the resistance line above.
 NTES took it's sweet time trying to fill the previous breakaway gap and still left a portion unfilled. This is bullish as buyers stepped in and now it is trying to clear the pullback channel.
 Some Short Charts
ABAX is up to a fib retrace level and is overbought. May be ready to pull back down.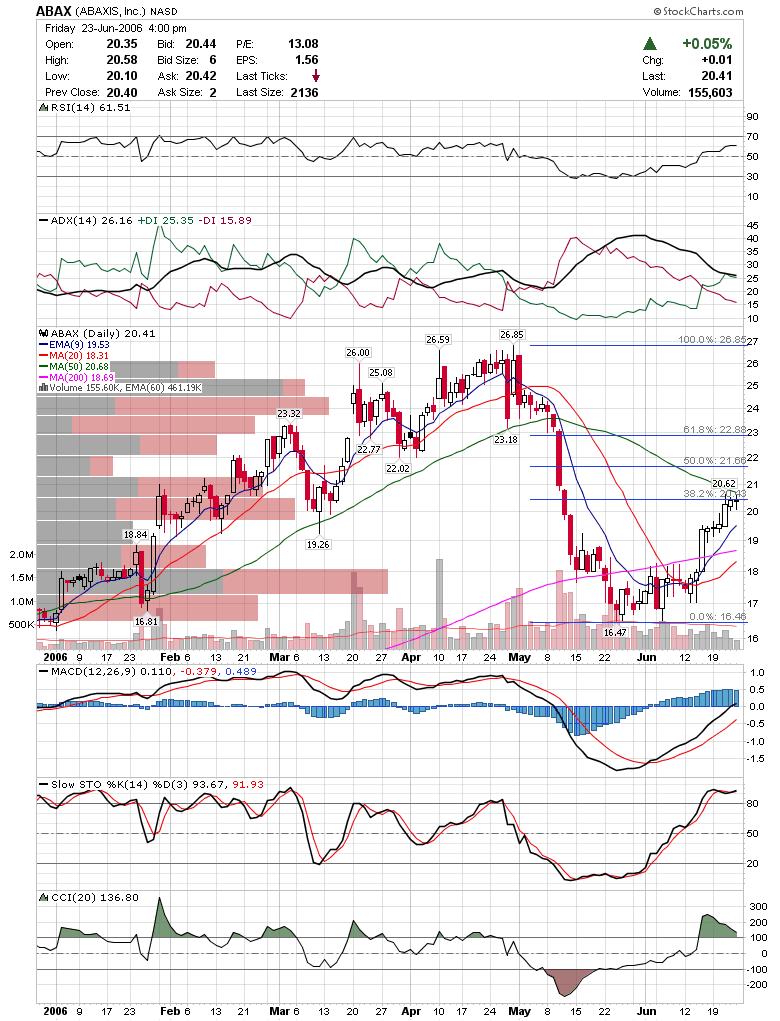 AMX looks like it is trading a nice little bear pennant / wedge up to resistance.
GFIG is still up against resistance.
Thats it for tonight.
Good Luck,
DT


