Tomorrow is expirations day and as such I will be taking the day off. Here are a couple of charts to check out if oil continues to break down. If commodities are indeed peaking for now, it could signal that the economy is in for a downturn. In that scenario, industrial and commodity type stocks could be headed for major trouble.
EOG looks like it has already peaked and is back below the neckline of a large head and shoulders.
I need to give credit for EOG to Trader Tim who mentioned it tonight.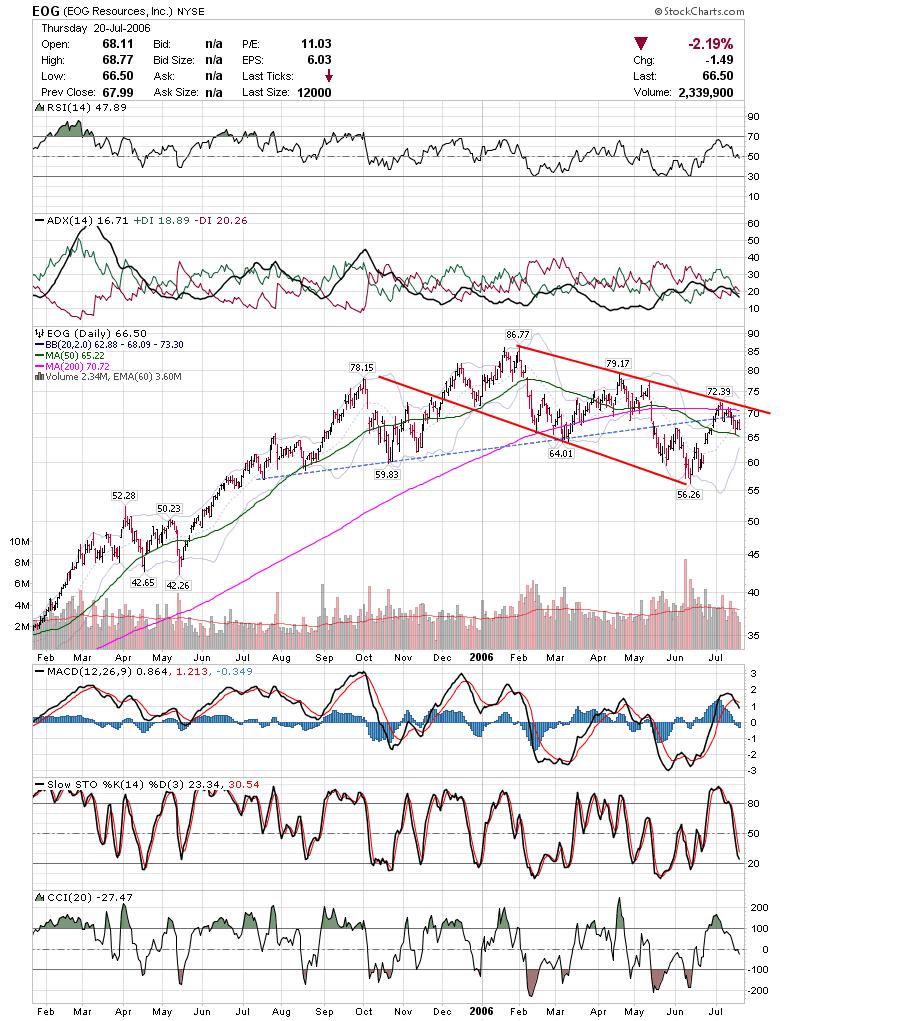 Here is a closer look using candles.
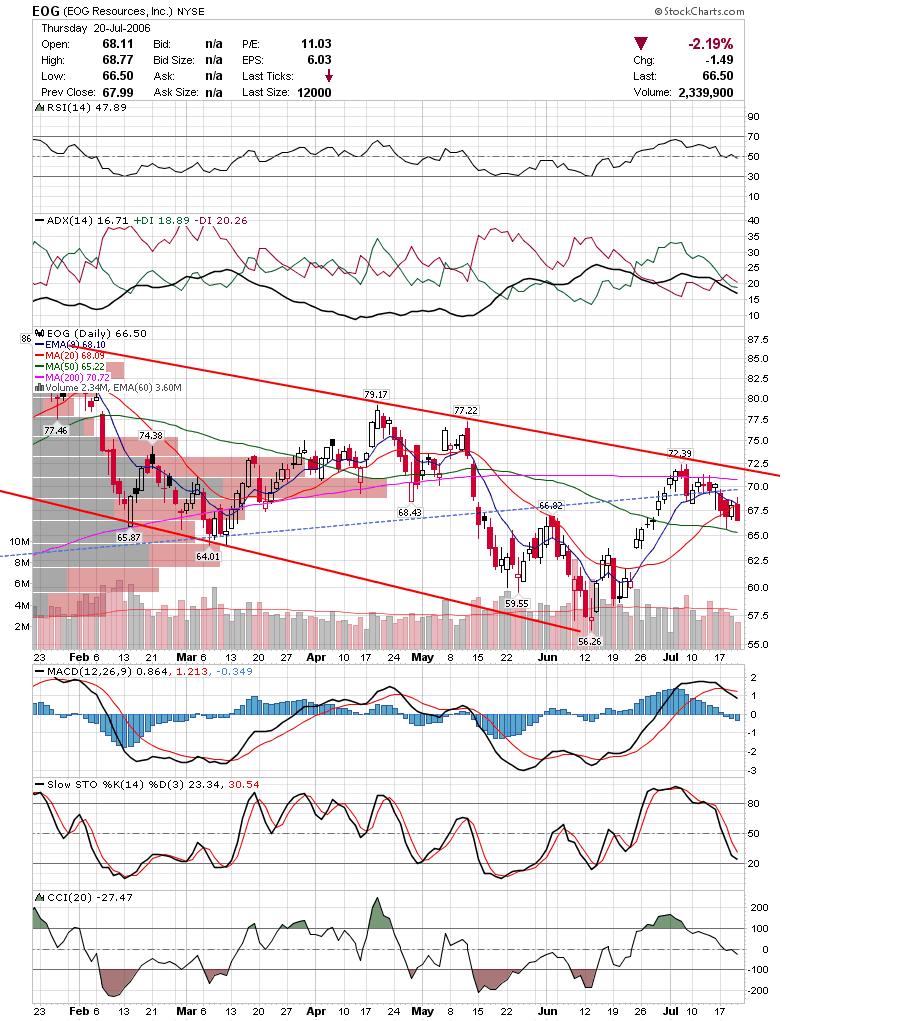 VLO may also be topping here after making a lower high.
Trade carefully as tomorrow could be a choppy rangebound day.
DT
Very strong move today coming from a combination of things. The indices have been oversold and any time there is a mention of stopping the rate hikes, the shorts scramble to cover. I believe if the fed does pause it will ignite a decent rally, but it won't hold up because the underlying reason for stopping hikes would be due to a slowing economy. This will eventually show up in corporate earnings. Keep in mind the past three 100+ point days got the indices nowhere. Todays rally as impressive as it was, really only took the indices to some declining sma's. That being said, this rally should last a few more days. I mentioned earlier this week and last week that I would be focusing on longs and there have been some good moves on stocks I've mentioned (such as BIDU,CSH,IBCA,MED,VOL,etc.). Now is the time to start locking some profits in as there are no gaurantees that any of these moves will last.
Here are a few charts that look promising.
ANDE may try and clear resistance here. They made a higher low and if they can clear the downtrendline, they should make the higher pivot high.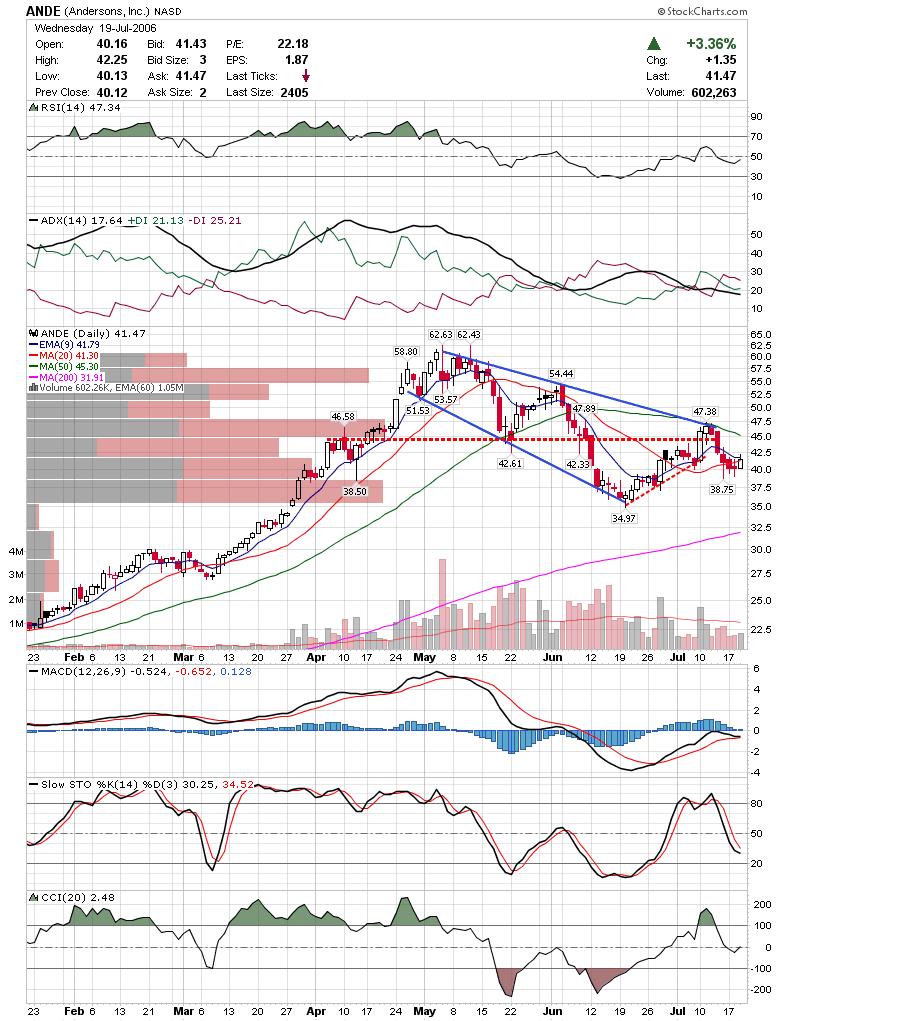 CRDN is bouncing off the 200sma.
 JCOM looks to be stabilizing at the 50sma and trendline.
 I have a bit of a quandary with HAL. They have broken down here and present a nice shorting opportunity anywhere near 35, but they report earnings on Friday. I hate holding stocks over earnings, but this looks like a nice chart.
 The following are some utilities which should remain one of the stronger sectors for the near future.
FE cleared a nice base today. I would look to any retest of the breakout for an entry.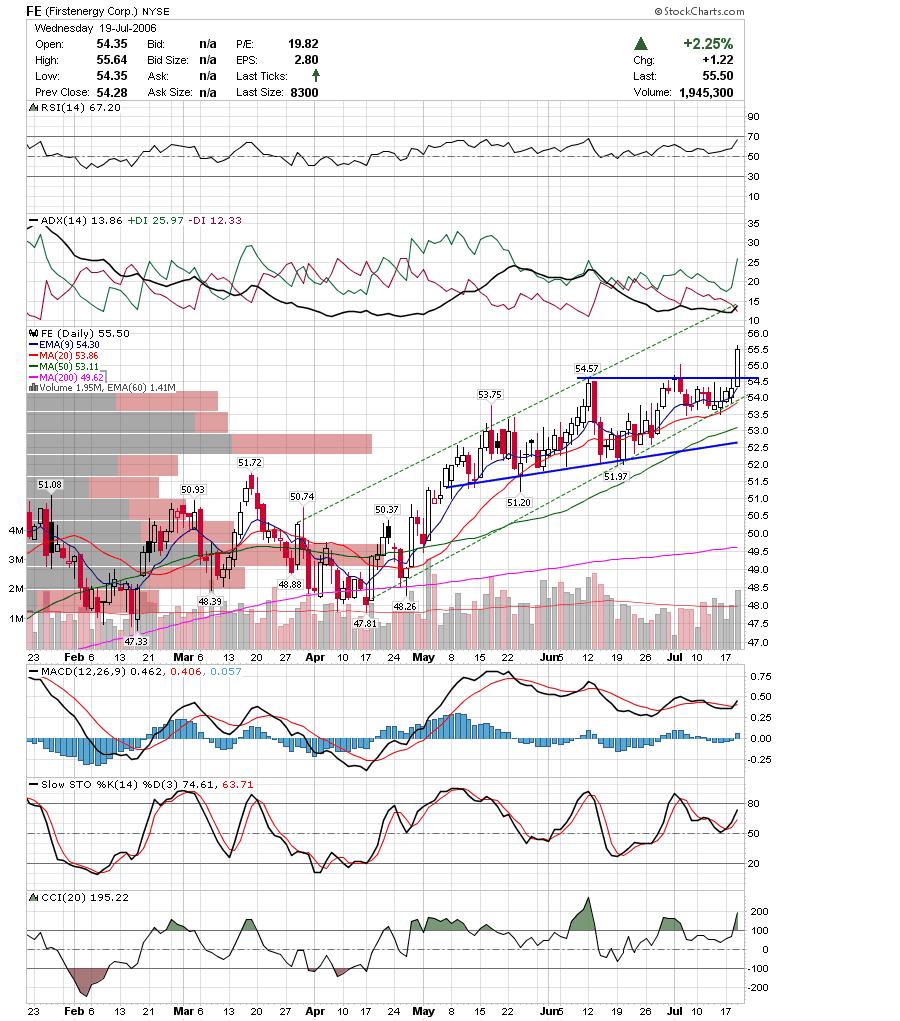 TXU looks like they are accelerating their uptrend here.
 AES may be clearing a bull flag here although it may be a little early.
 AVA chart looks similar to TXU with an accelerating move higher. I would probably wait on this one as it is moving higher above the 9ema.
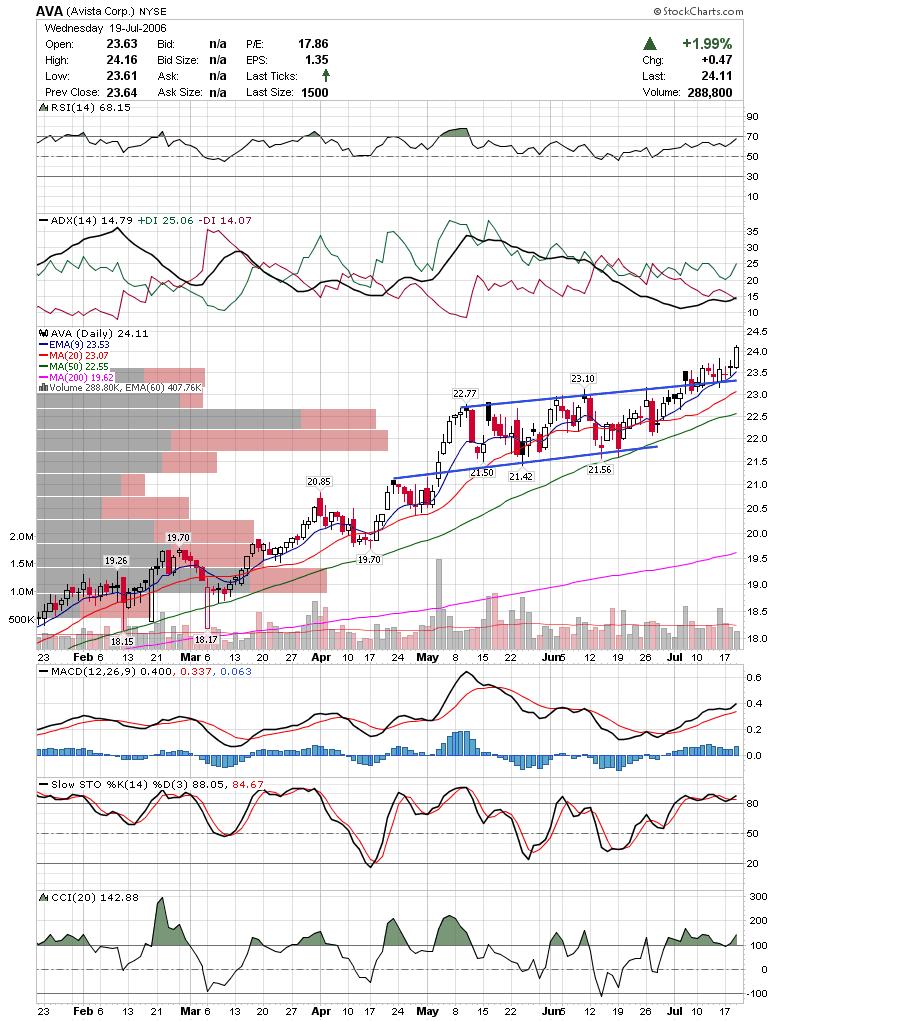
Tomorrow should be interesting to see if the markets get any sort of follow through. Apple was trading 10% higher after hours so keep an eye on sympathy plays such as MRVL. Also, EBAY and MOT were looking good. QCOM and CTXS were getting hammered when I last checked.
One additional thing to mention. Keep in mind that options will expire on Friday and some of the games will begin or have already begun. Also, keep an eye on earnings releases for any stock you may play.
Good Luck,
DT
The Nasdaq actually breached the October lows today but managed to reverse by the end of day. I would wager to say that if todays low is breached in the next few days then it will be the start of a nasty downturn.
Here is a chart of the Nasdaq showing positive divirgences on RSI and MACD. A rally to the declining sma's would not damage the bearish charts and would alleviate some of the oversold conditions. Here is a chart of the SP500. Nice candle today confirming support. This level was confirmed as support on the last downturn, so it makes the candle more significant. While I'm not crazy enough to call it, it looks like there is a possibility that the SP500 could form a reverse head and shoulders as marked on the chart. This would be an interesting development if the pattern came to fruition as the short covering would be frenzied (maybe fed pause ;).
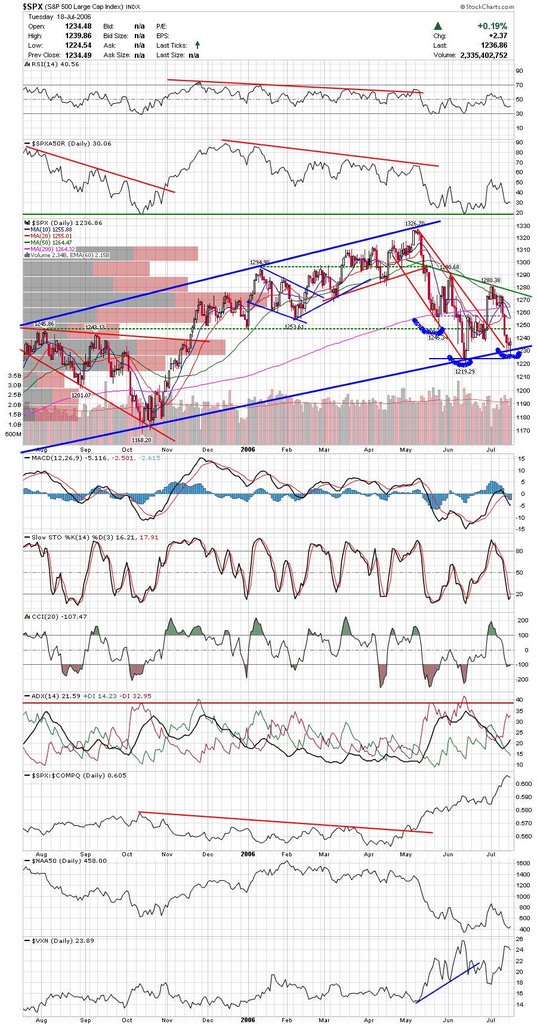 Here is a chart of the very oversold $sox. May get a bounce here on a previous trendline. I couldn't find any charts of semi's I liked, so if anyone has suggestions feel free to leave a comment.
 Here is a chart of MED continuing to drift towards the 50sma. They had a decent day today and could follow through tomorrow.
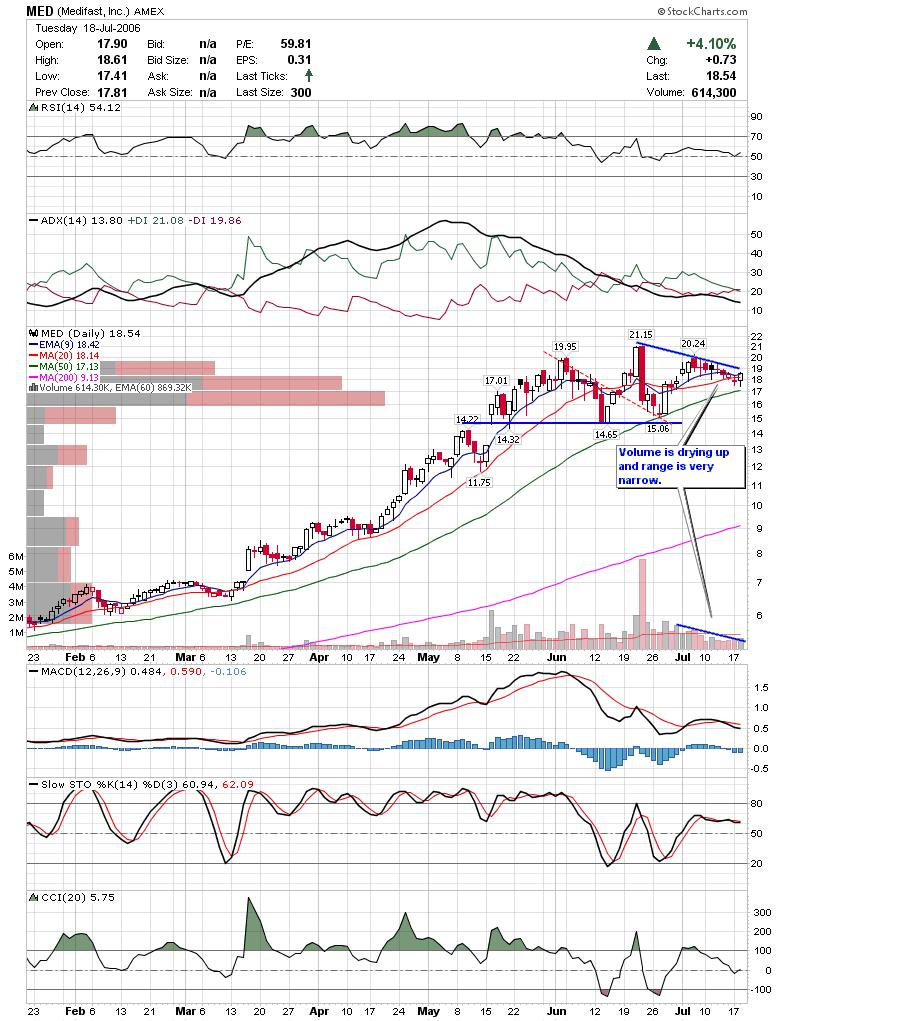 BWP may get a bounce off the trendline here which could turn into a triangle breakout. I don't care for low volume stocks, but this one trades well.
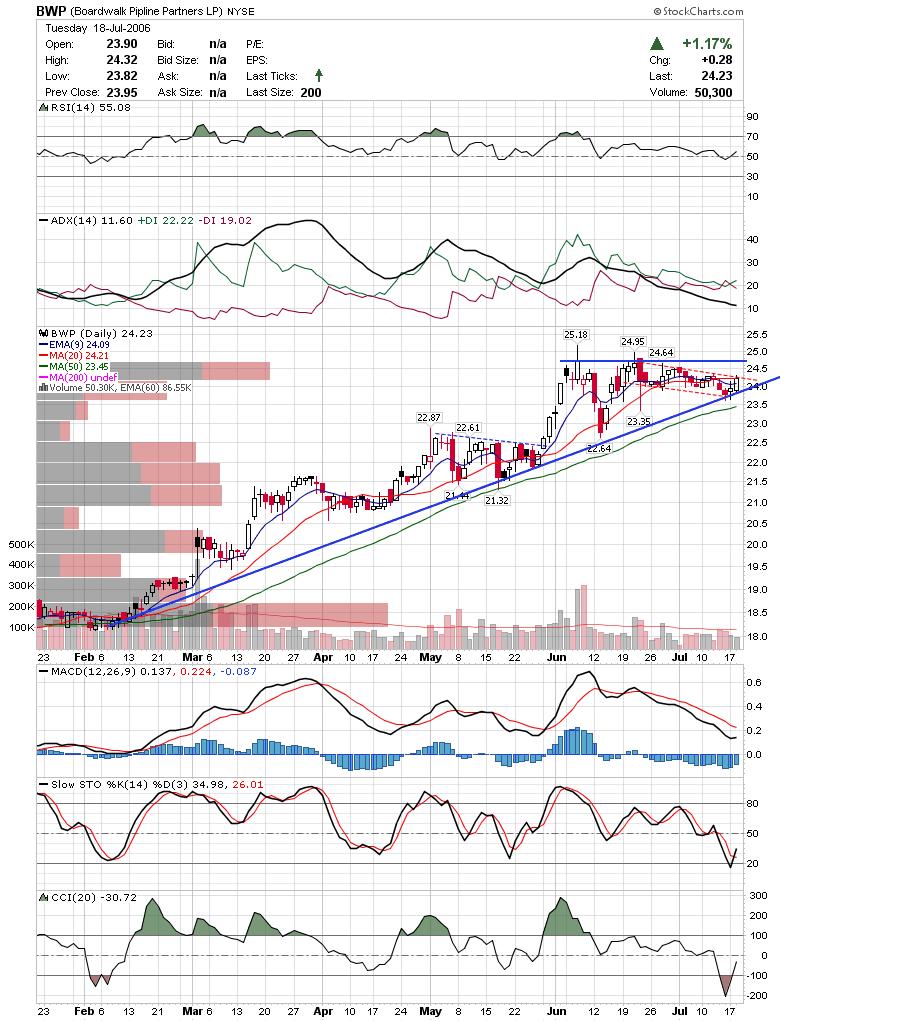 ODFL pulled back to the 50sma and could find support here.
 Here is an updated chart on CSH which was highlighted earlier this week. This looks like a solid breakout.
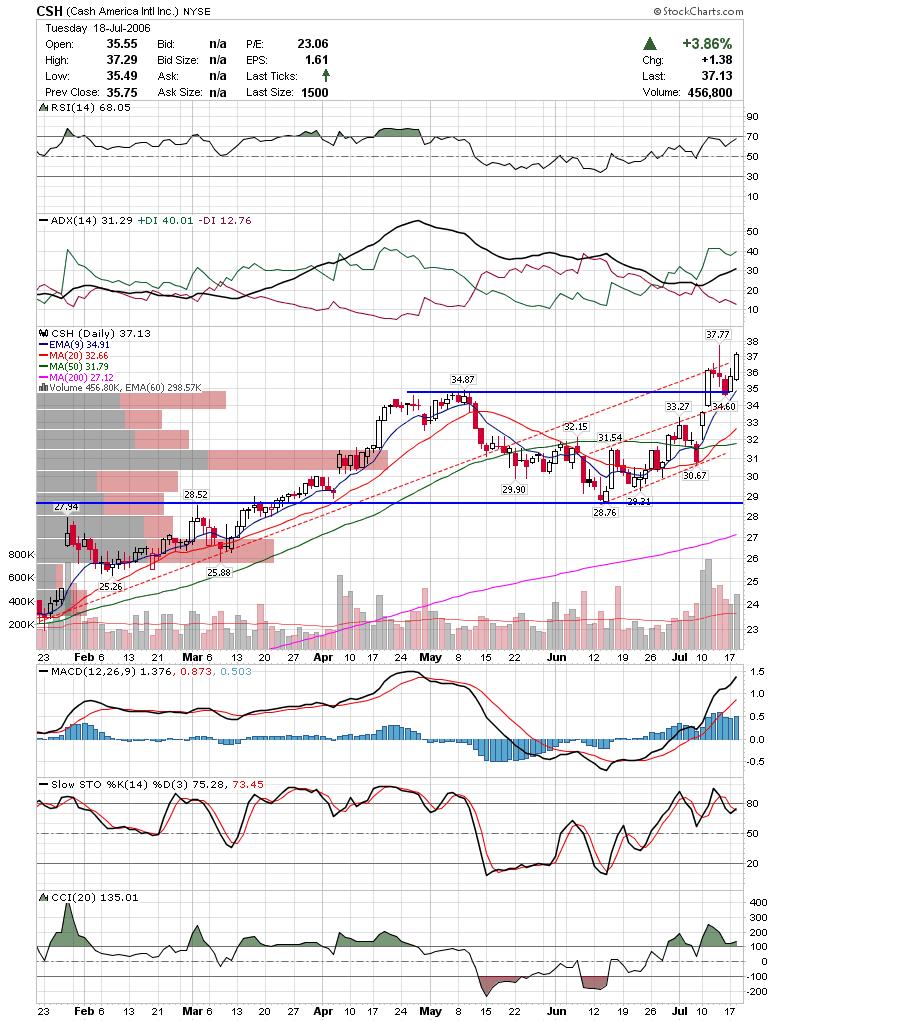 NTRI came back to test support and had a bullish engulfing pattern today. They could be headed for a test of the 52week high if they can clear the small cup and handle base from the past month and a half.
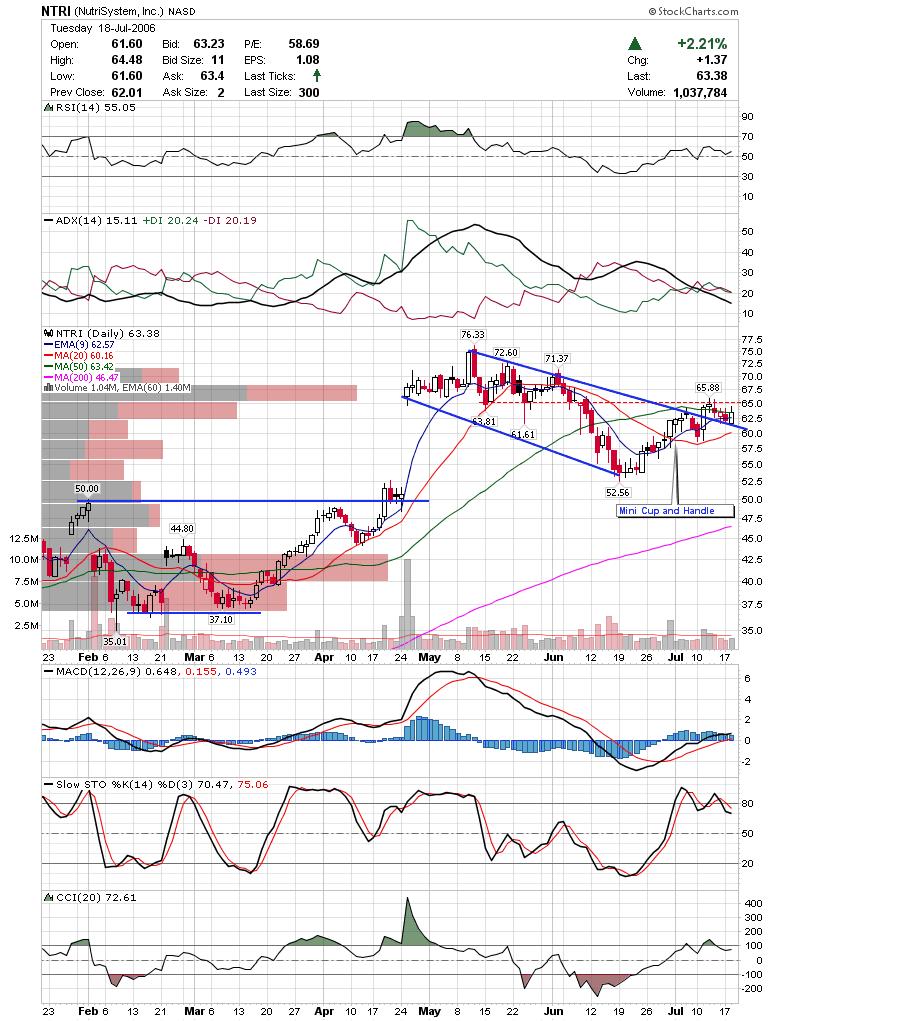
Good Luck,
DT
Oil closed lower today inspite of all the turmoil in the Mid East. There are some interesting patterns developing on the Oil Charts showing a possible top nearby. Although it looks like there will be some weakness near term, keep in mind that Energy and Energy related stocks have been the strongest sector and remain comfortably in long term uptrends.
Here is a chart of the Oil contract. An evening star candle pattern formed today which is a reversal pattern. A common misconception is to interpret candle reversal patterns as signals that the trend will actually reverse to the opposite trend. In practice, it is far more common that the trend will pause and then either continue or reverse. I would look at this pattern to suggest that oil will pullback or consolidate. One possible target is to the previous trendline breakout area highlighted by the blue arrow below. Keeping in mind that Oil just broke to new highs, it is interesting to note that the Oil Services ETF OIH, failed to make a higher pivot high along with the commodity. In fact, it looks like it is tracing a possible head and shoulders top. It is too early to determine if the pattern will complete, but it sure looks like it will at least test the neckline.
 Here is a chart of the XLE Energy Select spdr. Note the same possible Head and Shoulders top along with a lower high and lower low. What is interesting to note is that I don't believe that it is normal for commodities to top so close to stocks. This poses lot's of different scenarios depending on how this plays out.
 There are some interesting charts in the energy sector with possible short setups although at this point I would take the charts above more as a warning to protect profits or to wait on initiating new positions in the sector.
Here are a couple of charts on individual stocks.
Here is a chart of LVS pulling back to a rising trendline. If the market cooperates, this could be a decent entry.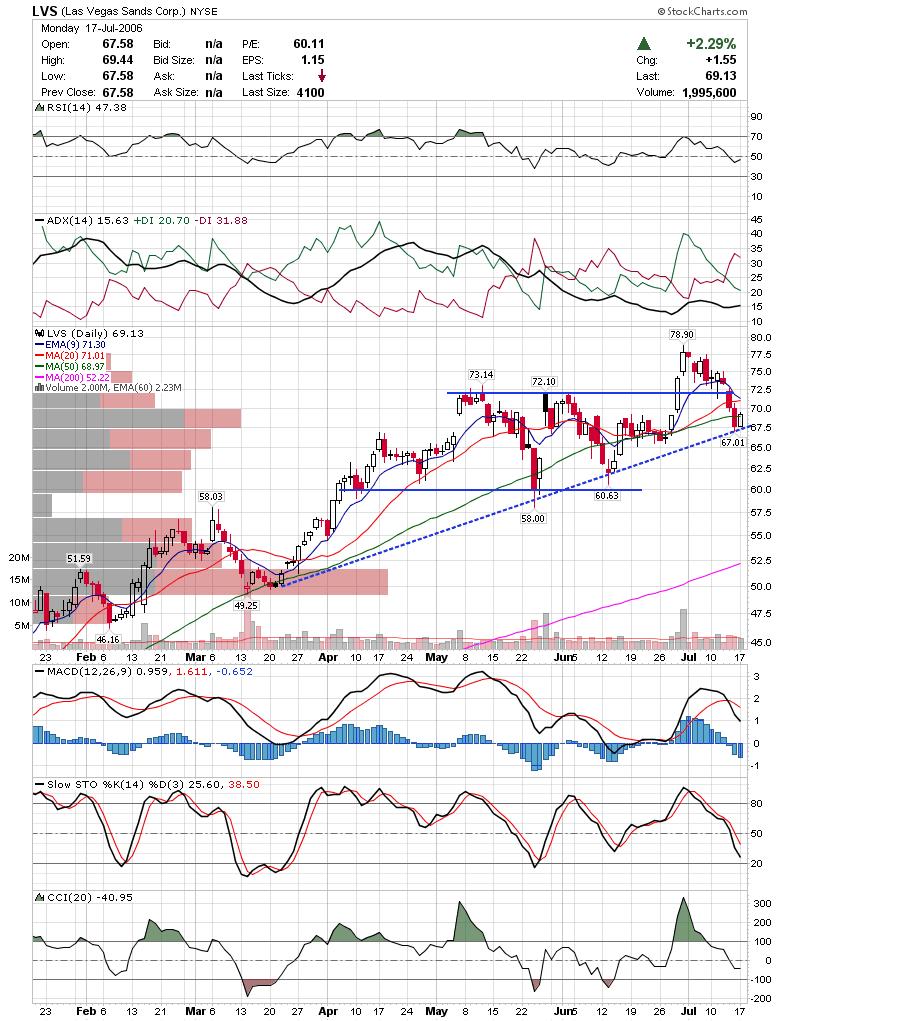 Here is a chart of VOL showing strong buying in the 44 area.
Keep an eye on recent picks, BIDU, IBCA, CSH, and TZOO. BIDU and IBCA had nice days today in particular.
Also, check out The Bulltrader for a promotion they are having to celebrate their one year anniversary. Congratulations Johns and company.
Good Luck and good trading,
DT
The Russell index is now the next index to break down after the Nasdaq. The Dow and SP500 are barely clinging to support and it looks like we are now in a bear market. While it looks like there will be continued weakness in the long run, we may experience an upturn this week. There are a few reasons for this. First, it is difficult to break through support in an oversold state. Second, this is options expiration week and the past few options expirations have trended opposite the underlying trend as the max pain theory takes effect.
Here is a Dow Industrials monthly chart showing several things. First is a possible top at a previous high. Second, look at the Dow/Nasdaq and Dow/Russell ratios towards the bottom. The Dow is outperforming both which shows that market participants are rotating to "safer" instruments. This is bearish for the markets in general as investors are more apt to take risks in bull markets.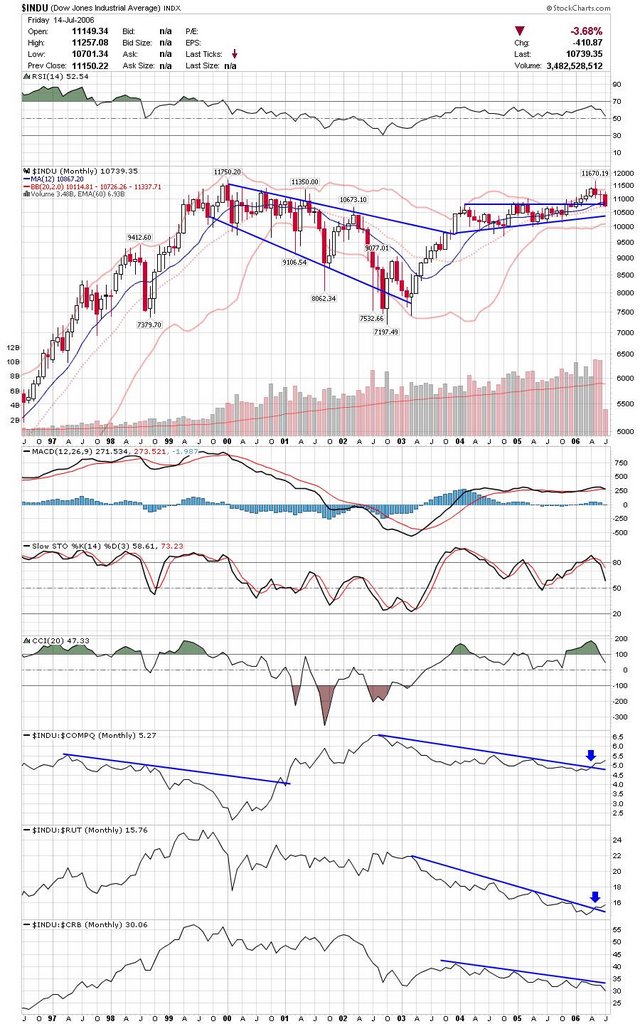 Here is a chart of the afore mentioned Russell Index. This is the weekly chart showing a break down out of the rising wedge after an upside breakout failure a couple months earlier.
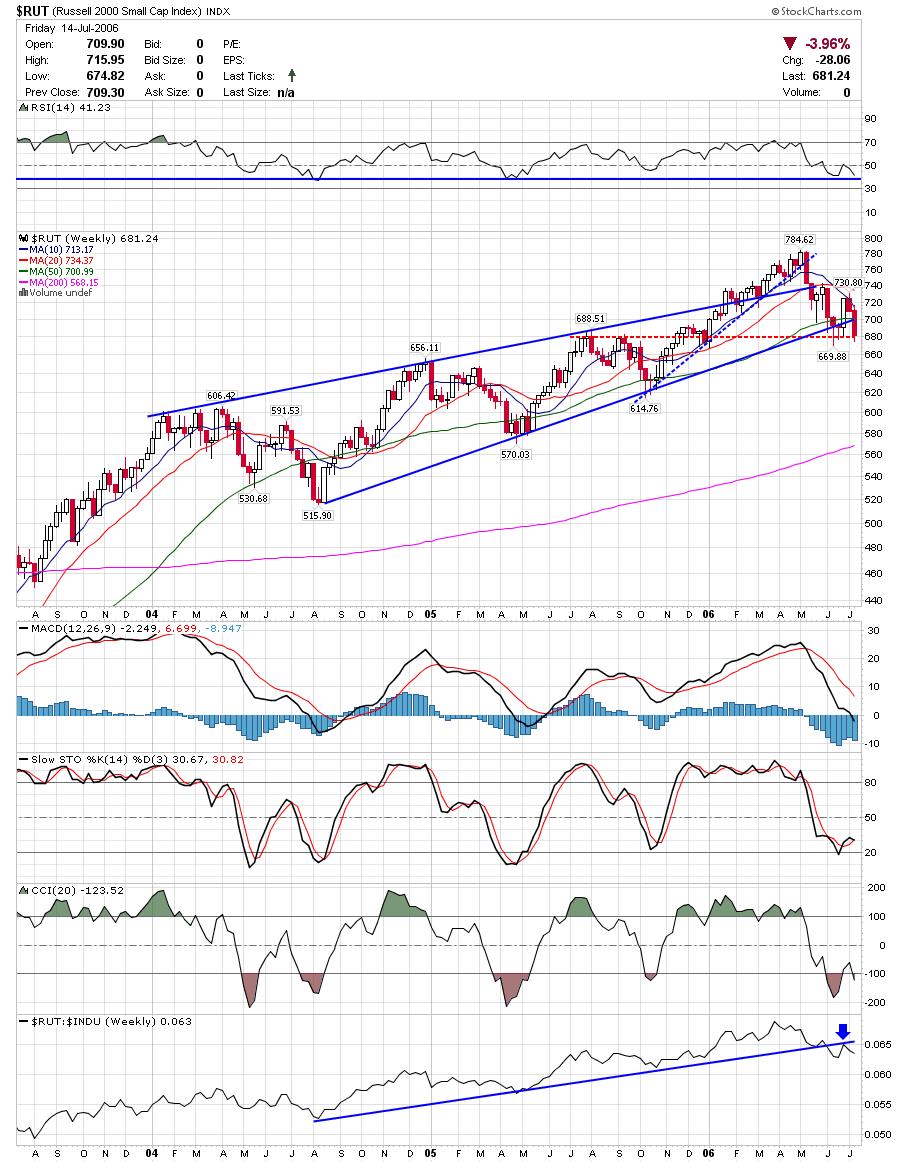 Here are a few charts. All of these are long charts because I believe that is where the reward is again, at least for the next few days.
ARGN refused to go down the past few days and is finding support along a rising trendline and MA's.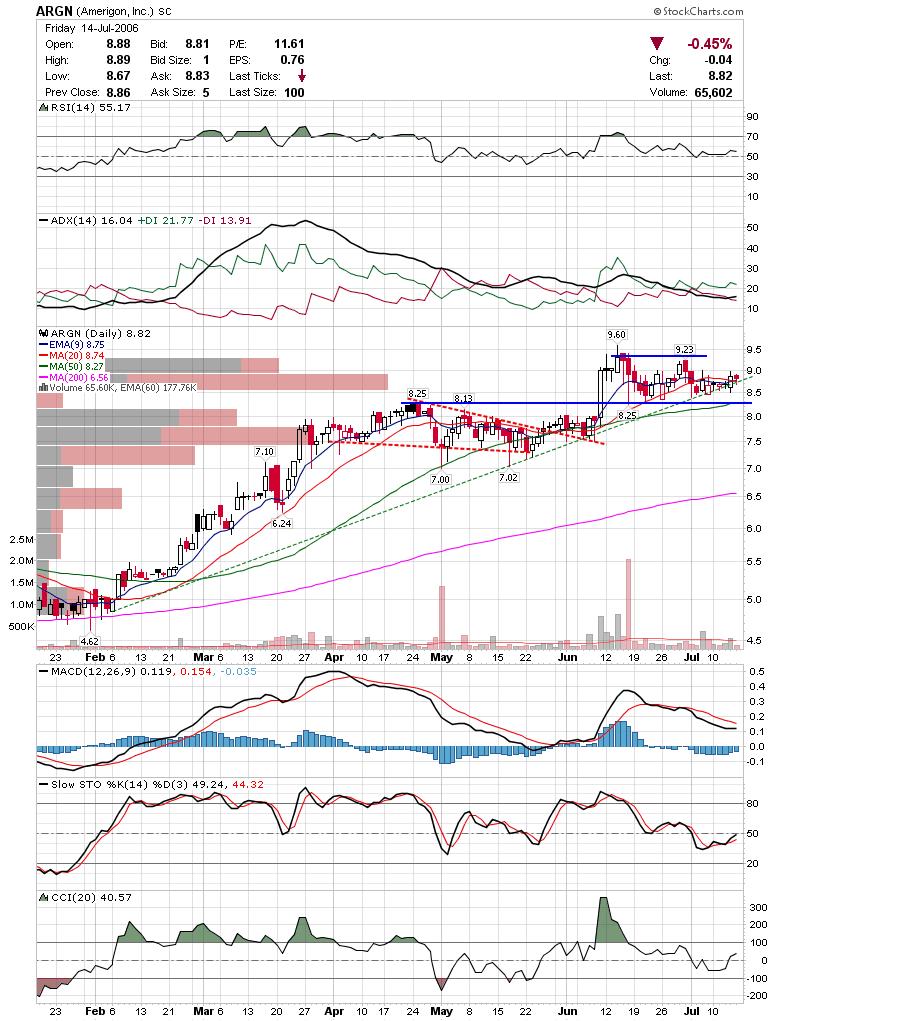 OMNI may find support near the rising trendline and 20sma.
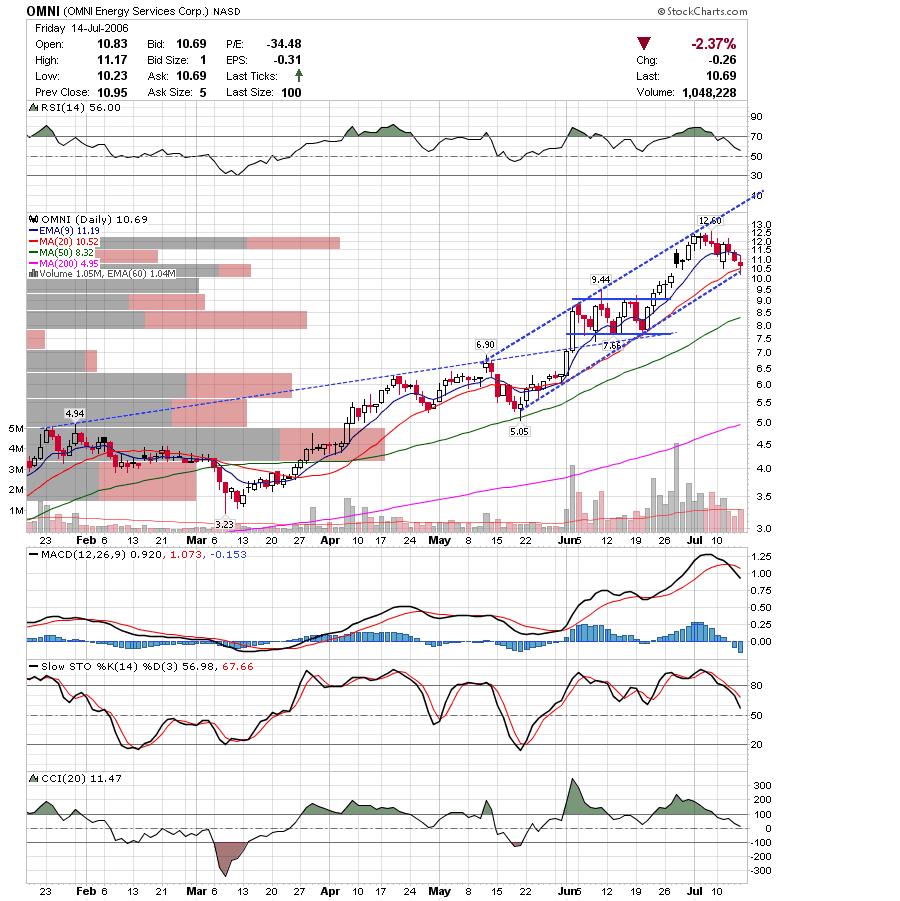 BTU is testing the downtrendline it cleared for potential support. It is wedged between the 50sma and horizontal trendline support right now.
 CSH looks like it may find support at the rising dotted red trendline.
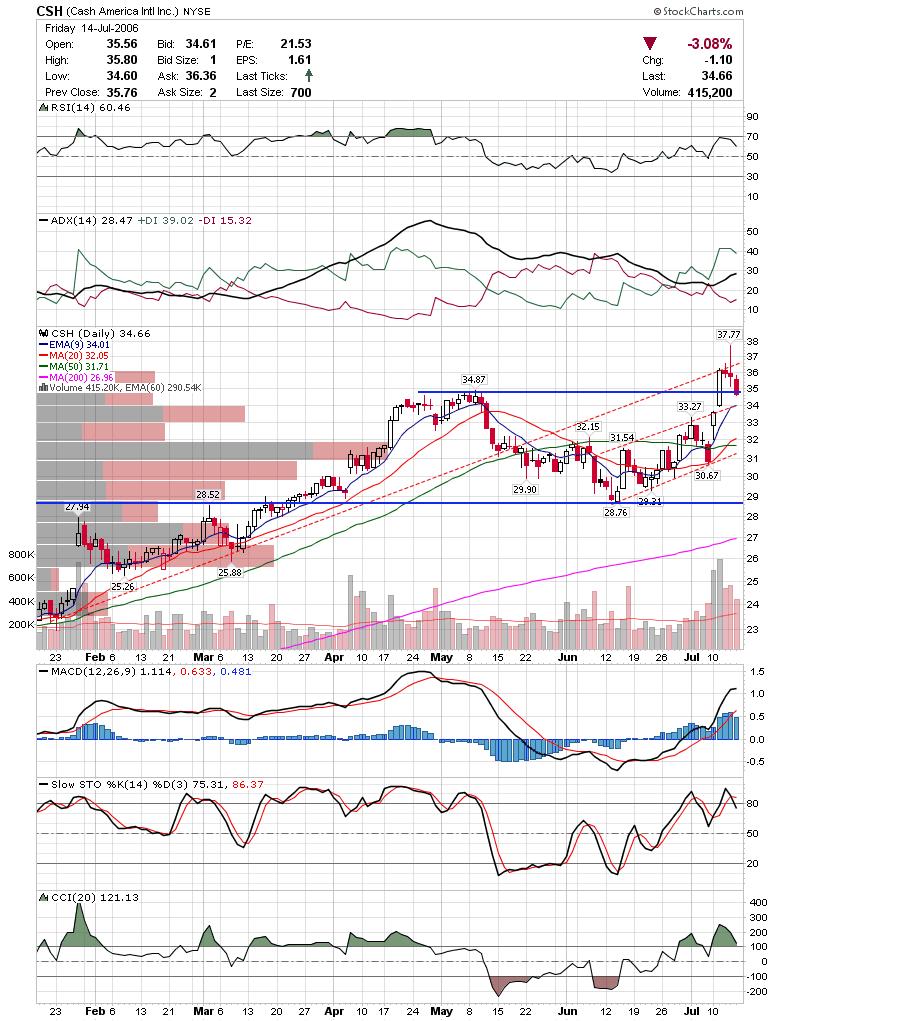 FMD is finding support at the previous rising trendline after the nasty breakdown the past two weeks. This is a decent chart to watch to see if it breaks under the blue line for a very nice short, or if it can get back over the red rectangle.
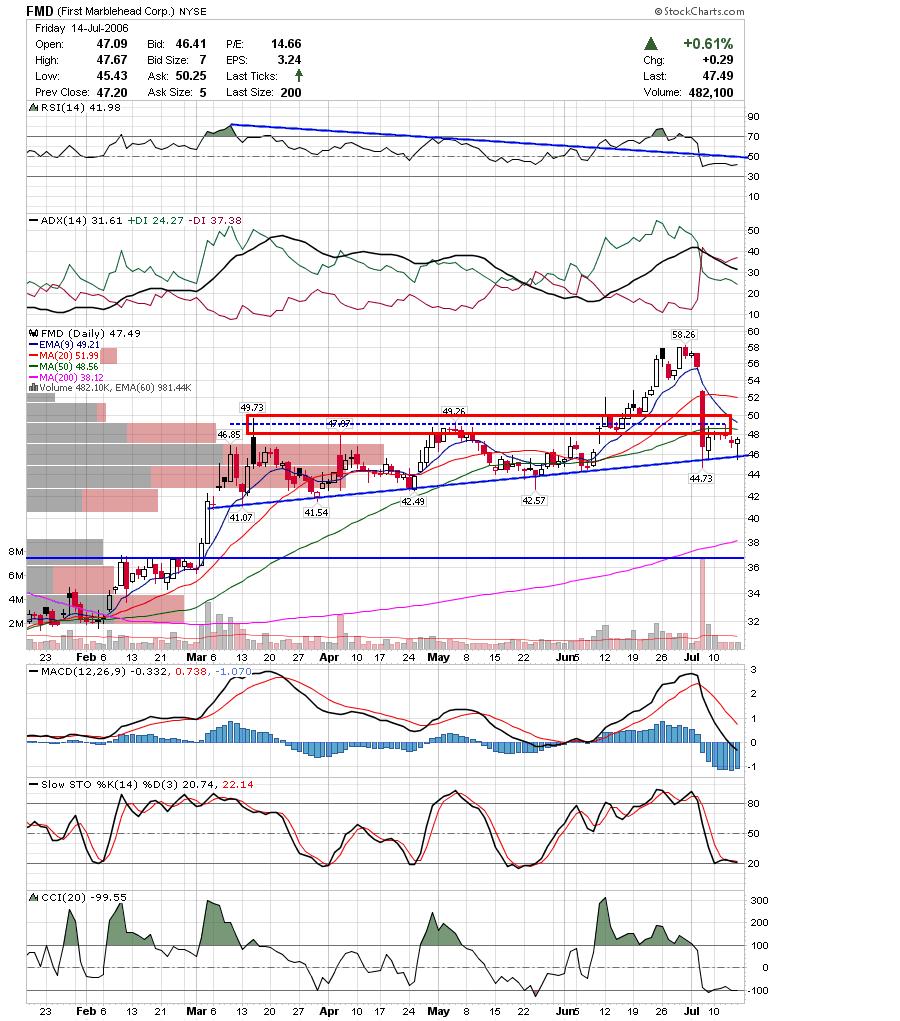 HLTH is holding over the horizontal trendline which was the previous breakout area.
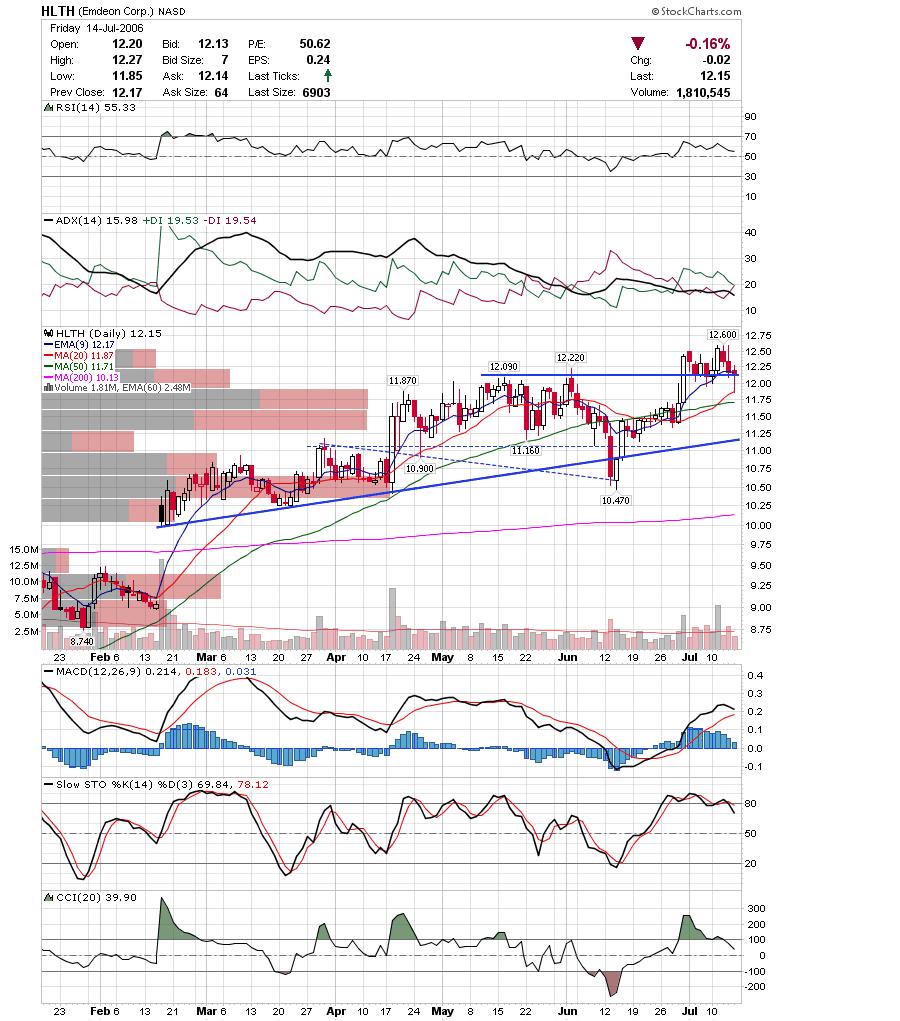 IBCA was an anomaly last friday heading higher as the market was breaking down. They are close to breaking out of this solid base.
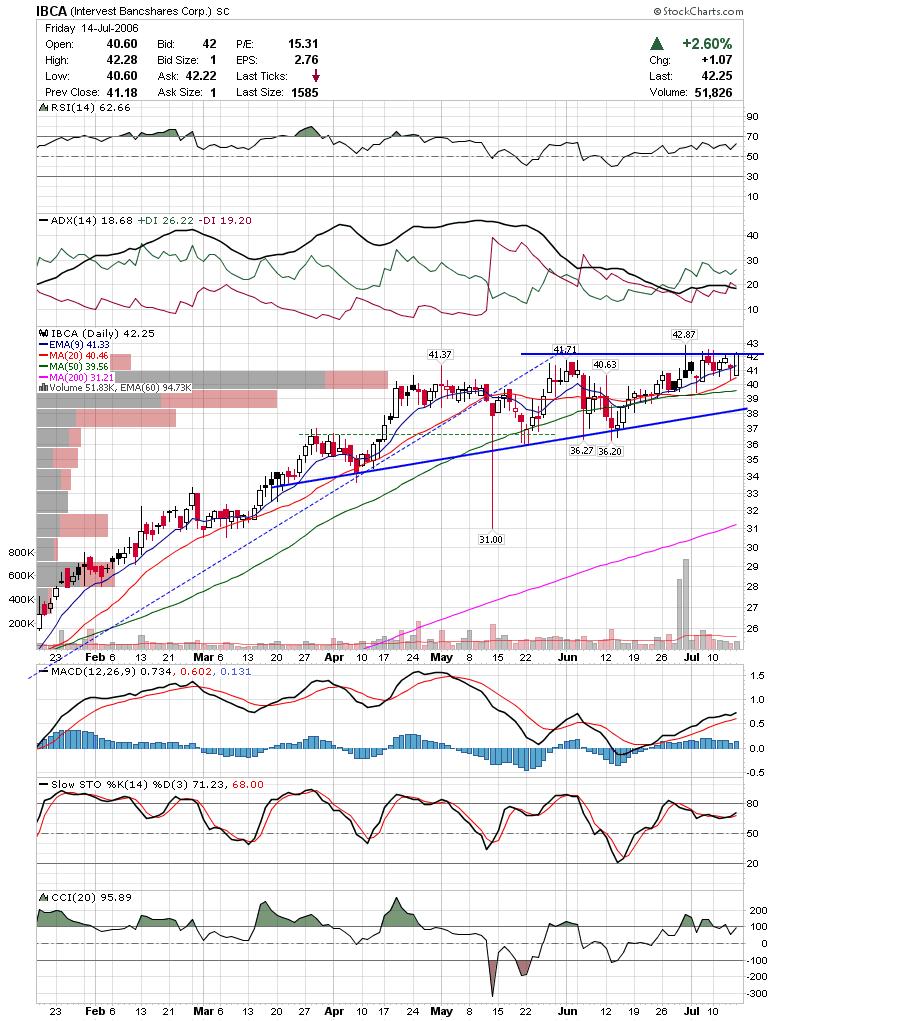 MED isn't giving me a clear chart pattern to work with, but the price action and volume are giving clues that a big move is in store. Look at how narrow a range and how light the volume has gotten over the past few days. Keep an eye on it to see which way it breaks.
 SII has been trading this range for the past year and is near the top again. It may need dip one more time if it is gonna breakout, but it is worth watching to see if it attempts it now.
 TZOO has been acting bullish and is reporting earnings soon.
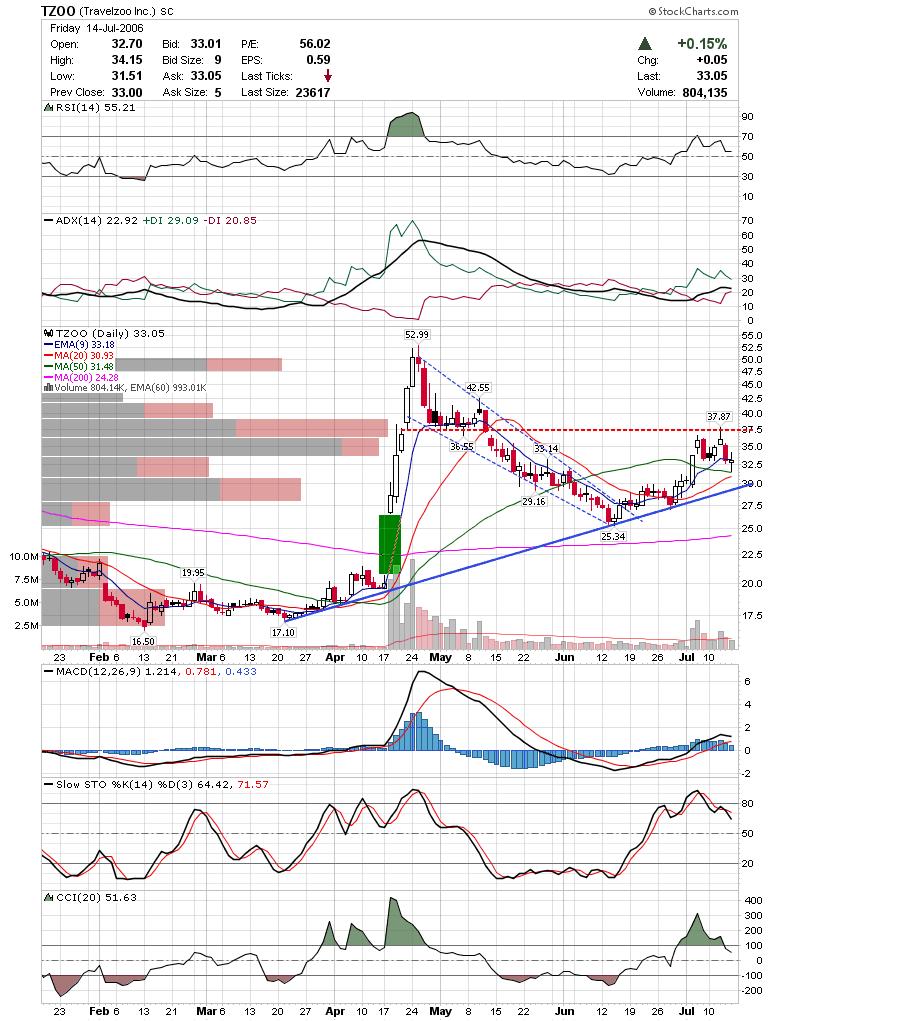
Also, keep an eye on BIDU as they were strong last friday as the market was weak. I should have some BIDU charts in the archives.
Good Luck,
DT
Subscribe to:
Posts (Atom)


