Trader Mike hit over 1,000,000 page views today, and I had the honor of being number 999,999. Join me in congratulating Mike on this accomplishment.
Sorry I couldn't post an update last night. I have no Phone or DSL service at home. Looks like some construction workers cut something yesterday. I may not have a post this weekend if the problem isn't resolved.
DT
The SP500 and Dow both stalled at the resistance I mentioned last night.
Here is a chart showing the SP500 at neckline resistance. I wouldn't be surprised to see the indices stall here. Here is the Dow showing a similar situation.
 Here is the Nasdaq which is struggling with resistance of it's own. Notice How the previous June support is now resistance.
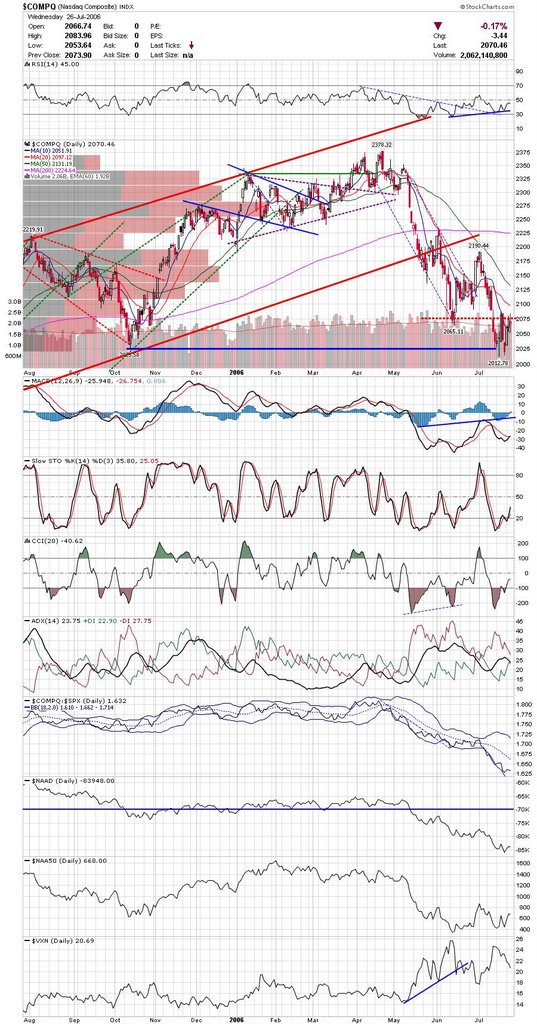 Metals were up today as the dollar was stalling out. If the dollar falls here Gold and Silver could get a nice little bump.
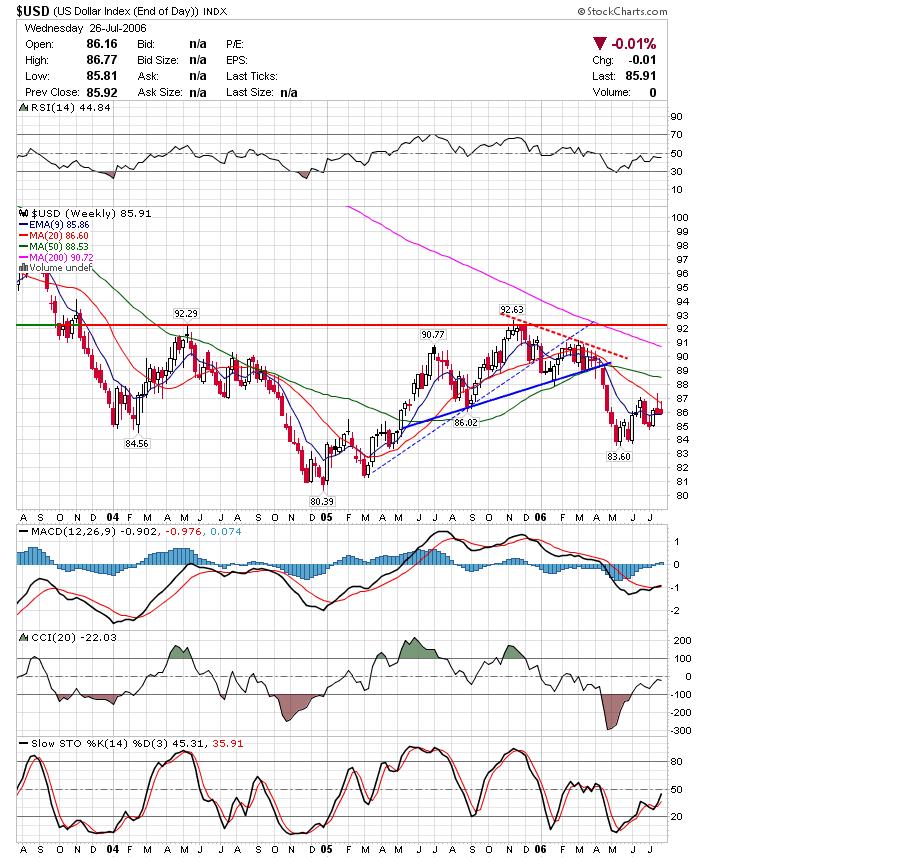
No individual charts tonight. I would look to the consumer discretionary sector for possible shorts and healthcare / staples for longs.
Good night,
DT
The Dow and SP500 are testing major trendlines and this is a logical place for a failure if a rally is not in the cards. Could go either way at this point really, with fair arguments for both bulls and bears.
Here is a chart of the industrials showing the trendline resistance. The SP500 is in a similar pattern. The Nasdaq doesn't have a similar downtrendline, but closed one point above the previous June low. It needs to move decisively over this area for bulls to feel a little better.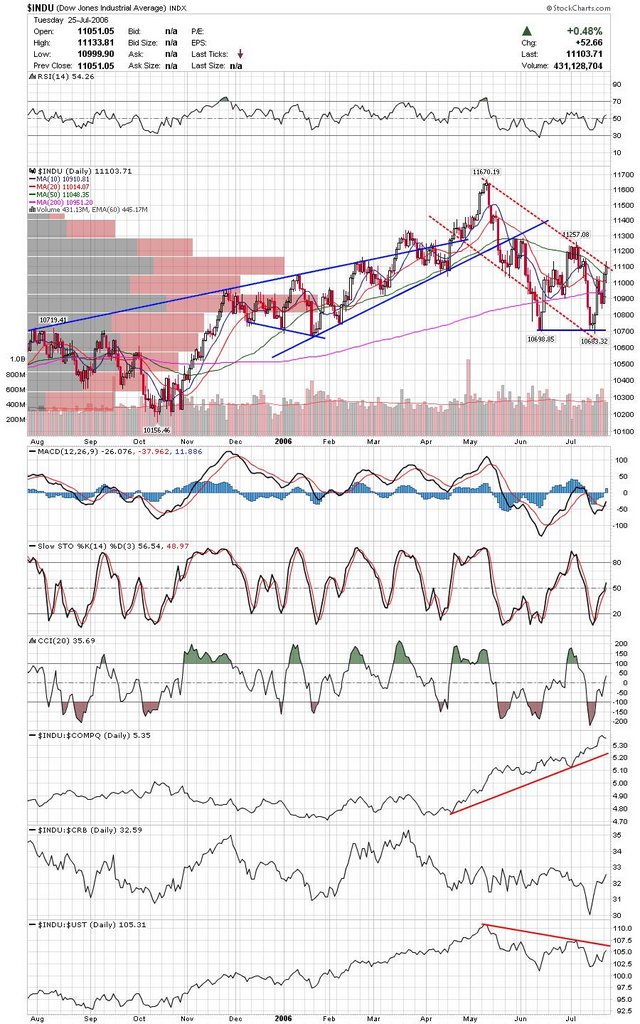 Commodities are getting interesting at these levels. The question is are commodities experiencing a normal correction or topping? Here is a chart I created that watches the link between the $crb and the Dollar index. Notice that these markets trend opposite each other. The Dollar has strengthened a little recently as the $CRB has pulled back. Notice the $crb (gold area) has been bouncing between the upper band and the 39 week average. The dollar is the green histogram and notice the possible reverse head and shoulders bottom. It will be interesting to see how this works out after the next fed meeting.
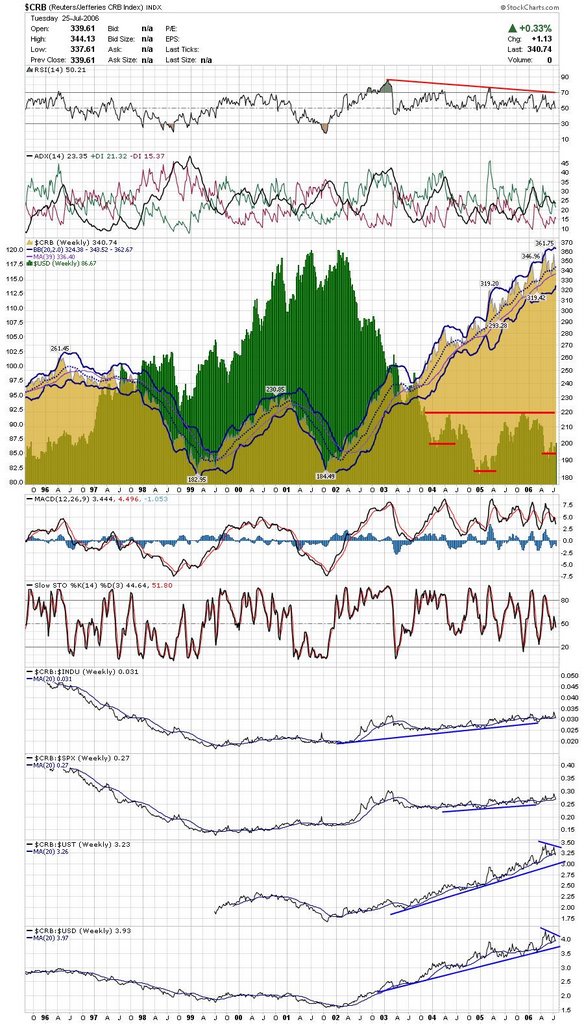 Here is a chart of the Natural Gas index. It looks like it may test the upper trendline soon.
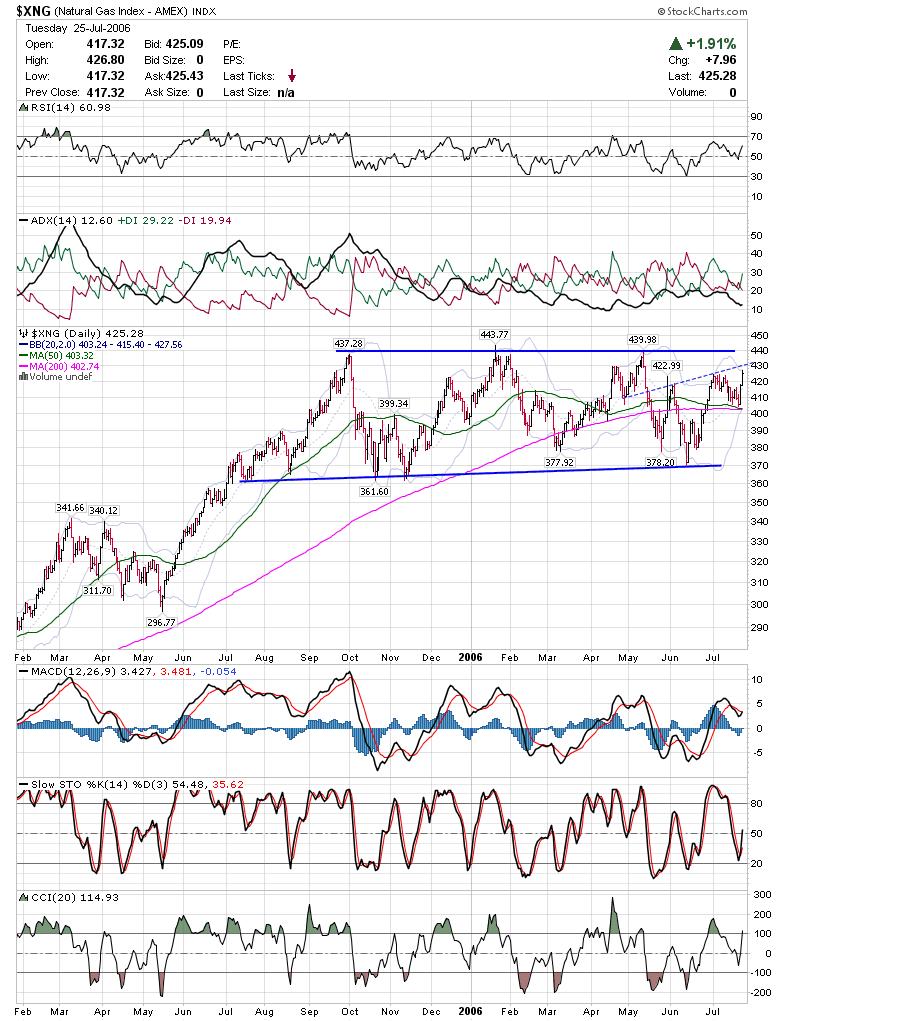 Telecom's broke out today after AT&T's bullish earnings report. I think telecoms are worth atching for the next pullback.
 GLG could go either way at this point, but I see a couple of possible bullish patterns here. If it clears this pennant type pullback, it could form a reverse head and shoulders with the neckline being near 39.
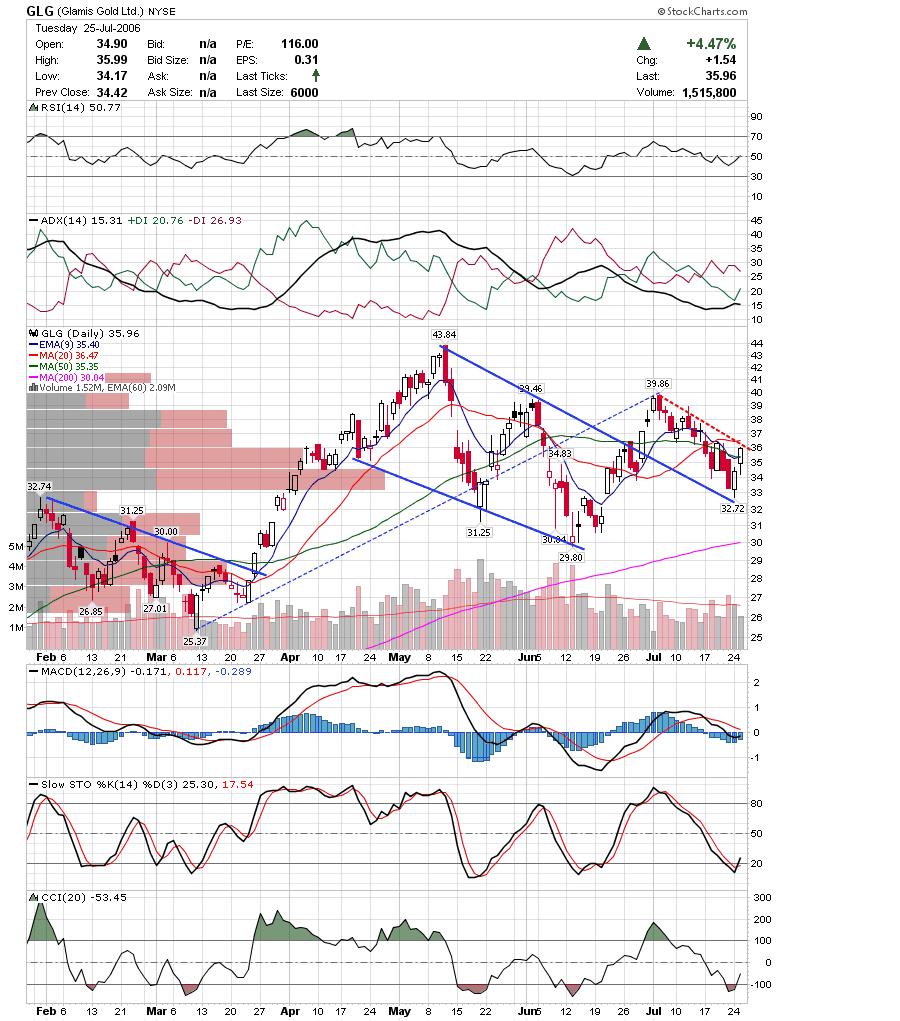 VIVO is struggling under the major trendline break.
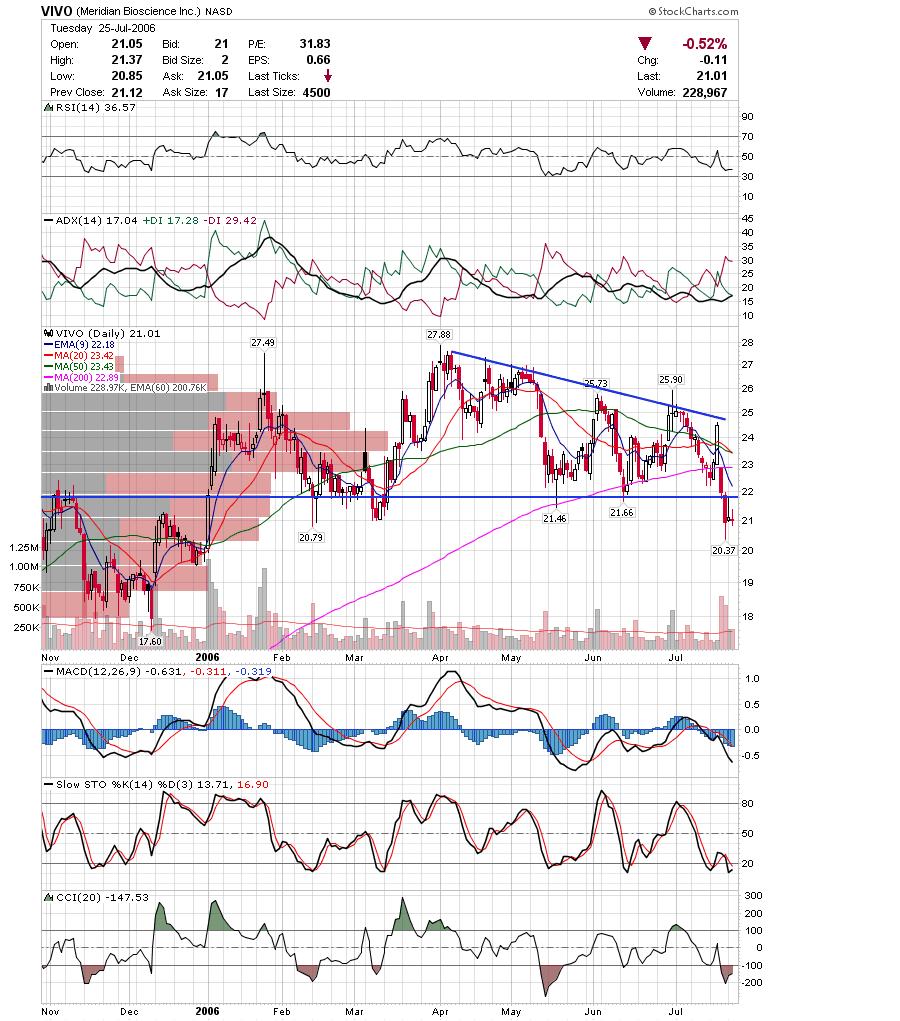 OMNI had a nice day today and may be headed towards the previous highs. I also own EGY in this area and both are looking decent.
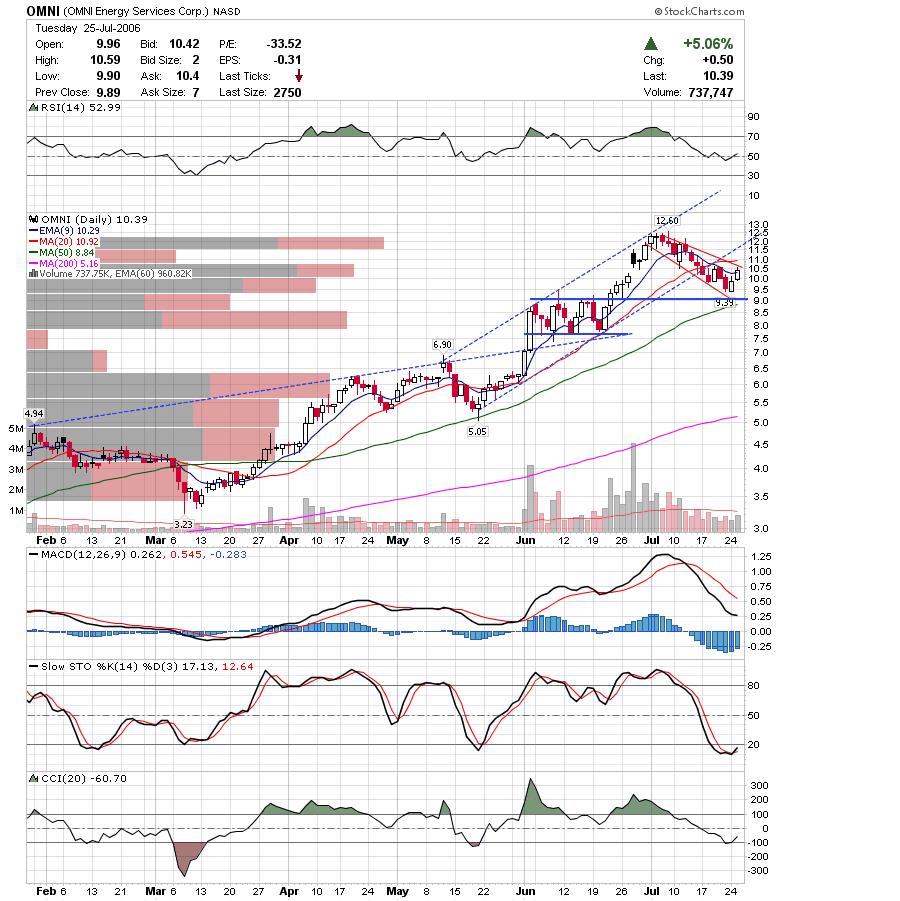 HLTH continues to chug along the previous breakout area. Aggresive traders may buy on a higher daily high. Conservative traders may wait for it to clear resistance.
 EOG looks like it may be setting up for a nice short. It is up against the 200sma and trendline resistance.
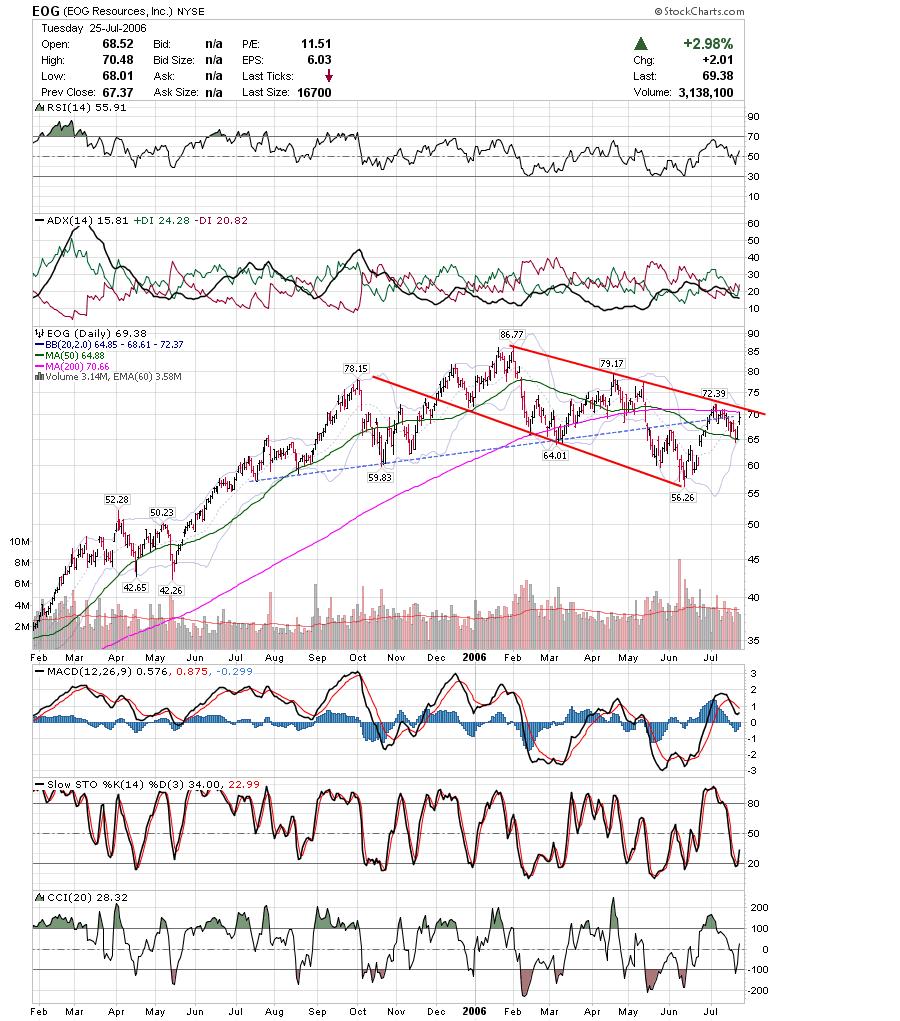 HAL is attempting to retrace some of the recent losses. I would doubt it closes above the gap. The target is listed by the red box.
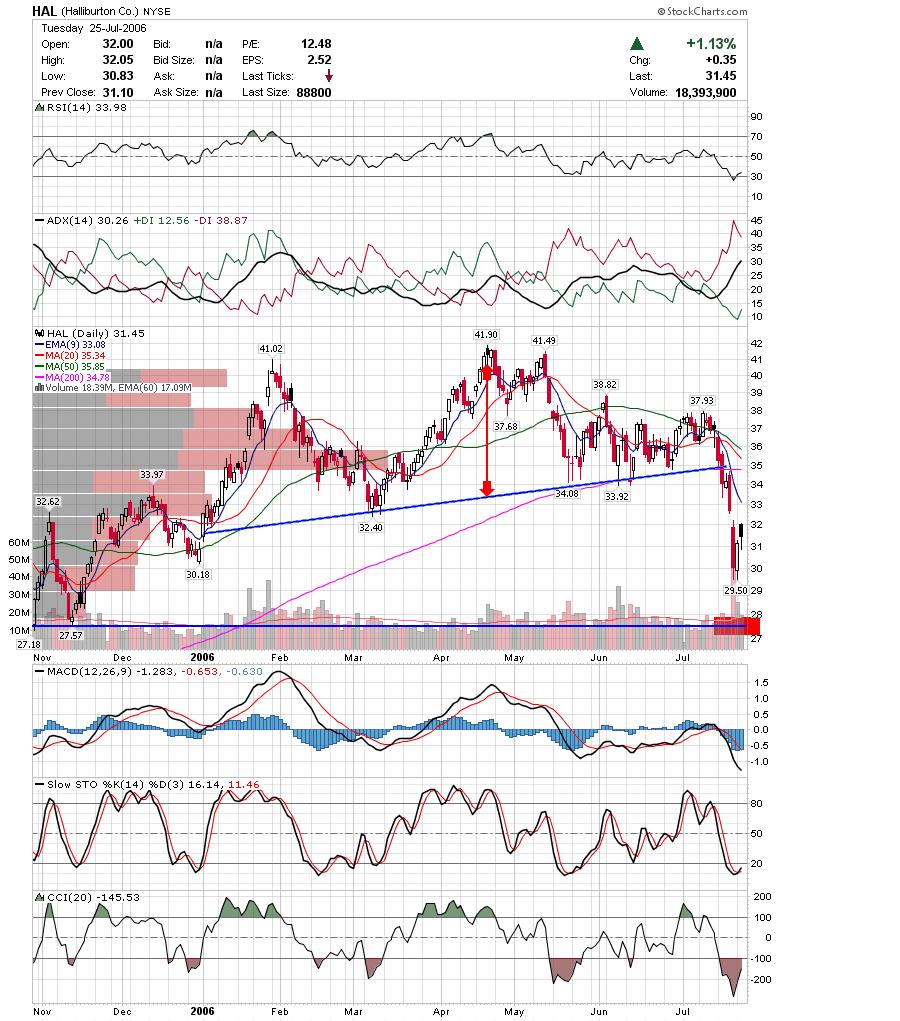
Notice I have both Shorts and Longs in the Oil / Energy sector. While I think the energy sector is in the process of topping, it looks like it is moving higher short term. I am looking to play a spread by going long on the stronger stocks and short the weaker ones, until this resolves itself.
Good Luck,
DT
Markets had a large percentage gain today, but volume was pretty low. The markets may be putting in double bottoms here but volume will have to increase for any sustainable rally. Here is an updated SP500 chart showing the possible reverse Head and Shoulders that I mentioned last week. It looks like the neckline will at least be tested. I highlighted the Oil Sector last night as possibly topping. The OIH fund bounced off the neckline today. Although the I still believe the Energy markets to be near a "top", it looks like there is a decent chance for a retracement here, or even a near term bottom.
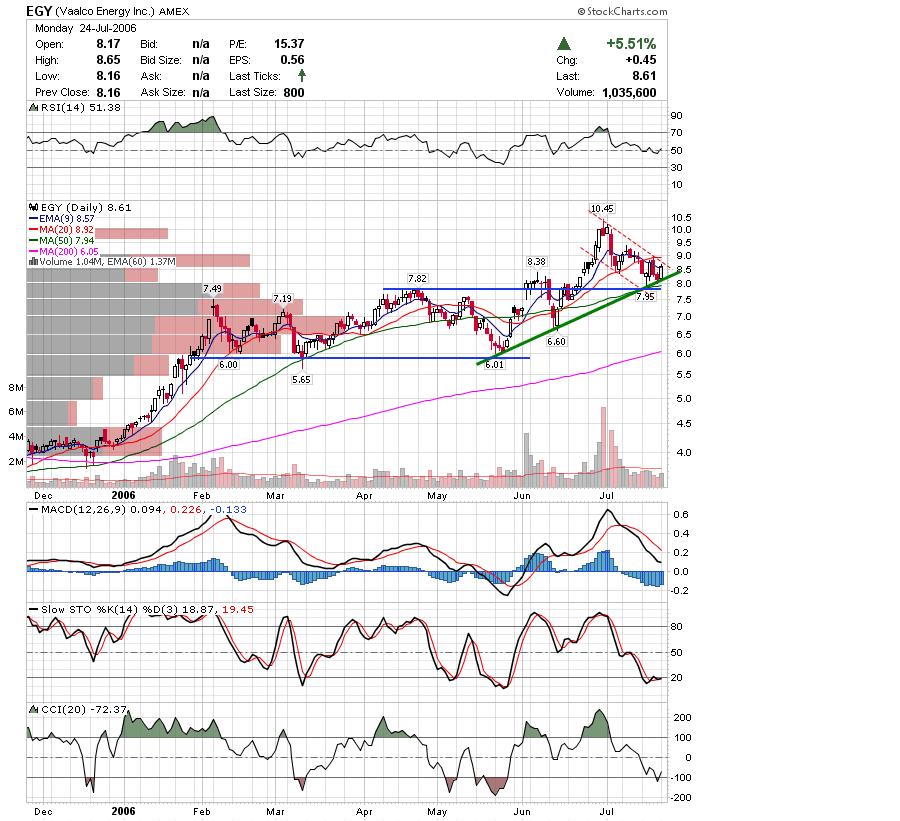 Drug stocks are starting to perform well on a relative basis and may be the beneficiaries of a market rotation to more defensive groups. Here is a chart of AMGN clearing a long term downtrendline.
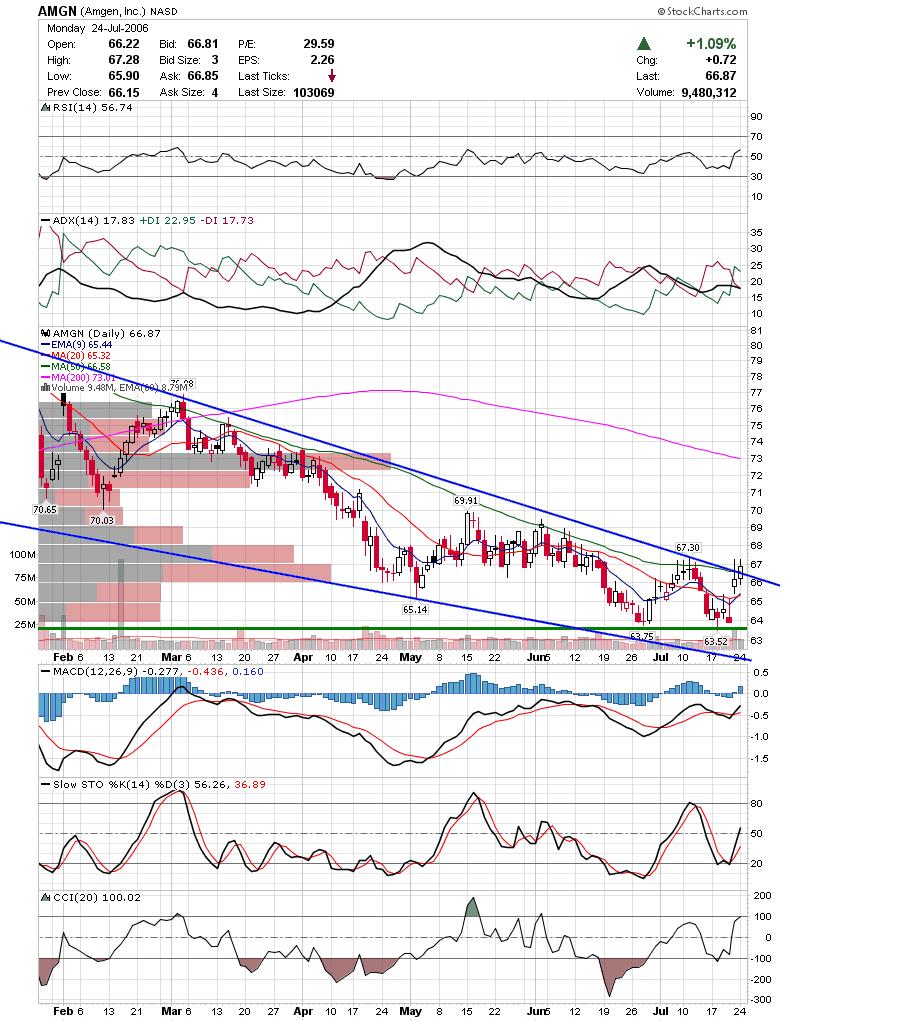
Here is a larger view showing a falling wedge which also supports a possible bottom theory by finding support near a horizontal trendline.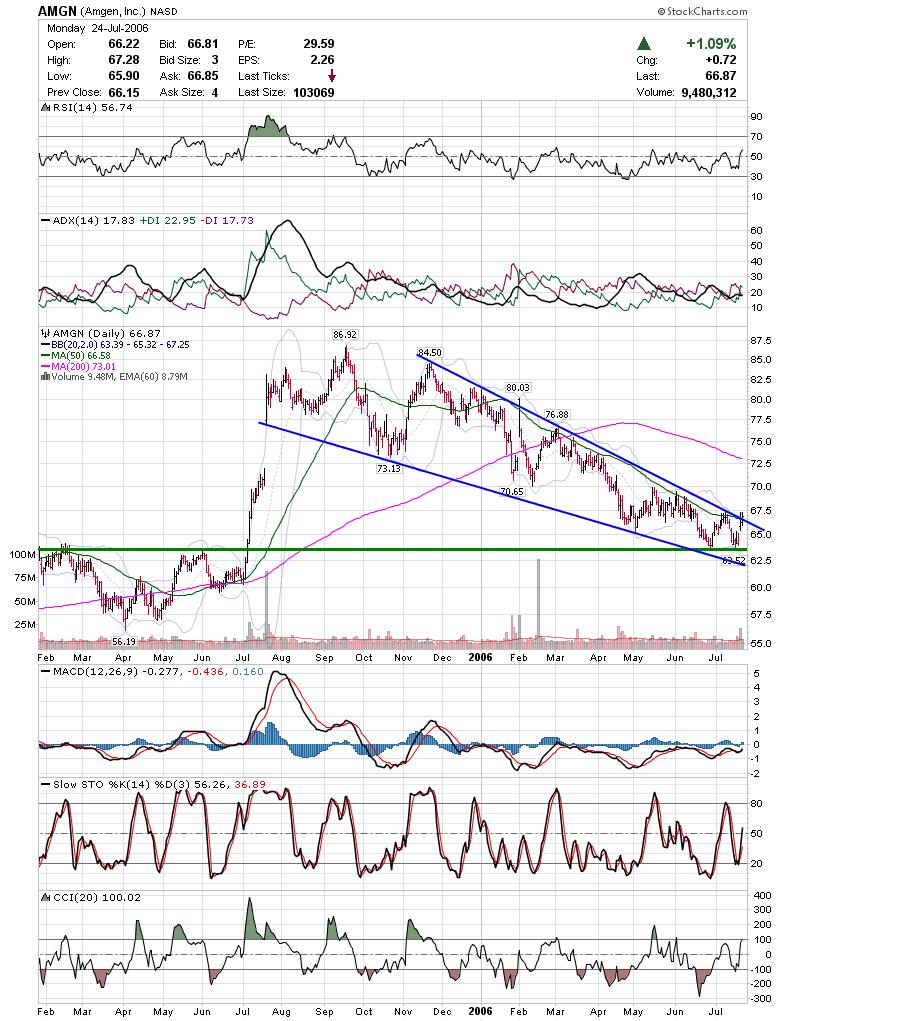
Careful the next couple days in case the indices are merely getting a technical bounce.
Good Luck,
DT
It's a little late here and I have a bunch of charts, so I will just run through them.
Here is an updated weekly chart of the Nasdaq showing a possible support trendline under the October lows that have been breached.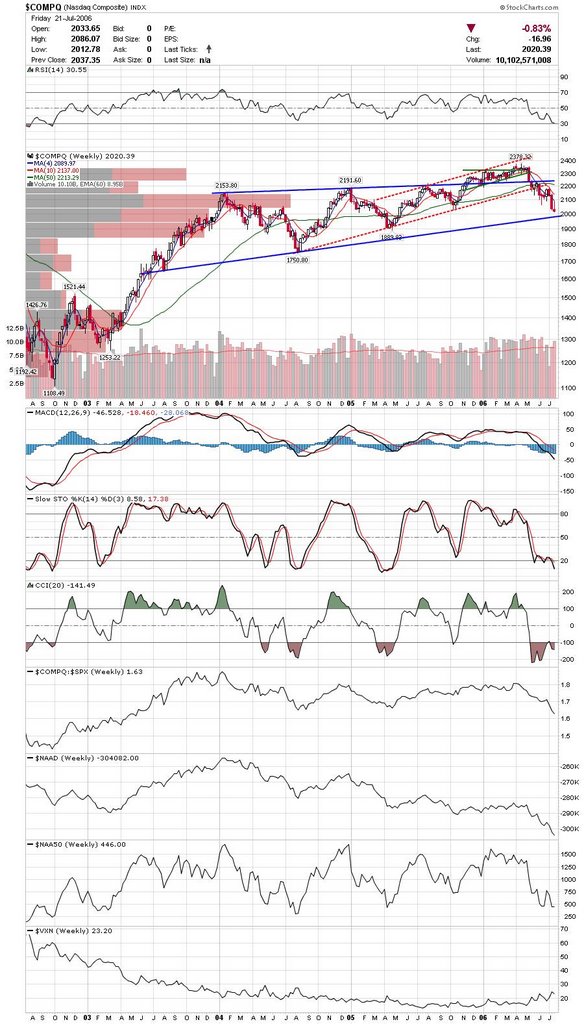 Here is a weekly chart of the Russell. The trendlines speak for themselves. One thing to notice are the ratio charts under the indicators. It looks like smallcaps may finally underperform big caps.
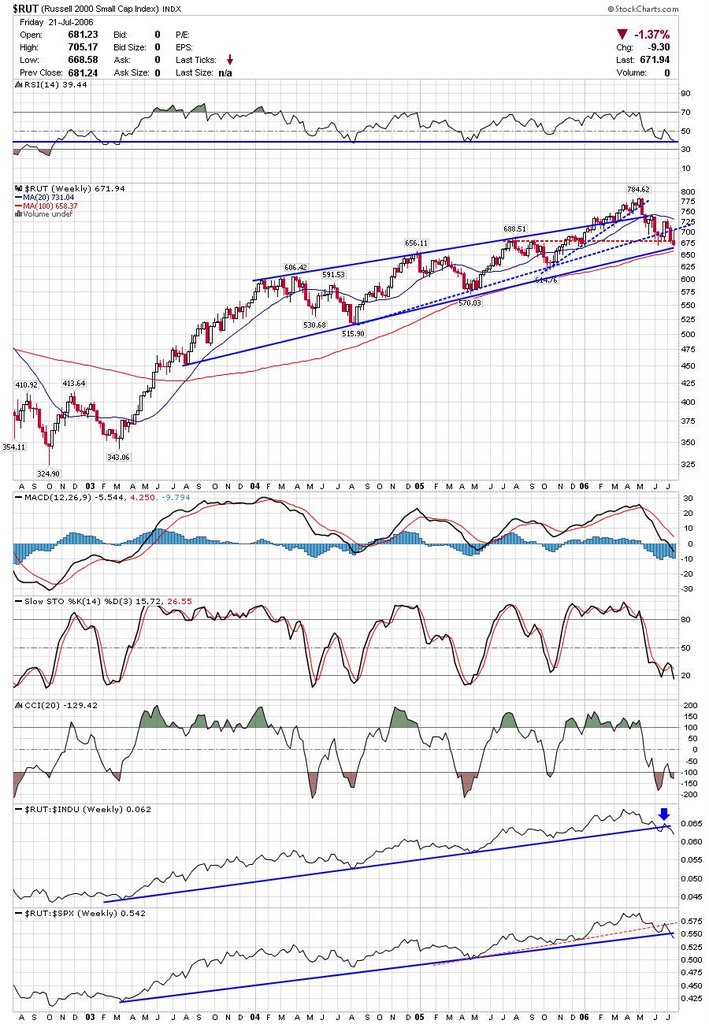 I mentioned a possible head and shoulders top in the OIH fund, and it looks like it is very close to completing if it hasn't already done so.
 Here is a weekly chart with the Oil overlayed on it. Typically, the Oil stocks peak before the commodity and notice that Oil kept rising as OIH made a lower high.
 BWP has been pulling back from resistance, but is holding up rather well as the markets have deteriorated. Watch for a breakout if markets move higher.
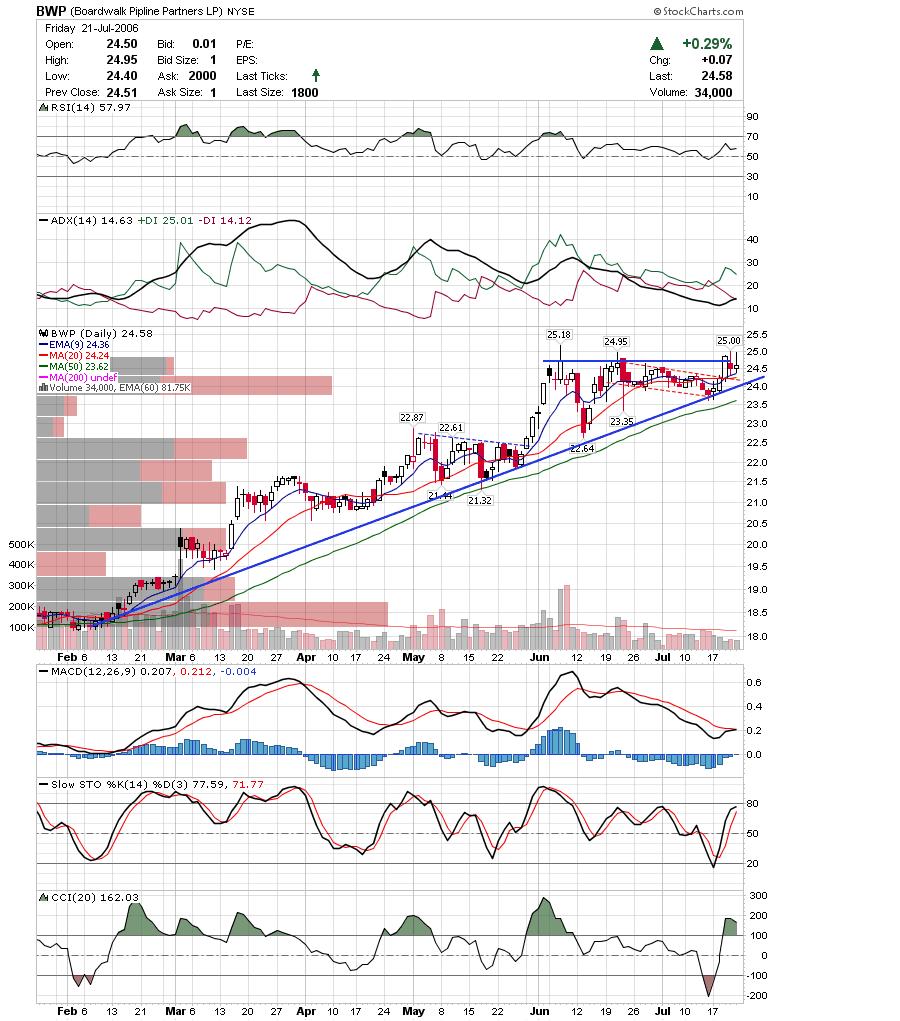 I suspected that BIDU may trade near 89 based on options Max Pain level. It closed pretty near and with a doji on support. If it makes a higher high it may be a decent buy.
 CRY has held near it's breakout area and may follow through with a bounce off the 20sma.
 Here is a chart of NTRI for those holding for earnings. This is another that was pinned to 65 for options expiration. It rose to 66 after market Friday so expect a gap up.
 JCOM fell out of an expanding trading range and may be headed to it's 200sma.
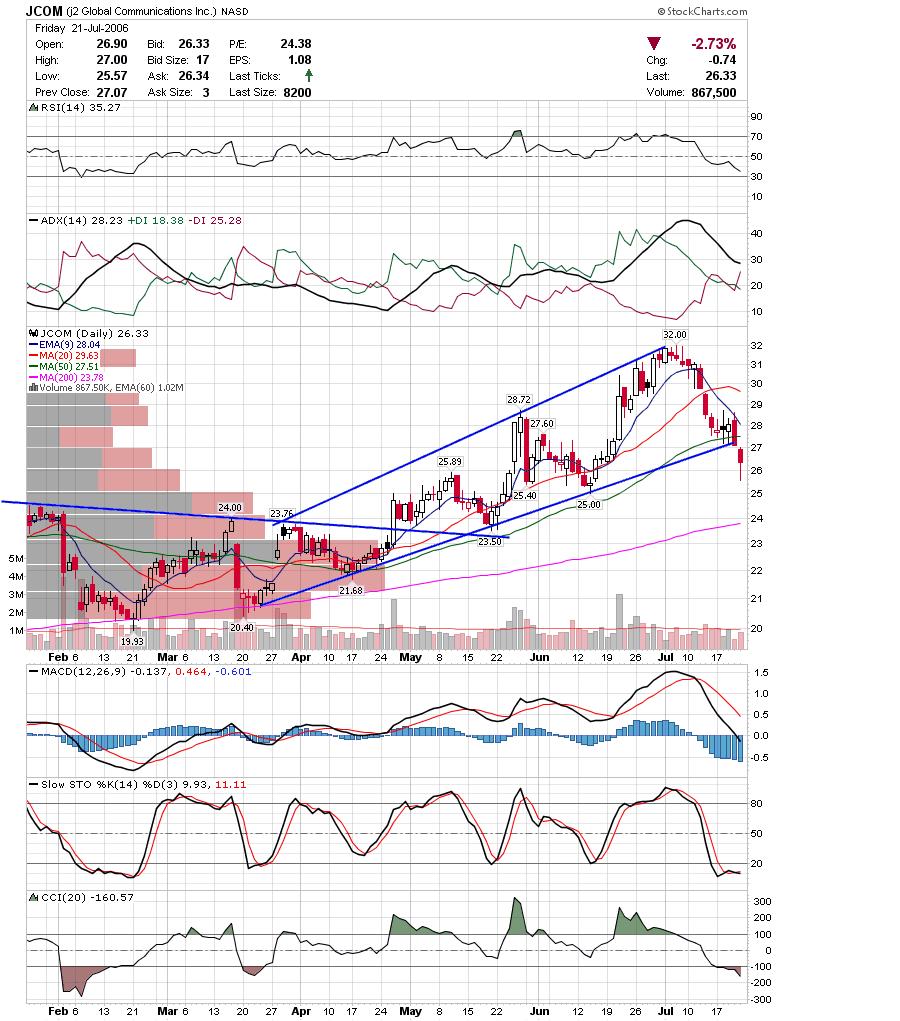 LVS broke under a risising trendline and may be headed to 50.
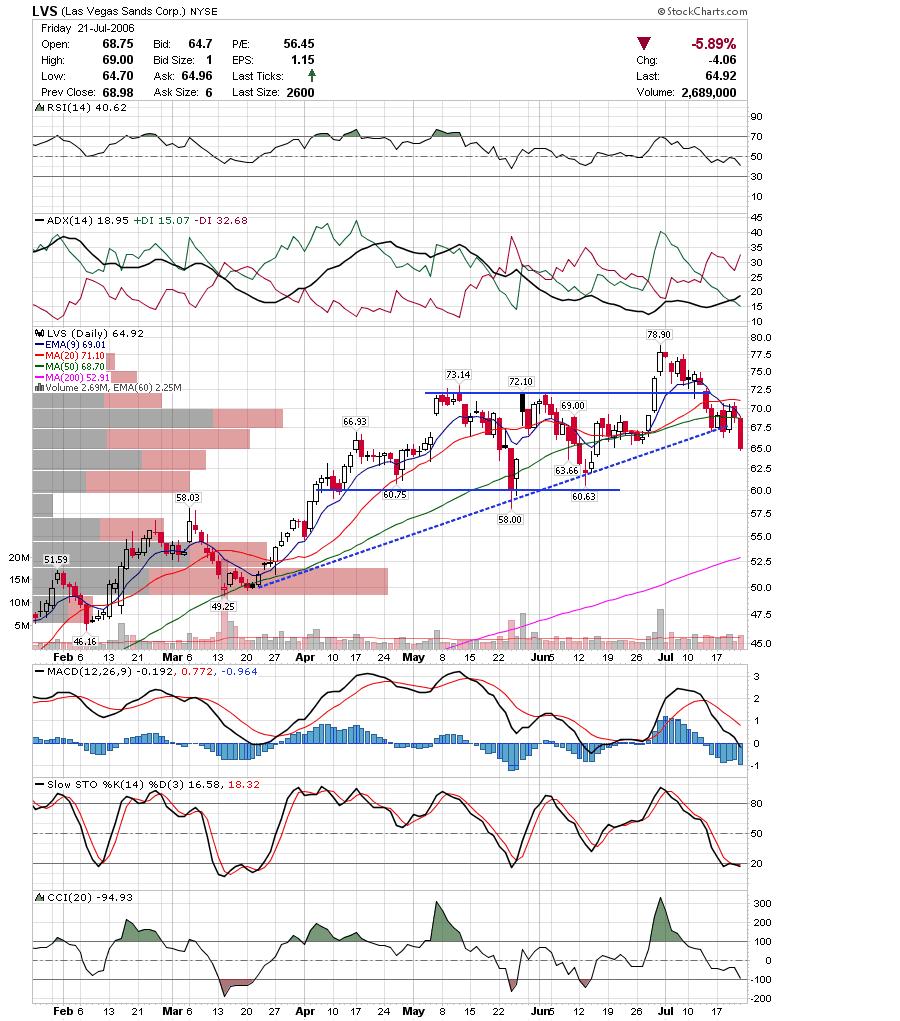 VIVO broke down friday and may be a decent short if it bounces back to test resistance.
 DRIV has been holding the previous resistance trendline as support. This could be a good trade either way, and I suspect it all depends on the near term market direction. If it breaks lower, it has a LONG way to fall.
 CACC is at critical support near 25. This is another that could go either way depending on how it deals with a major trendline.
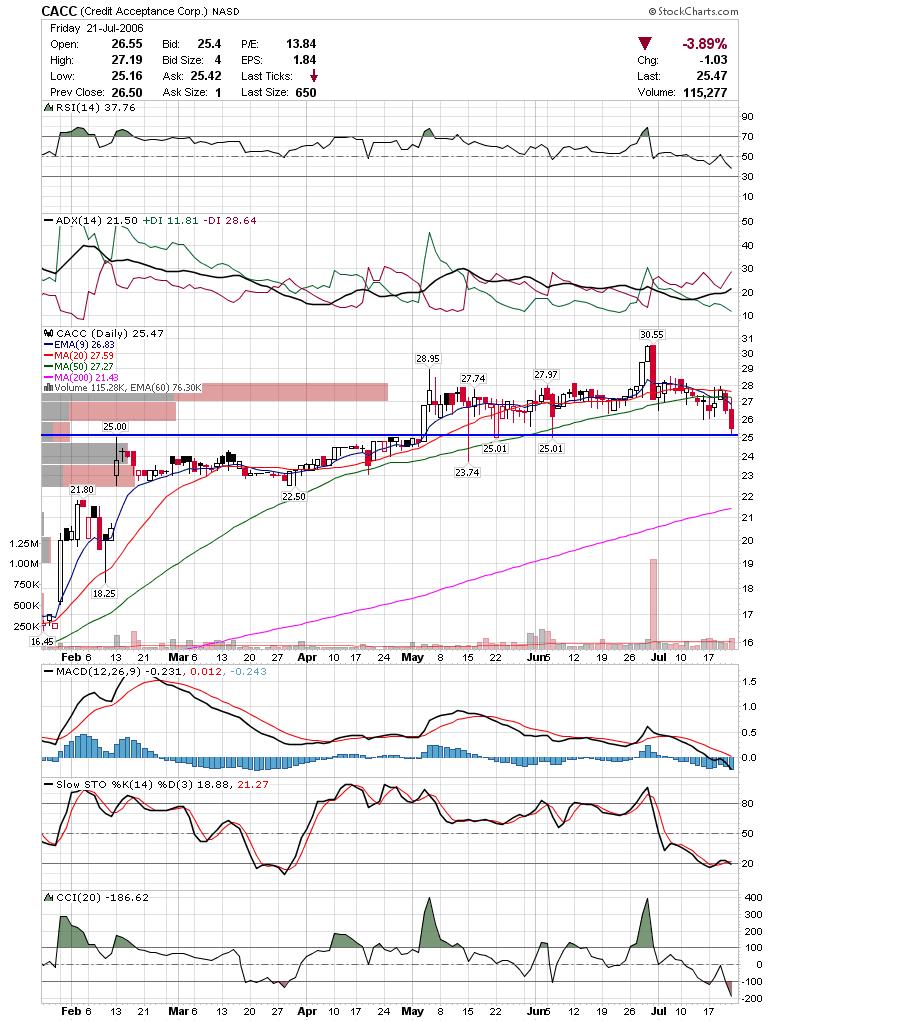 INFA is looking very good as a long play, but of course, a lot depends on the markets near term. Here is a weekly chart showing INFA bouncing off of two converging trendlines.
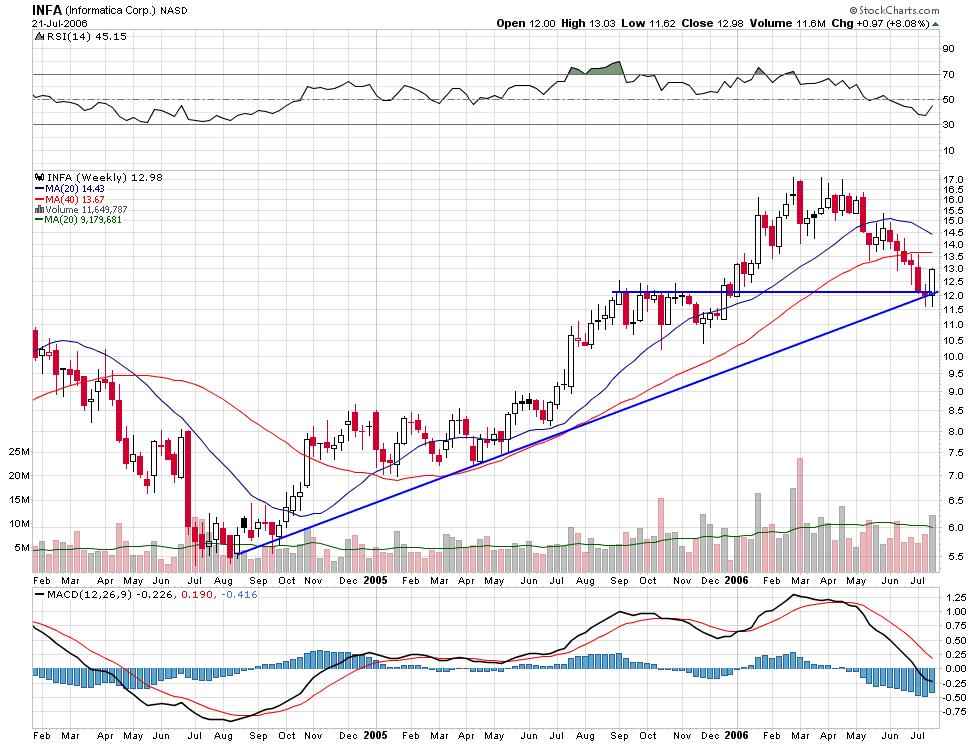 Here is the daily chart that isn't that exciting without the context of the weekly chart.
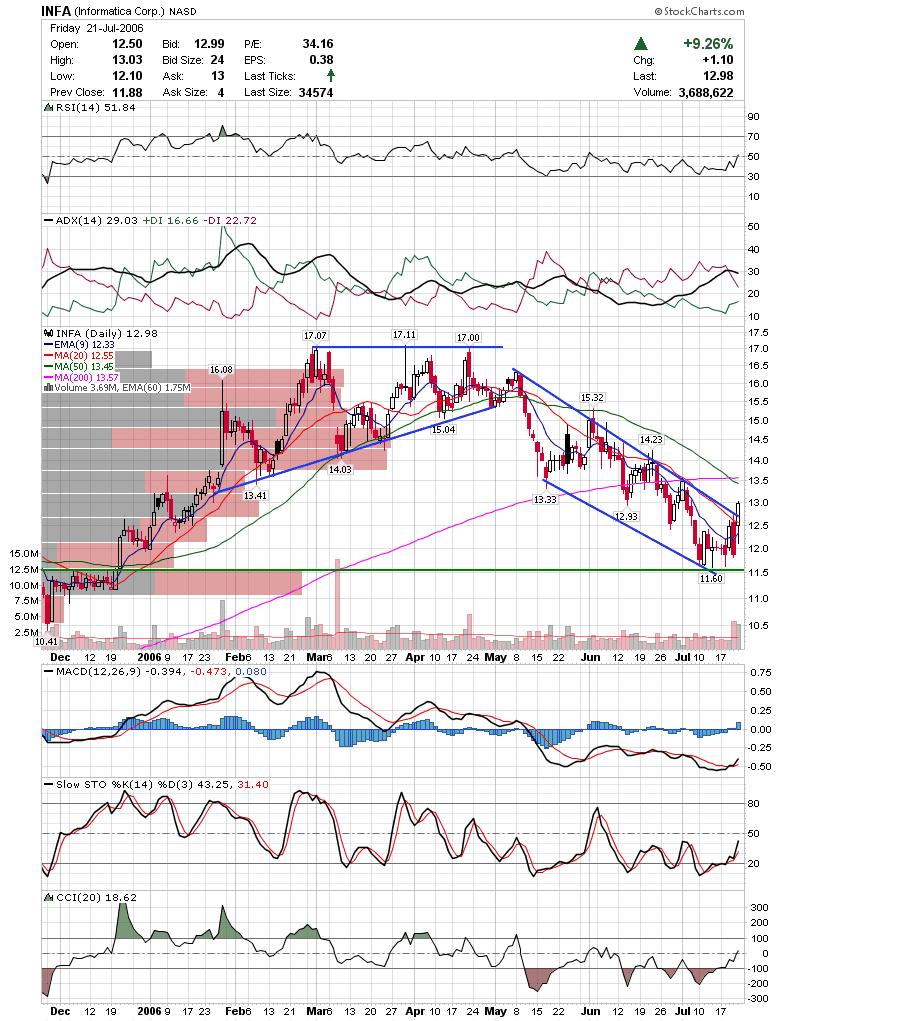 CSH is back to the breakout area. Watch to see if it bounces here.
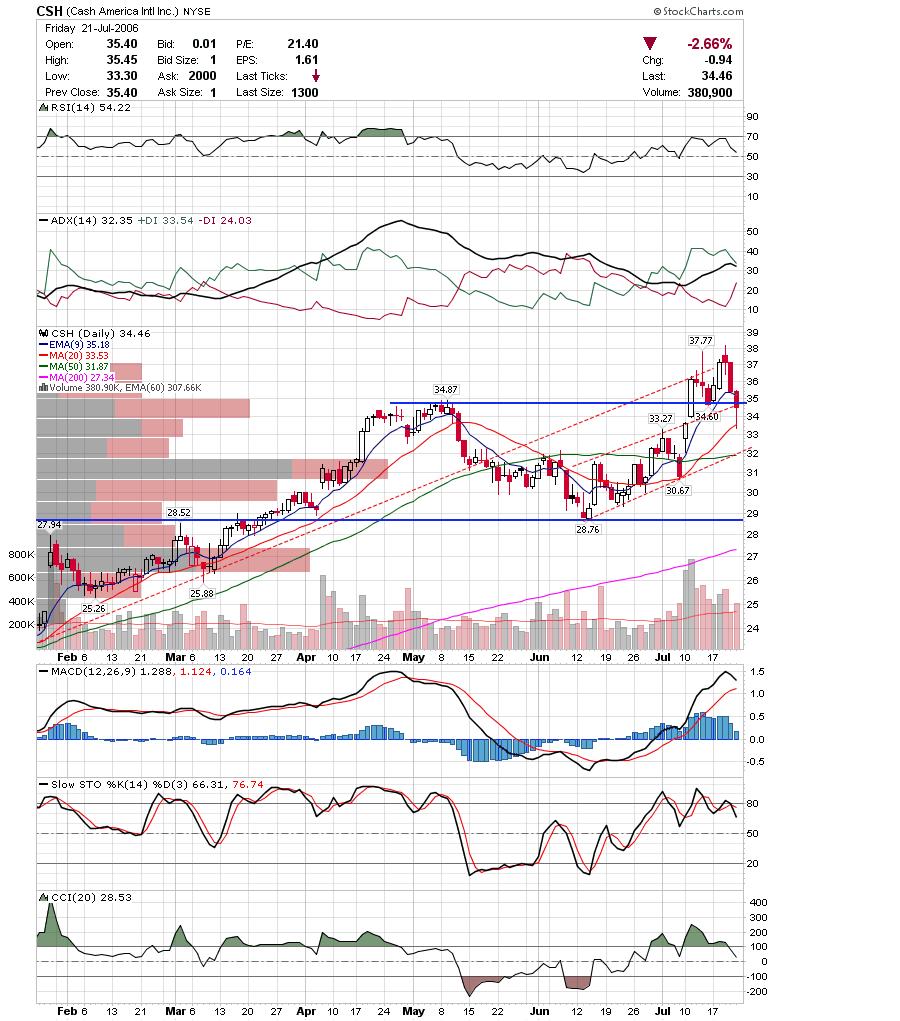
The markets are at another crucial point as there is a chance of a strong rally off a possible double bottom, or there is a chance that things will get really ugly, really fast if the Dow and SP500 follow the Nasdaq lead in making new lows. Trade Carefully,
DT
PS. I also noticed KOMG as a possible short after finishing this post. I'll try to post a chart tomorrow.
Subscribe to:
Posts (Atom)


