The indices mostly just drifted up to resistance today. There are a couple of things that may offer some hope to the bulls. First, I've noticed more strength in the Nasdaq the past two days, and the Russell may of bounced off support today. With the Dollar rallying today oil and gold also pulled back which may calm inflation fears a little. While the overall picture remains bearish, I think I've posted enough bearish charts for the watchlist. I am adding a few more bullish charts tonight in case there are still legs here.
Big Pharma and Medical stocks look like they may be the favored "bear stocks" this time and AMGN has come back to retest a major breakout point. The first retest offers one of the safest entries into a stock breaking a downtrend.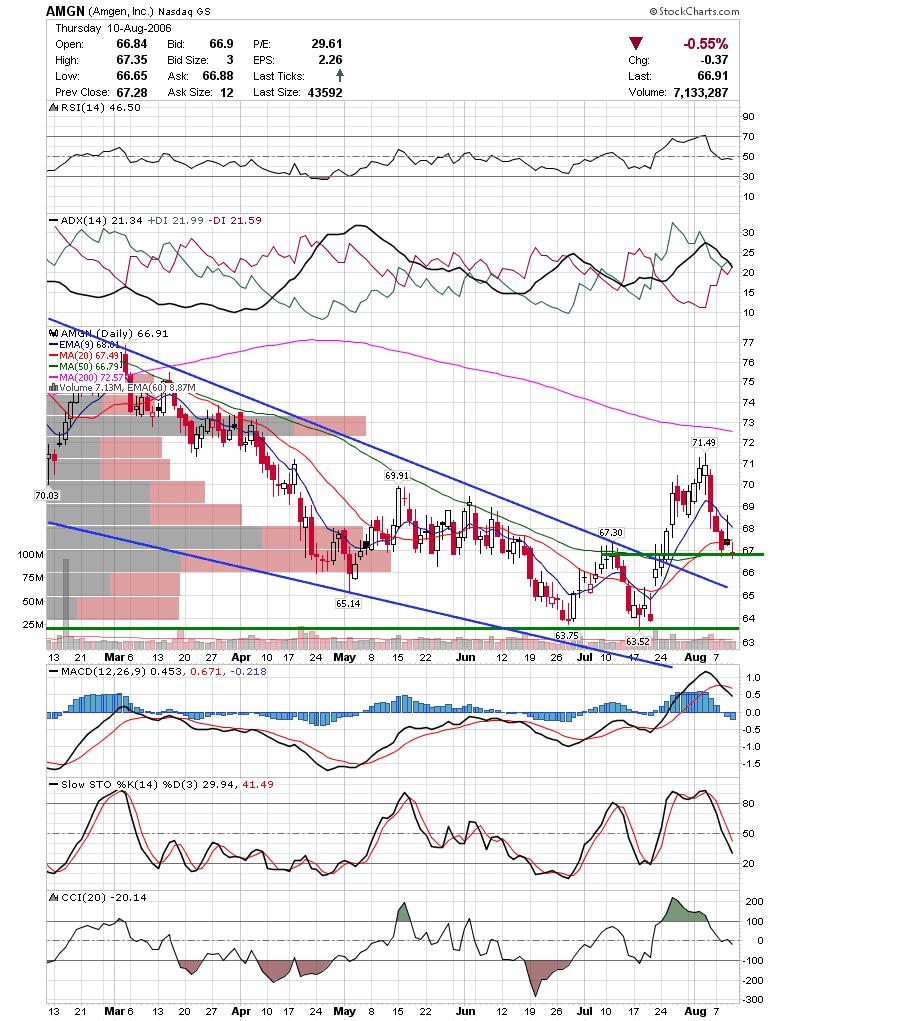 MYOG also recently cleared a downtrend and is trading a flag type base. Watch for a move out of the flag.
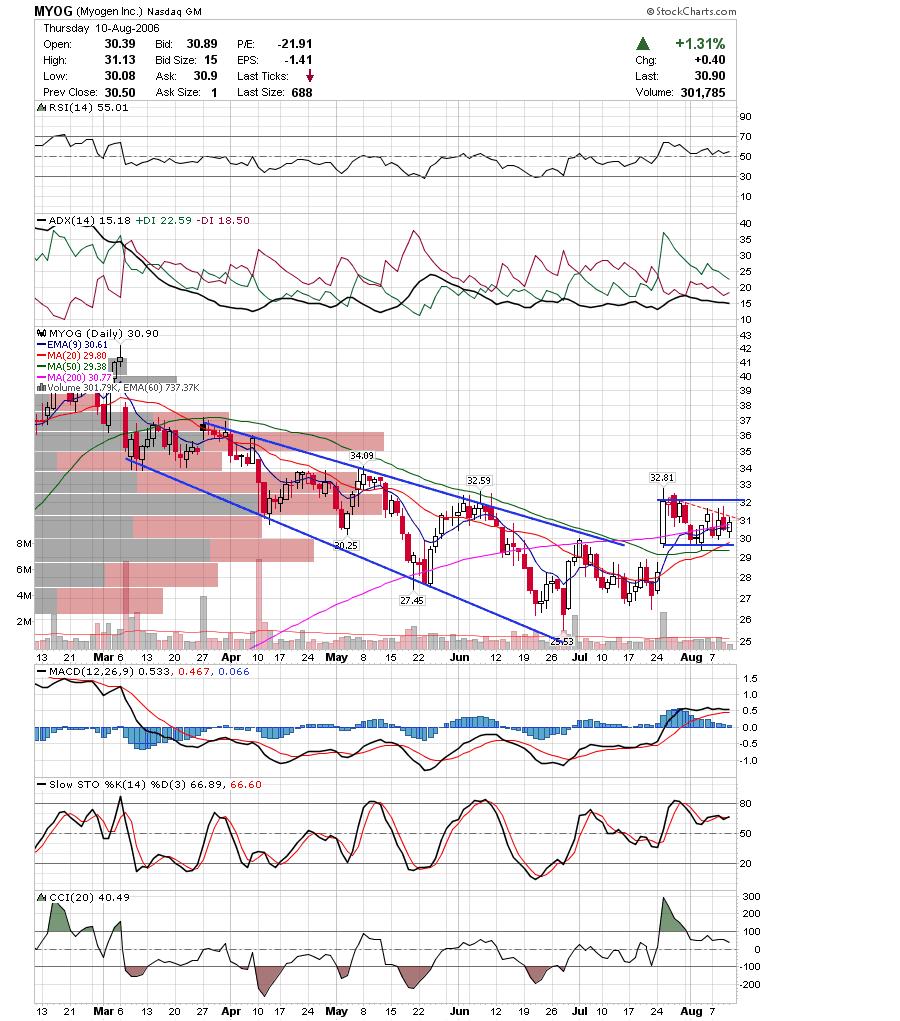 NGPS has been solid this year and is forming a pennant into support.
 ENS may be forming a continuation triangle here.
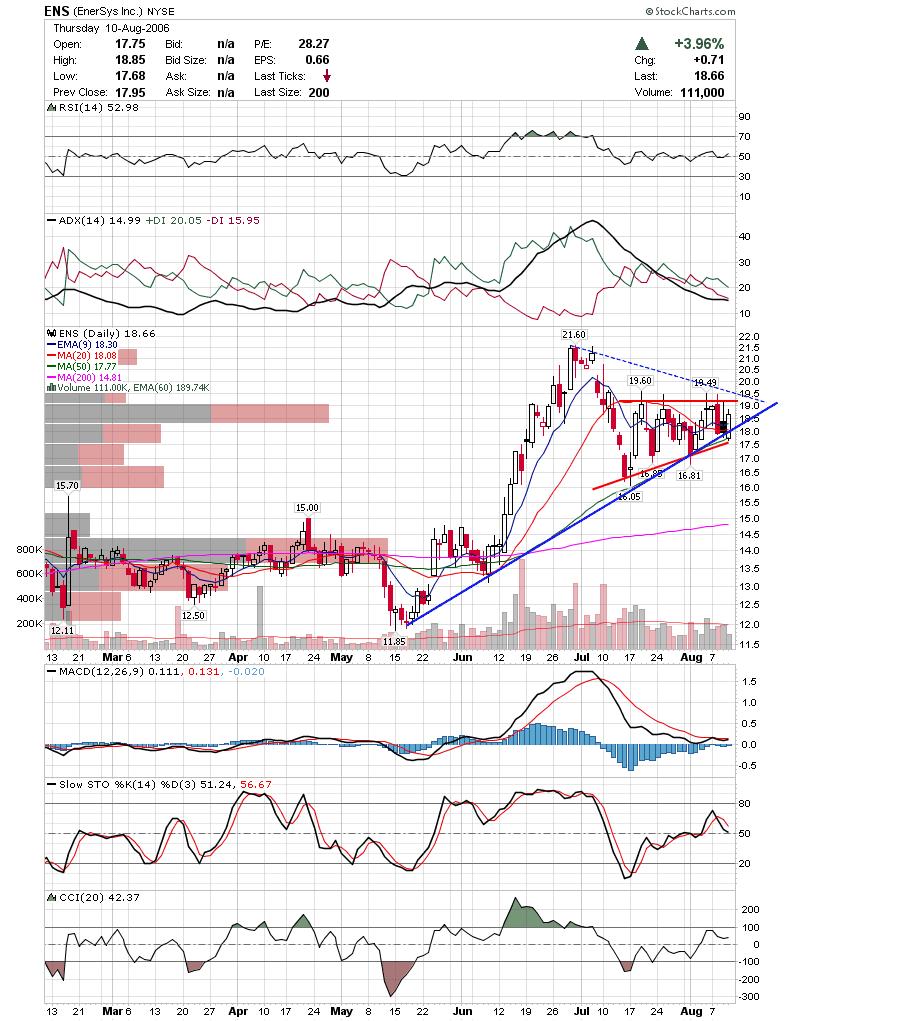 CXW has been narrowing it's trading range and may be ready for move.
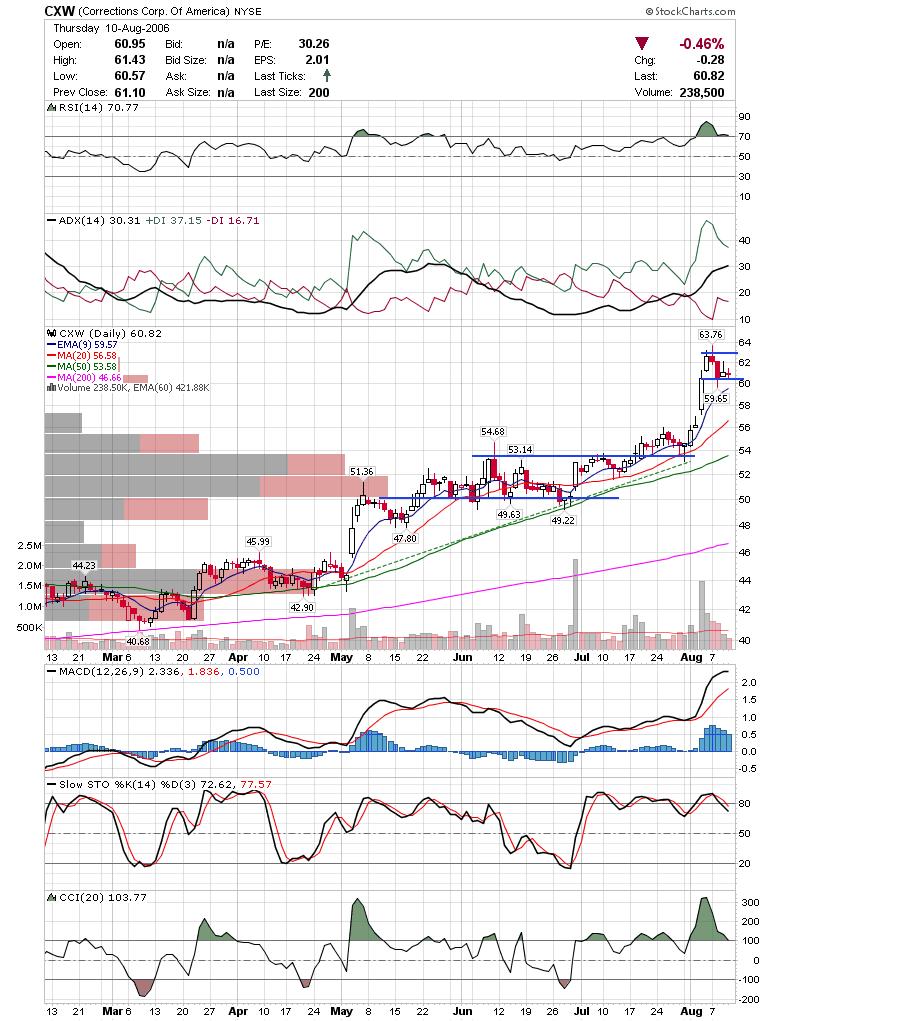 I've had my eye on INFA looking for an entry and it looks like it may clear a cup and handle soon.
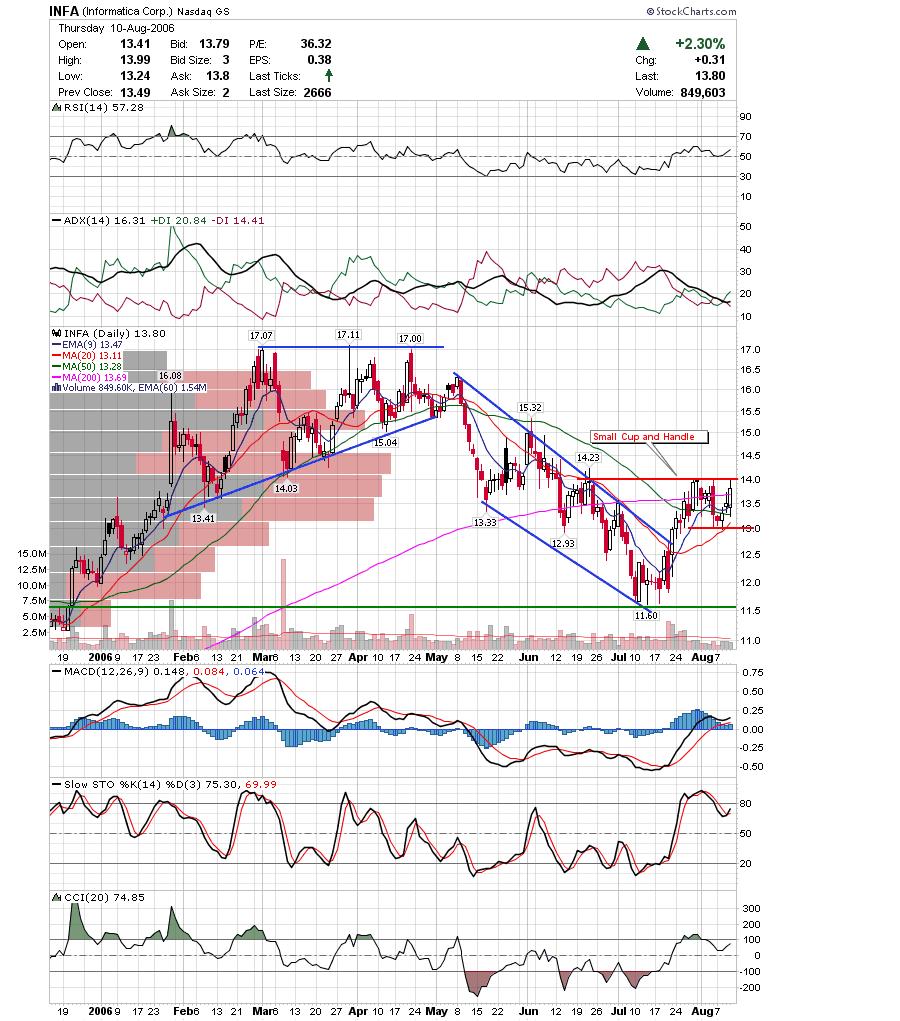 UACL is a member of the transports which have been one of the weakest groups overall. They had a bounce today and UACL didn't participate. That is bearish. Others in this sector worth watching are UTIW,CHRW,CLDN,and XPRSA.
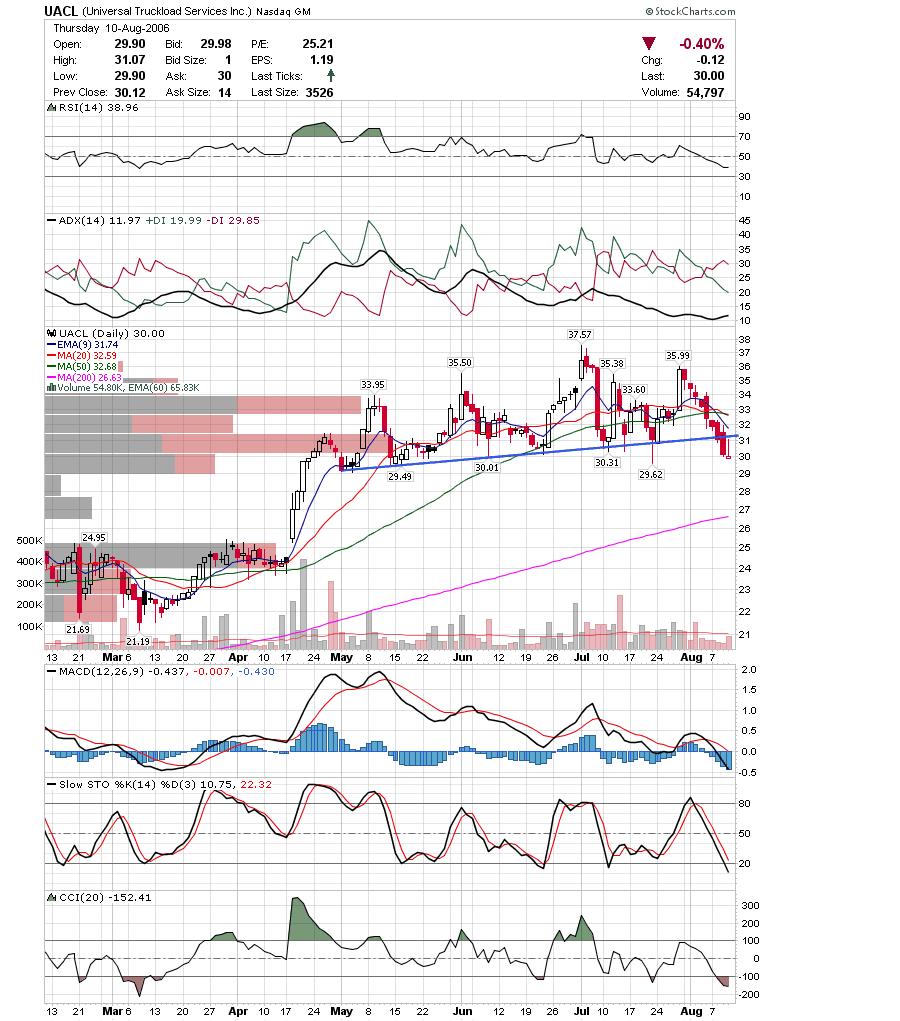 ATI continues to look bearish.
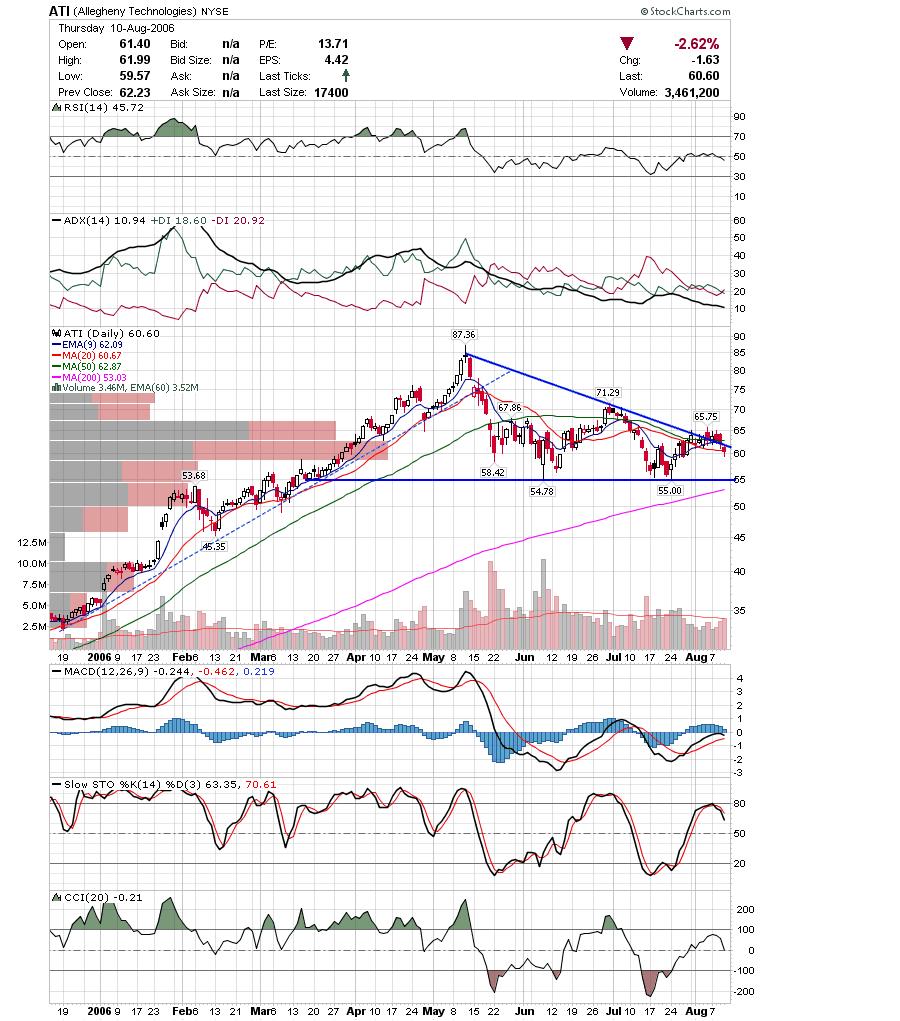
This is once again a dangerous spot for the markets. Adhere to your stops and be patient.
Good Luck,
DT
The SP500 fell back below the neckline of a reverse head and shoulder failng the breakout. If it can't reclaim the neckline tomorrow it might be all over for the bulls in the near term.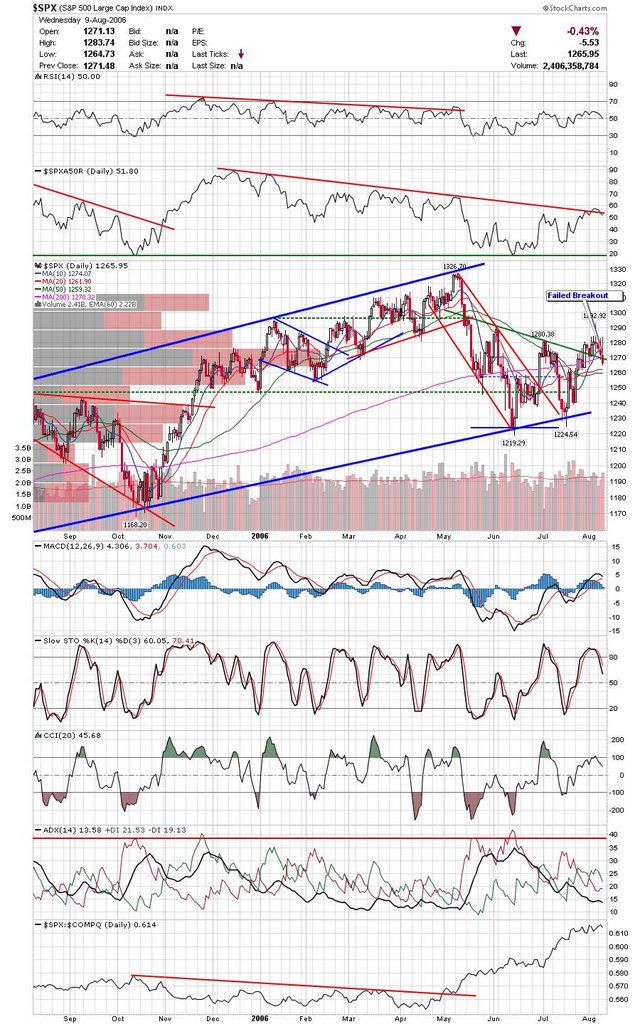 Here is an updated chart on FMD. I still think this thing is headed much lower.
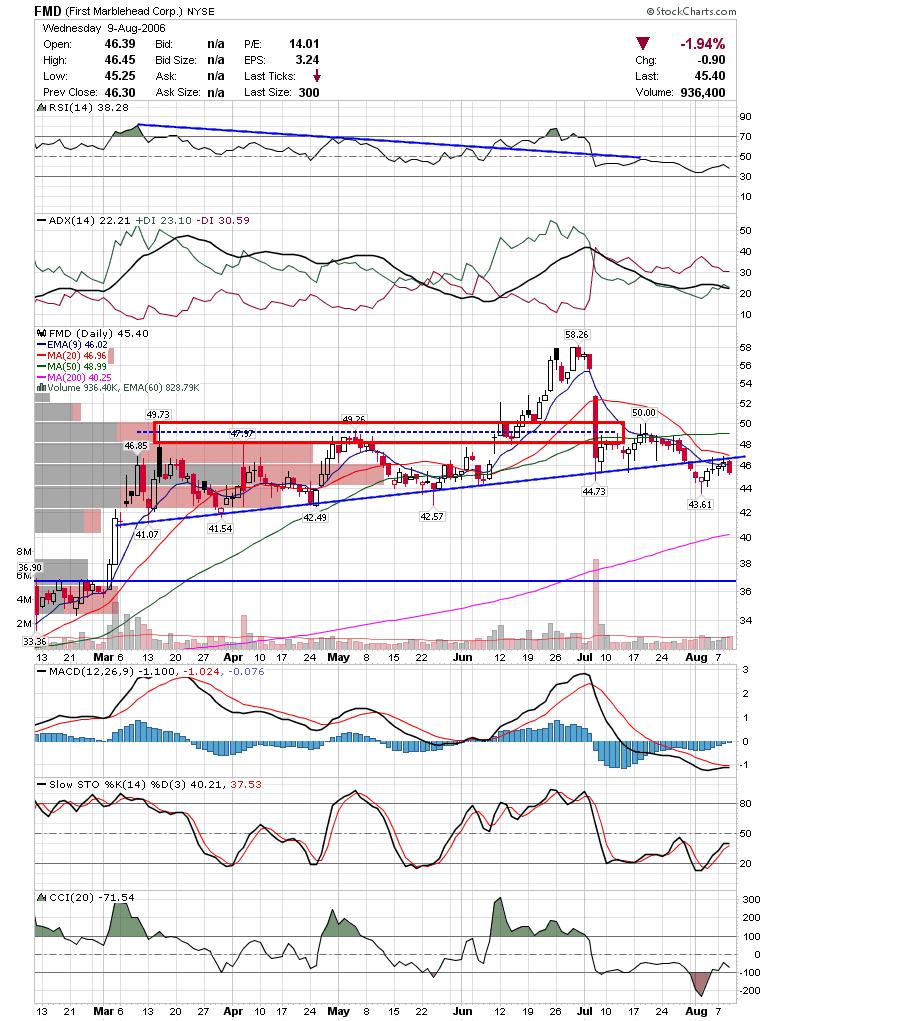 LVS had a nice drop from the trendline break and is now up against major support. Watch to see if it breaks down.
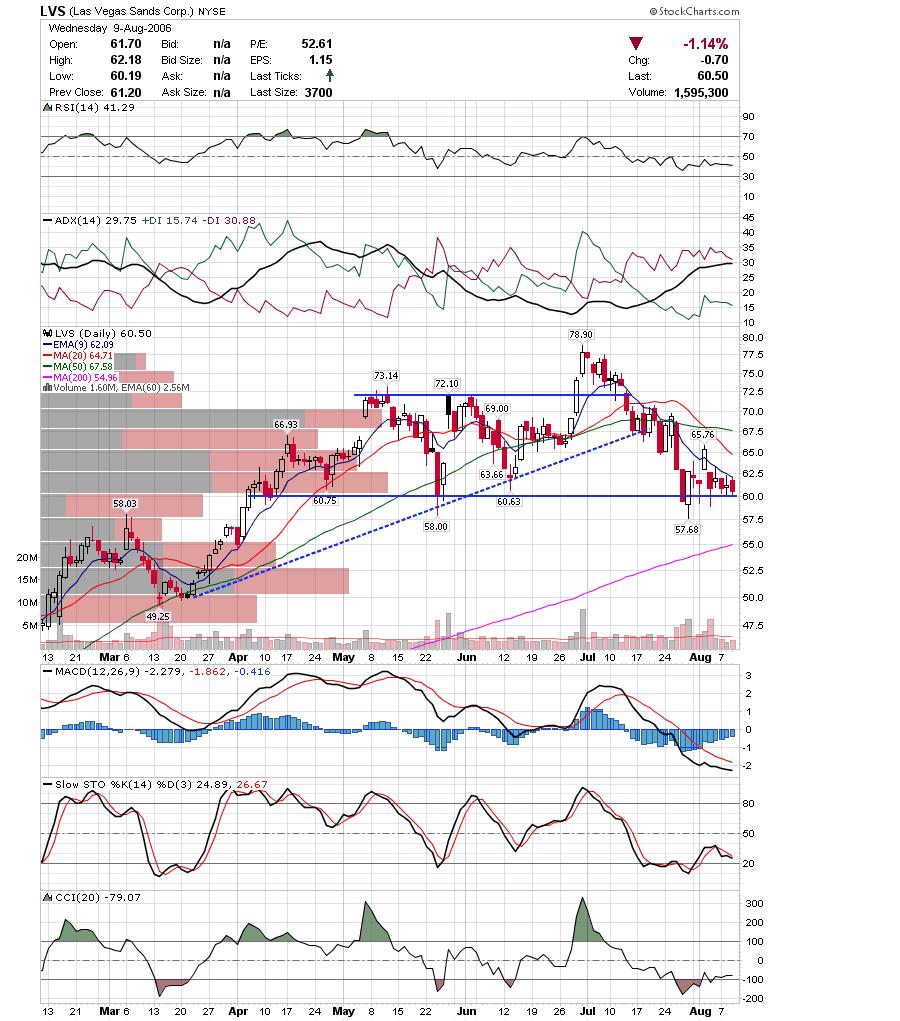 EZPW is one that could go either way. The chart looks bearish but it is sitting on the 50sma and is very oversold.
Thats it for tonight. Good Luck,
DT
The Fed paused today and Bulls could not capitalize on the news. However, bears didn't exactly take over either as the decline was not drastic. It will be interesting to see if the markets follow through tomorrow or if we get a reversal. All of the indices are under resistance and would need a sharp move to reclaim support. There were a couple clues given to us today though. First, smallcaps easily declined more then the other indices by a wide margin. Second, Materials, Industrials, and Consumer Discretionary were the days worst performers. These may be the hardest hit sectors once the downtrend resumes in earnest. Interestingly, Information Technology was up with Consumer Staples as the best performers.
Here is chart of the Russell Index. It is under all the moving averages and looks to have broken a little triangle continuation pattern which is part of a bigger pattern. You can use IWM as a proxy for the Russell for those interested.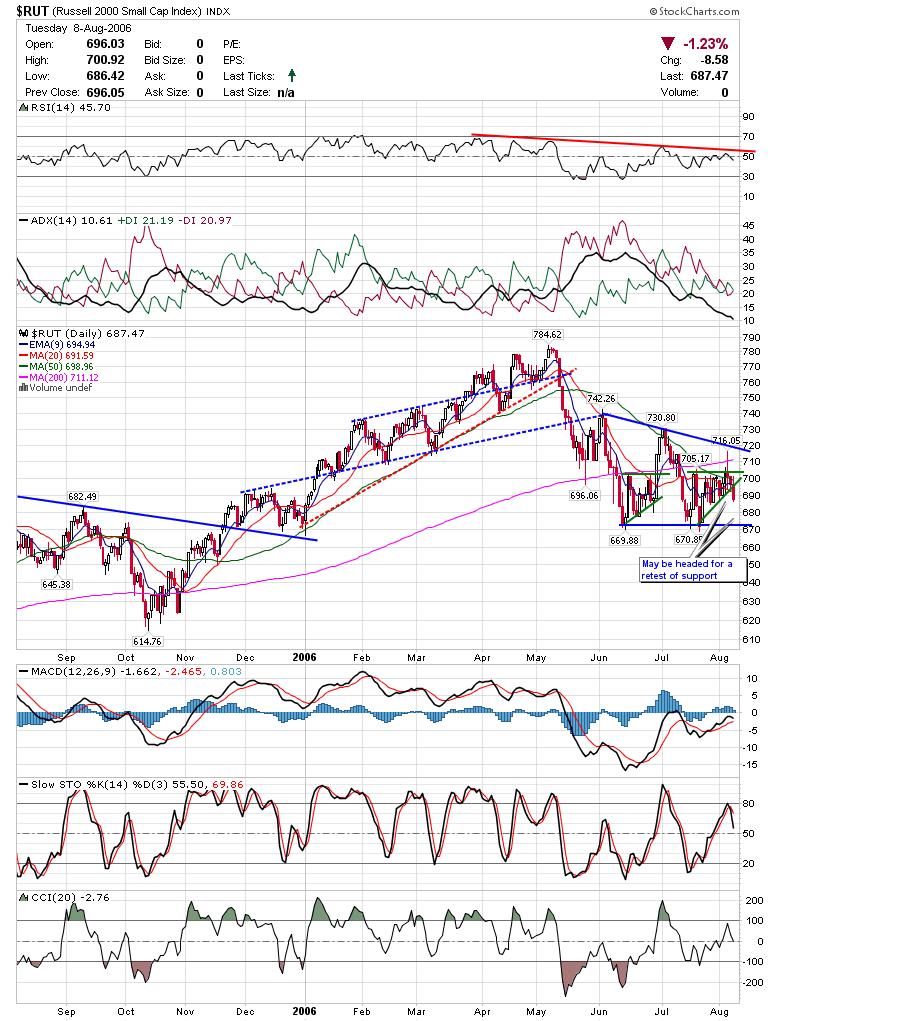 Here is the weekly chart of the Russell. It would probably get ugly really fast if the lower trendline was violated. The ratio charts near the bottom continue to show underperformance by smallcaps vs other markets.
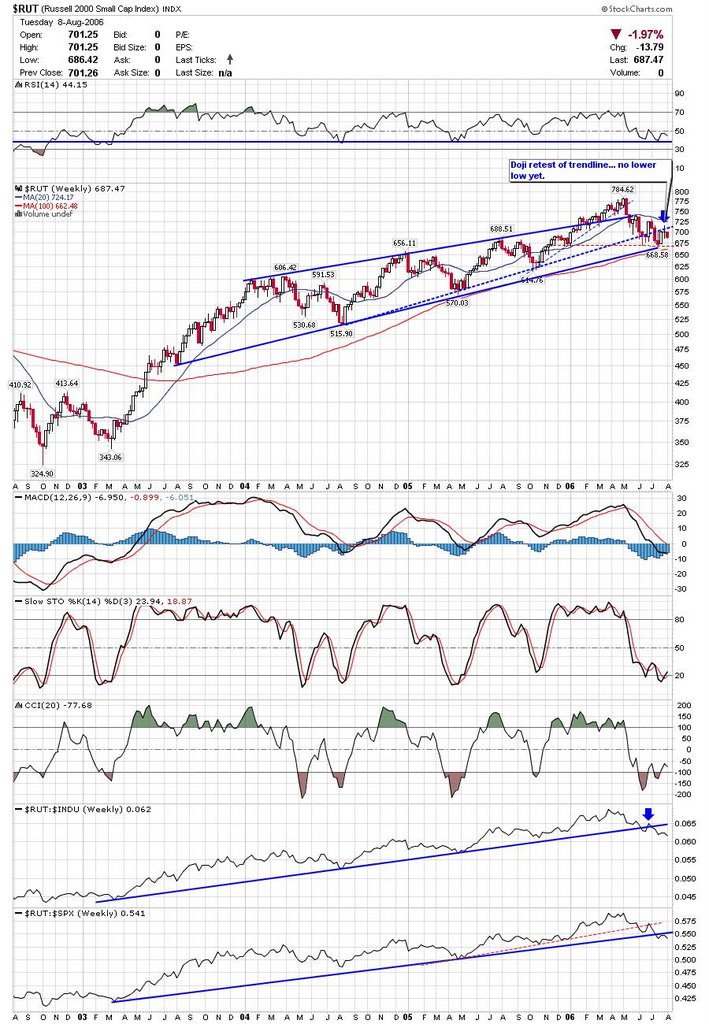 Here is an updated chart on the gold contract. Notice it is walking down the trendline I highlighted last week. It was interesting that the Dollar actually was up today and Gold down with what should of been dollar bearish news. If the dollar tanks tomorrow then gold may get the push it needs.
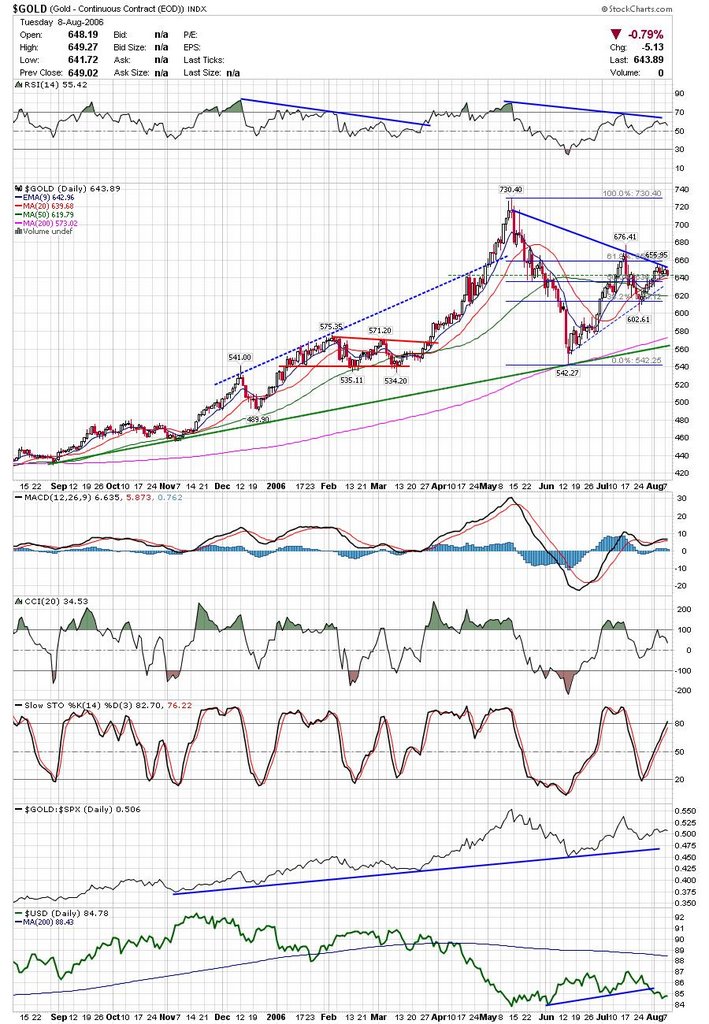 Since the bears didn't take control today, there is a chance that there is a snapback rally tomorrow. It would probably be sharp as shorts rush to cover. Although I doubt any rally would last too long, I would be looking to get some momentum trades in. With that in mind, I am highlighting a few flag patterns. These could offer a quick gain if the markets rally.
First up is Flag's Flag :D.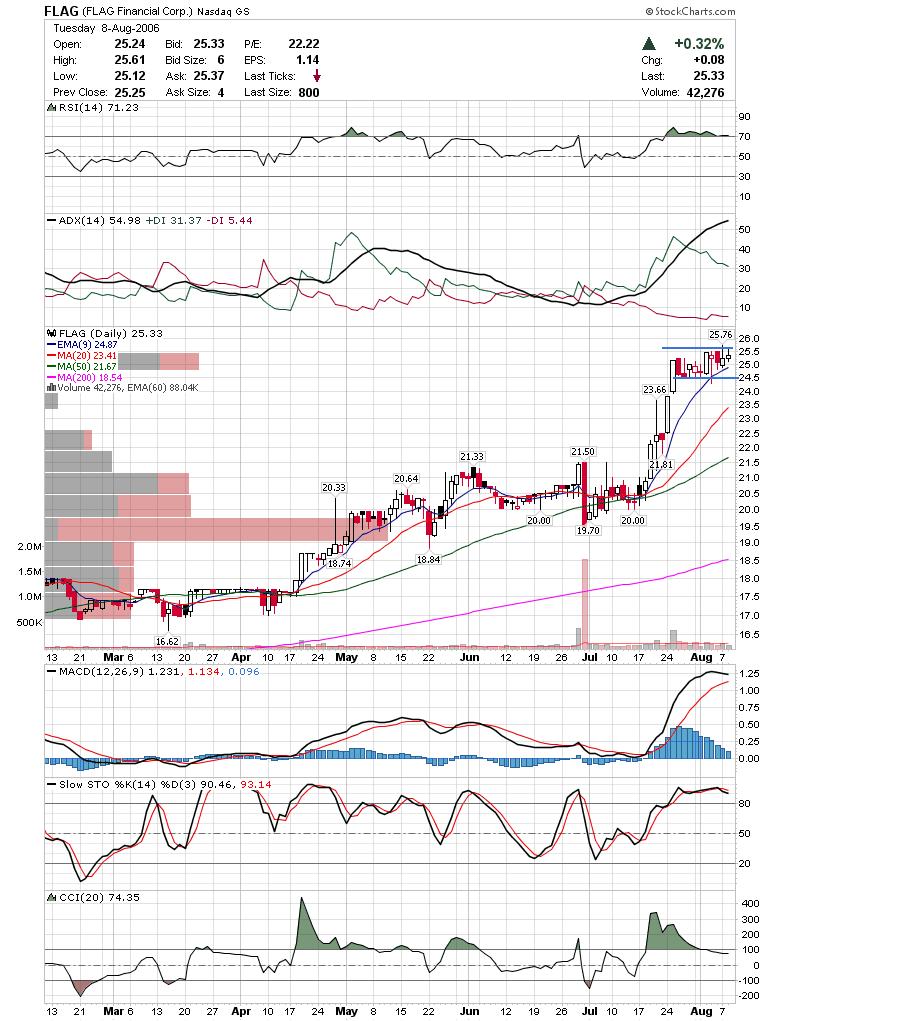 Next is ICLR.
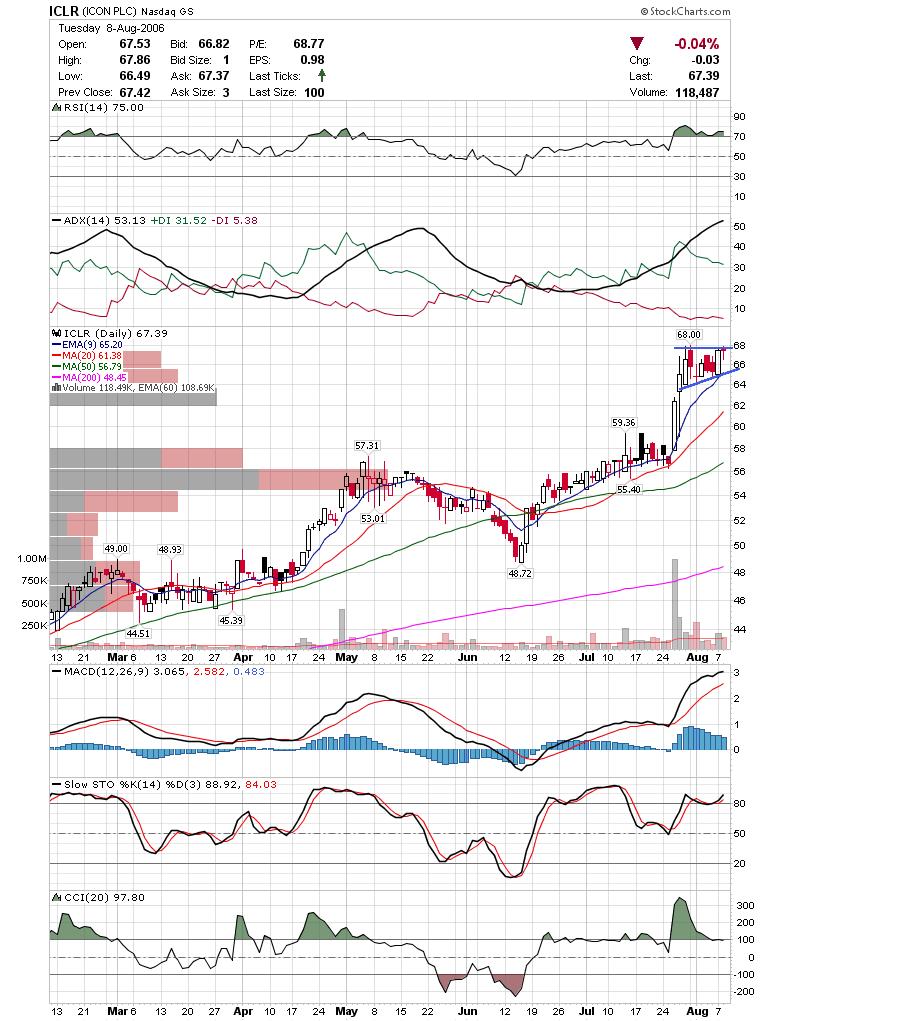 And then IMKTA.
 And if the markets decide to follow through with the next wave down, then I am looking for stocks in sectors such as the ones mentioned above that would suffer in a slowing economy.
BBBY seems to fit the bill perfectly. They are in a downtrend and are being hurt by several factors such as the ailing housing market and now the weakening economy. They broke a huge descending triangle and it looks like they retraced back up to it and failed.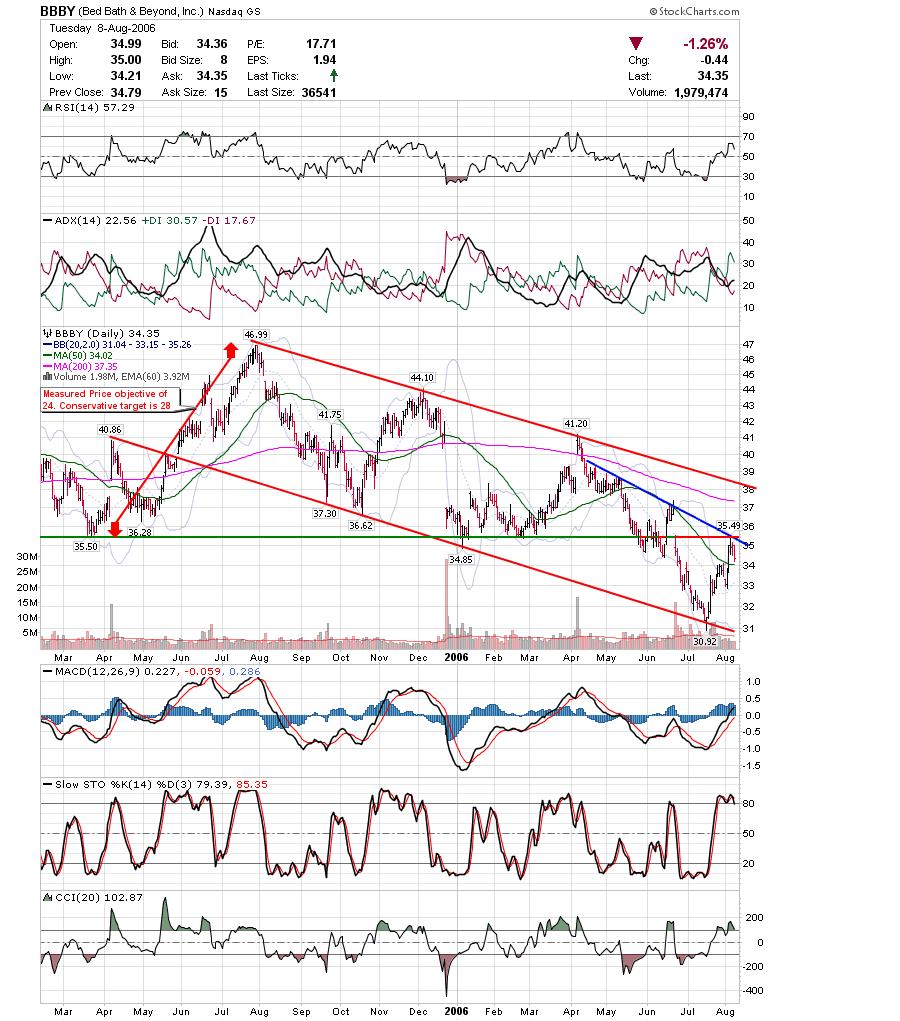 ATI tried to break out of the triangle but it may of been a whipsaw. I would wait for confirmation on this one.
 ODFL is in the transports group and that group has been getting hammered. If they break below the previous pivot low, then I see a trip to the 200sma.
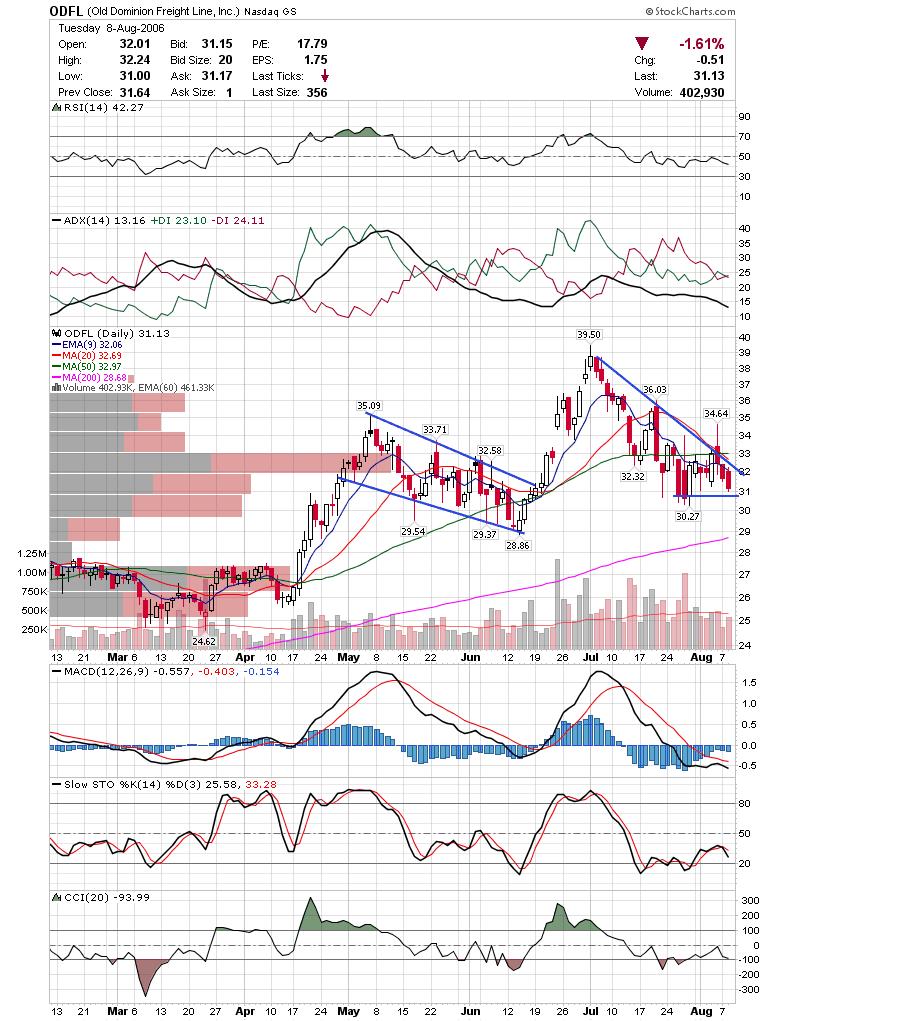 TS looks like a failed breakout and may pick up steam to the downside.
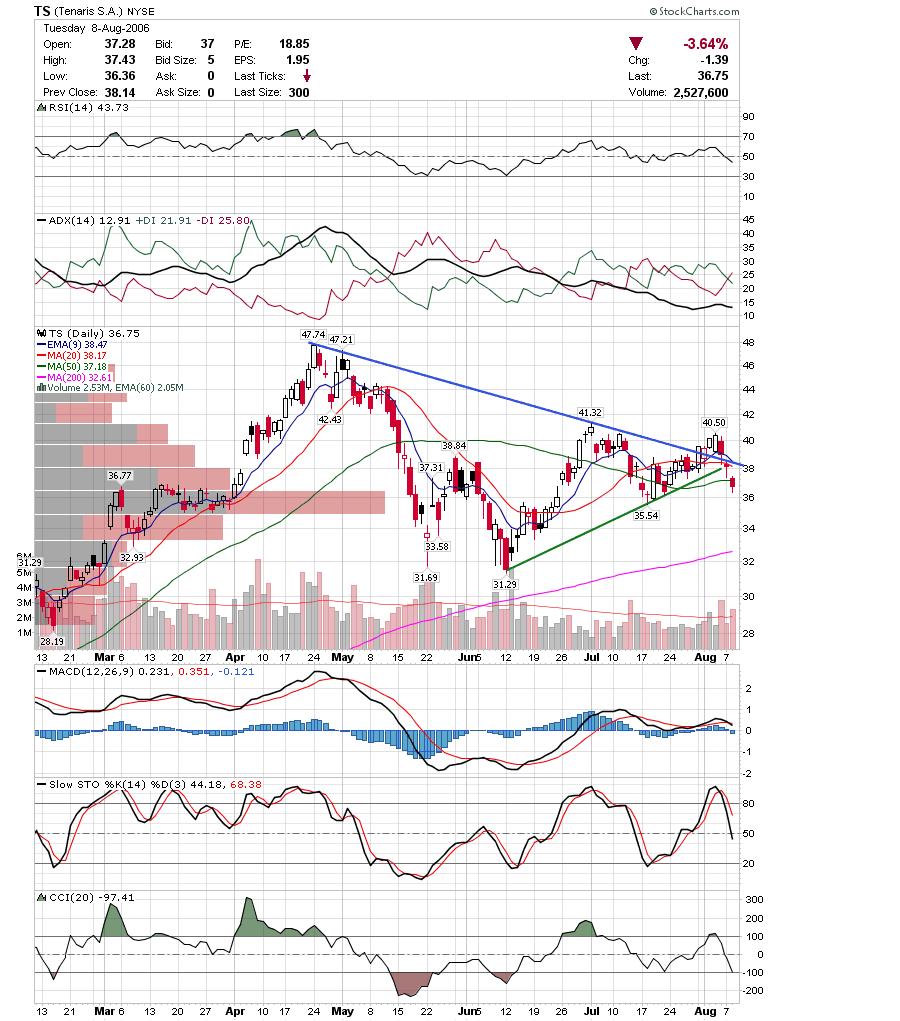
Other shorts highlighted here recently such as TIE, CRDN, and HAL continue to look good to me. Also, TraderJamie has highlighted CYMI and LRCX recently and those look good as well.
Good Luck,
DT
The indices ended down today but volume was low and the action fairly indecisive. All this was expected with the widely anticipated fed decision tomorrow. Although most likely the markets won't make a move until after the minutes are released, there is a chance they start moving right away. If you recall the last meeting, the markets were moving higher and kept moving higher after the meeting. It wasn't till the next day that the move was faded. With that in mind, here are a handful of charts worth watching.
GOL is up against a descending trendline and will probably test the 200 sma if it fails here.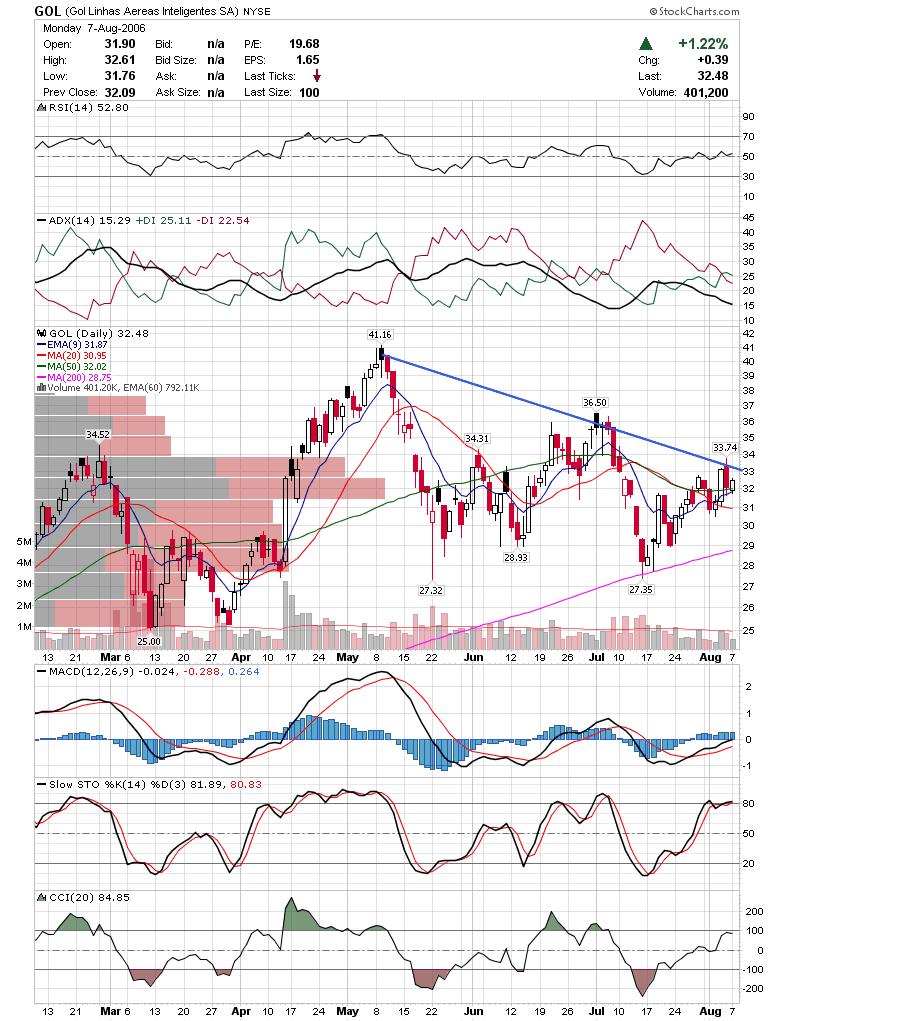 TIE has been one of the great movers this year, but has been stuck in this descending channel. It is up against the upper trendline and showing some weakness. Slow Stochastics has crossed over under 80 possibly showing a failure to gain momentum.
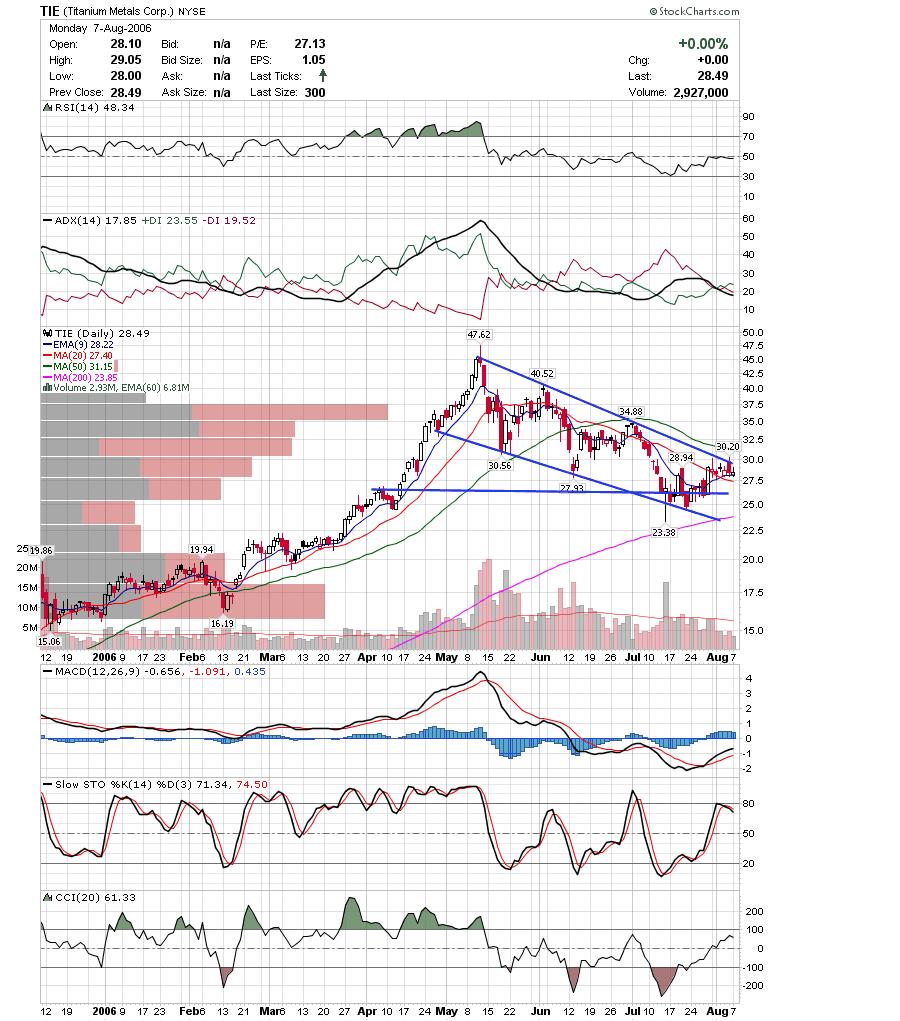 KOMG has been trying to hold the lower trendline but is up against some pretty stiff resistance here. It will probably fail without the help of a rally in the Nasdaq.
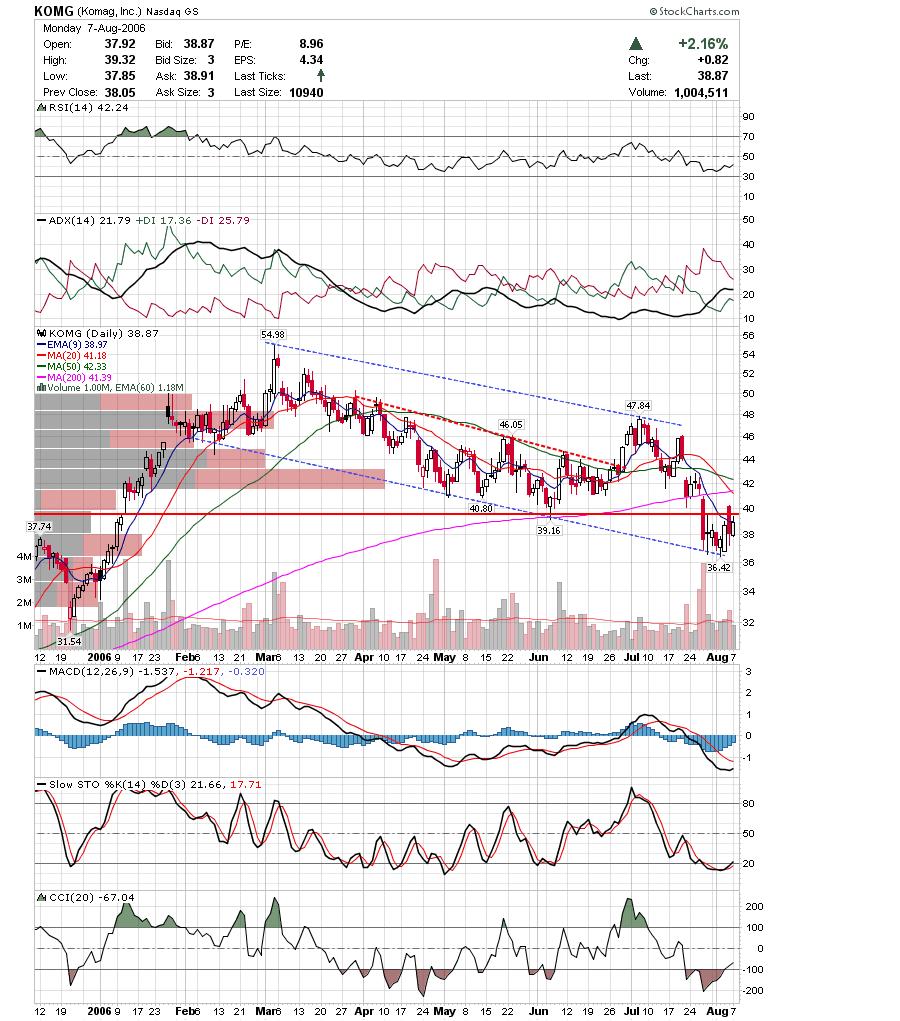 ALJ is one of the better looking bullish charts I am seeing. They reported earnings after the bell and there were no trades, so not sure how it will go tomorrow.
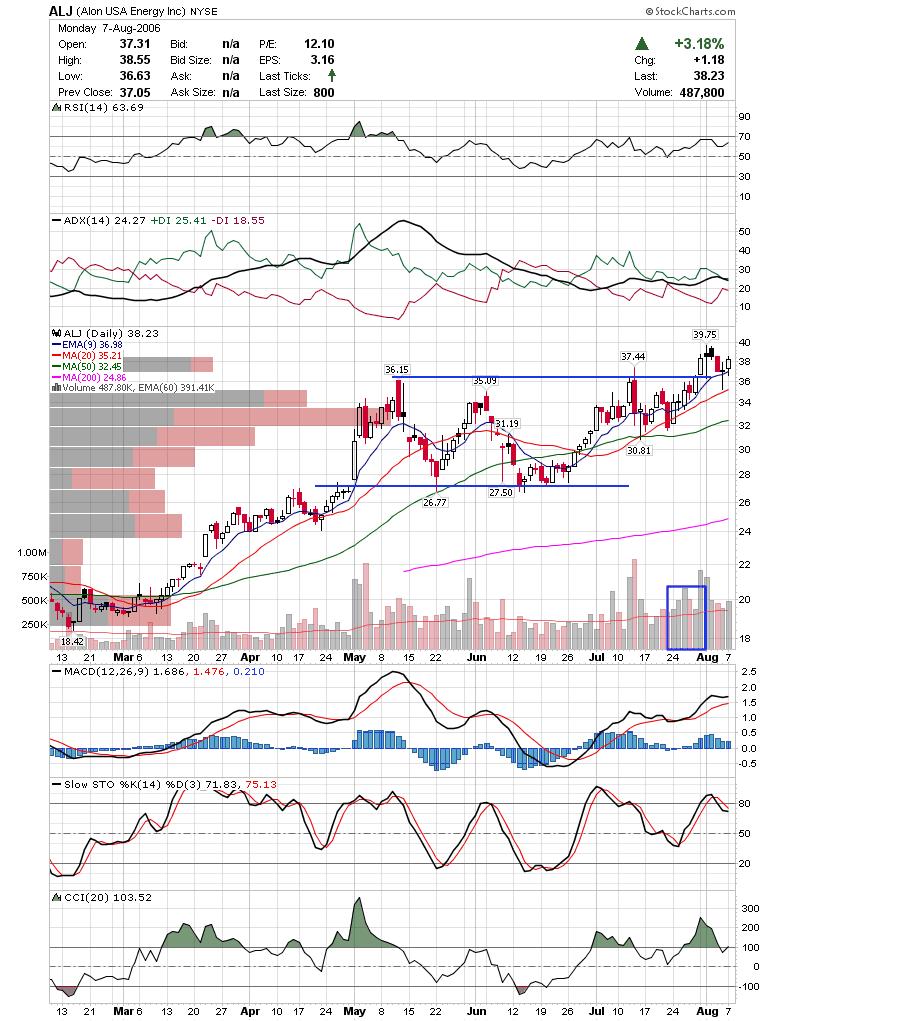
Good Luck,
DT
Tonights update is a little different then the usual Sunday night watchlist. I don't think it makes much sense to enter any swing trades until after the fed announces their decision in a couple days. A lot of people are looking for the much anticipated pause and hoping a rally will occur. I am a little suspect of any substantial rally at this point, although I would be more then happy to participate if thats what occurs. I think the next substantial move will be down although I am open to the possibility of some more life in the summer rally. What I decided to post tonight was some of my sector charts, some of which are still under development. There is a good chance that commodities are topping and there may be some good money to be had on the short side.
Here is a chart that shows three of the four markets. Bonds, Stocks, and Commodities (Currencies are ommitted). The normal market cycle is for Bonds to rise first, then stocks, then commodities. Bonds are then the first to peak, followed by stocks, and then commodities. The purpose of this chart is to show the three markets together to see which is outperforming and to identify the rotation. I highlighted with arrows the previous market tops and then the current possible tops. I think it's clear that bonds peaked already. The question is whether stocks peaked already and if commodities are then following. Here is a chart of the $crb and the dollar index. While the $crb is still comfortably in an uptrend, notice it failed to reach the upper Bollinger band after bouncing off the mid point and 39 week ema.
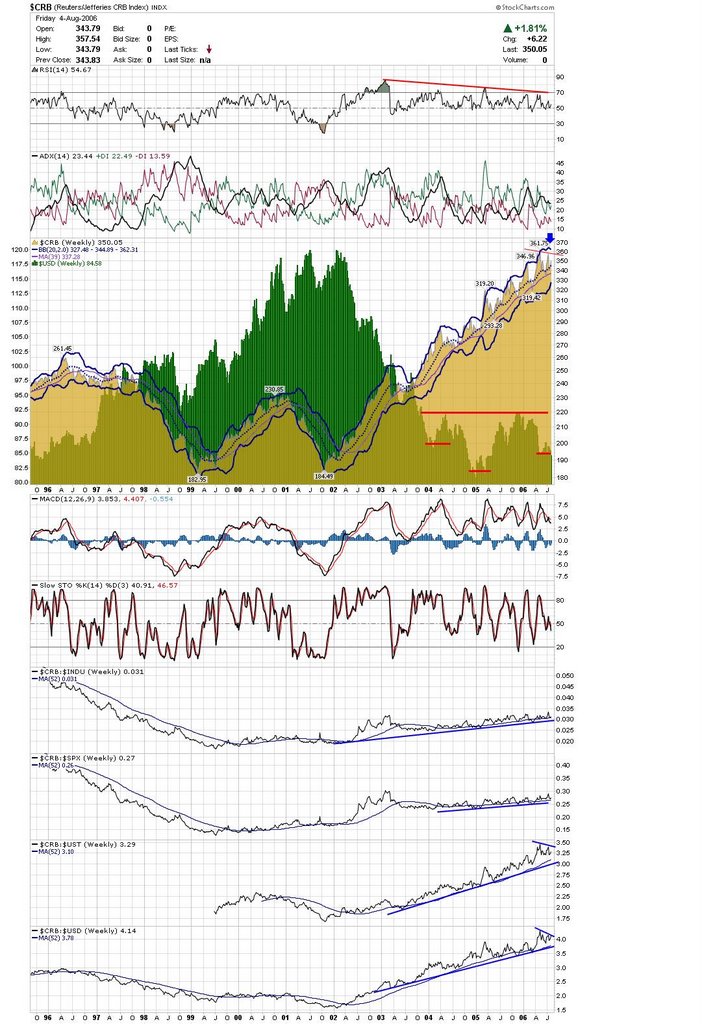 The following are some etf charts.
Here is the $osx which is looking pretty similar to the OIH. Oils stocks are still looking weak to me and are ripe for a correction after this last bounce higher. Retailers may have a "whipsaw" rally after breaking support and then bouncing back. I think ultimately this rally will fail.
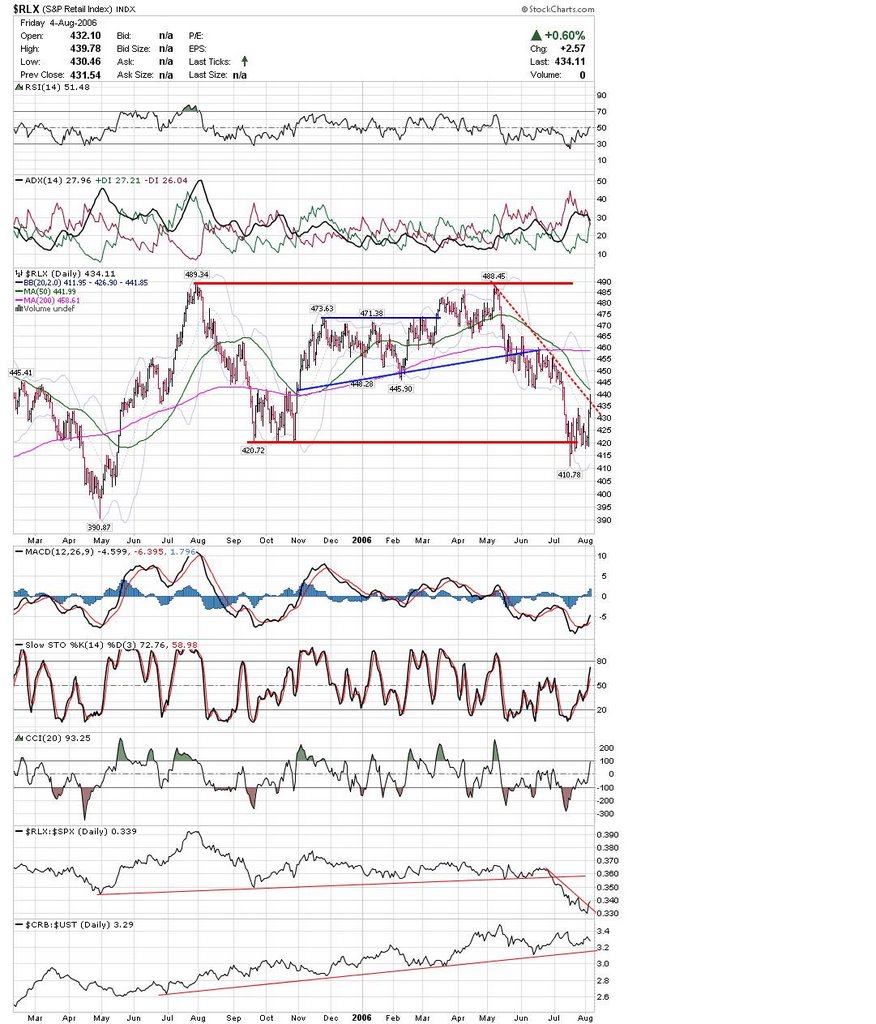 Natural Gas is one the only energy related areas that looks bullish to me. Here is the $XNG coming back to test support. While there is always the chance this is a failed breakout, the path of least resistance is still up.
 Here is OIH. The last leg up failed to make a higher high and the possible head and shoulders top is still in place. With the mess in the Middle East and hurricane season upon us, you would think the Oils stocks would be going crazy. Since they are not, you have to wonder if the big boys are selling into every rally?
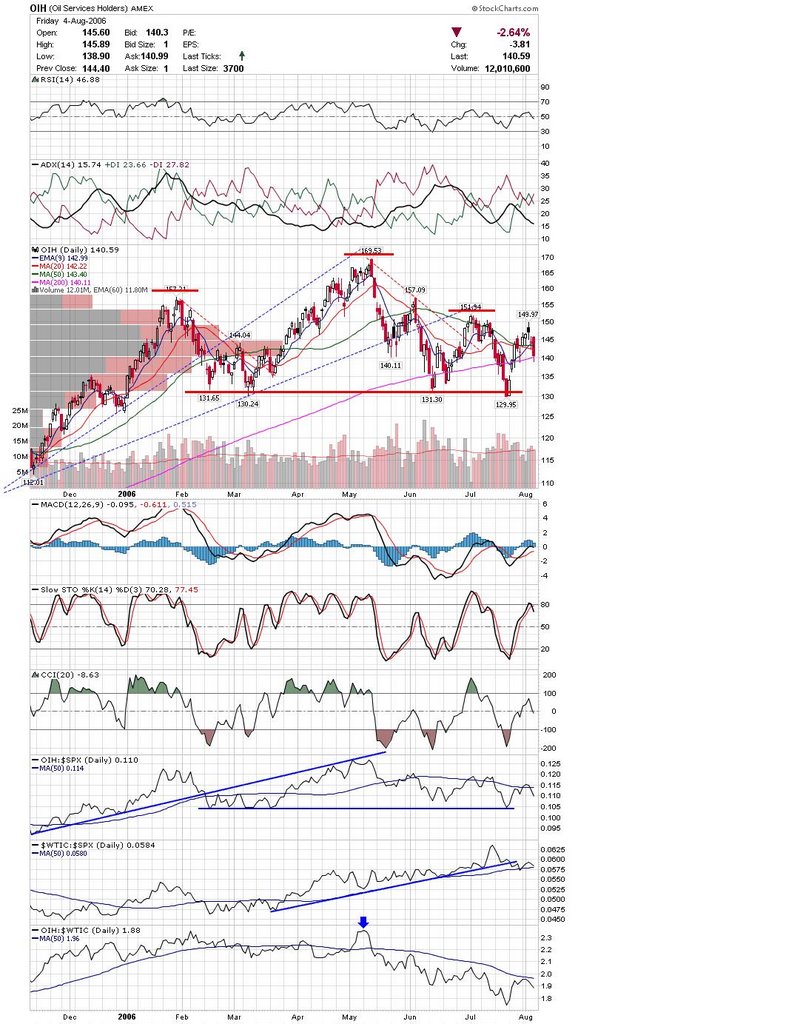 Here is the Brokers which are also looking good. They may pull back here if the market downtrend resumes, but they should hold up better then other sectors.
As I mentioned before, the Fed meeting should be a market moving event, therefore I am not entering any new trades, and as a matter of fact, I only have one trade open right now (Short HAL). The Fed pausing acknowledges that the economy is weakening and can't weather more rate increases. Eventually this will show up in corporate earnings and in turn impact the markets.
Good Luck and Good Trading,
DT


