It was a lackluster day after the fireworks of the past two days, but it is to be expected after all the magnitude of the past few days worth of gains. As Mike points out, most of the indices are already overbought or near overbought which points to consolidation at a minimum. Aggresive traders can short into a pullback with the realization that a rally can resume at any point. It really is a tricky time to trade with counter rallies spurring short covering in a bearish environment. You can add the elections as a possible reason for a rally at this point according to both this article and this one. That being said, I am posting a few shorts below in the case that this rally is over.
CYMI has worked it's way up to the descending trendline as has some indecisive action there. For those of you that suscribe to the "max pain" theory, max pain for CYMI is 40, so it will be interesting to see if it gets taken down tomorrow.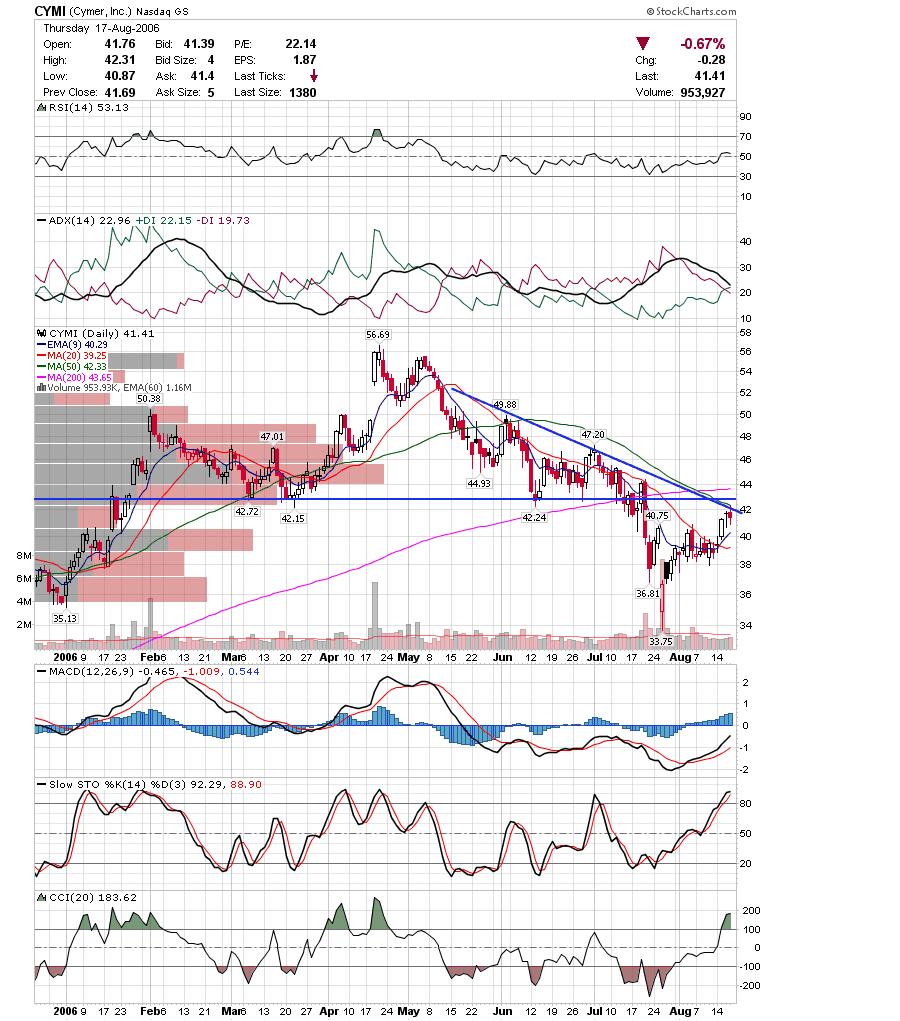 Much of the same here with ATHR, except we have a nice shooting star. Max pain is 17.50 for ATHR.
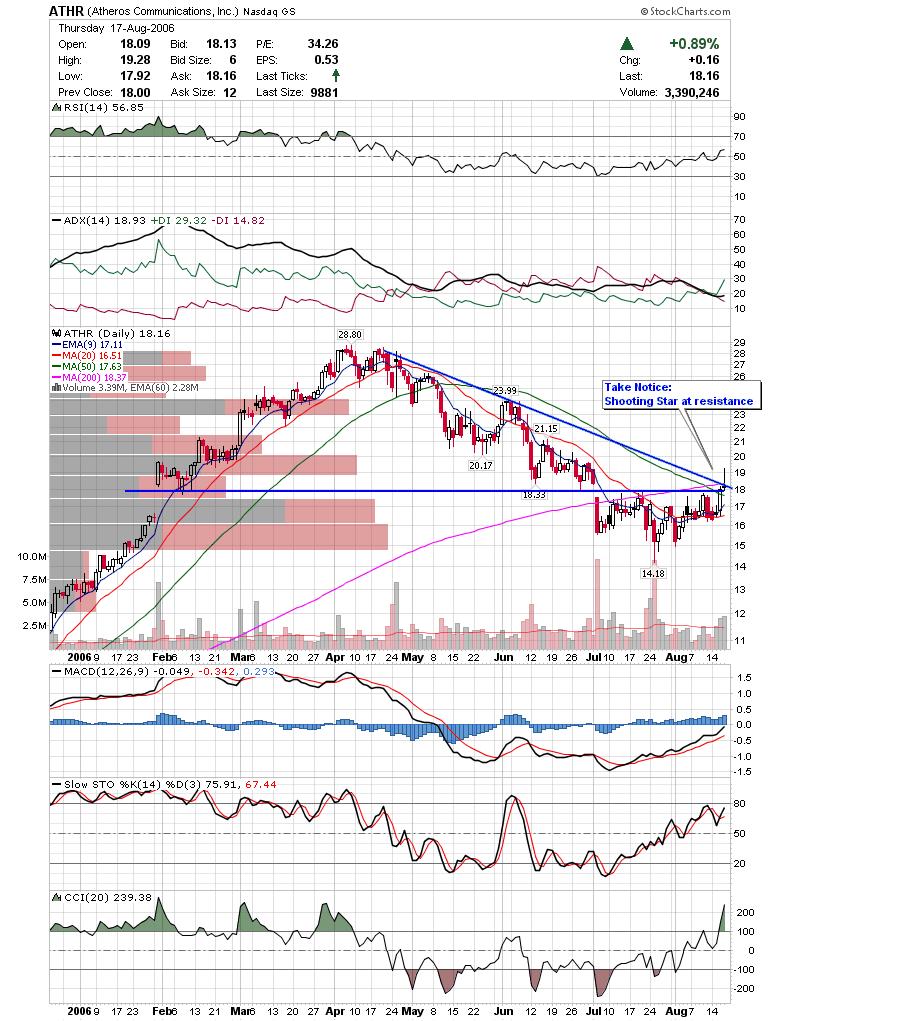 NTRI is working it's way sideways under resistance. It could fall apart when it runs into the descending trendline in the next couple of days.
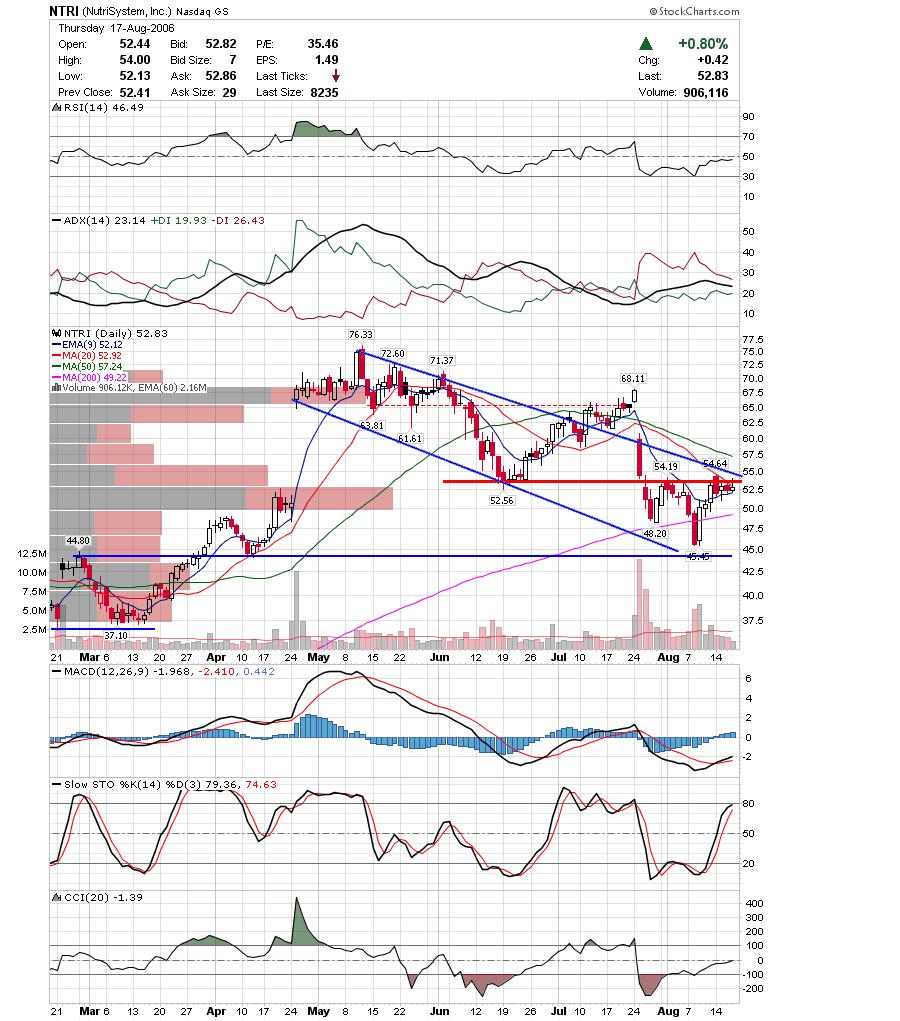
Good Luck to those trading tomorrow and have a nice weekend.
DT
One of the biggest advantages of being a short term trader is the ability to switch sides quickly. While I've been expecting the markets to continue the downtrend, it doesn't make a whole lot of sense to fight the tape. I had been expecting a summer rally and maybe it is just a little late. Whether this is a real move, options games, oversold bounce, manipulation, it doesn't really matter, because lots of money can be made to the long side on days like this. The other nice thing is that there will be some great short entries when this is all over.
Here is a chart of the SP500 showing the breakout that I thought failed. Interestingly, the target for the reverse head and shoulders takes it to new high territory.
Here is a chart of VIVO which was a great short for me. I am keeping an eye on it as it may set up for a nice short entry in a day or two. Same deal with KOMG. Another two or three days of rallying would be ideal.
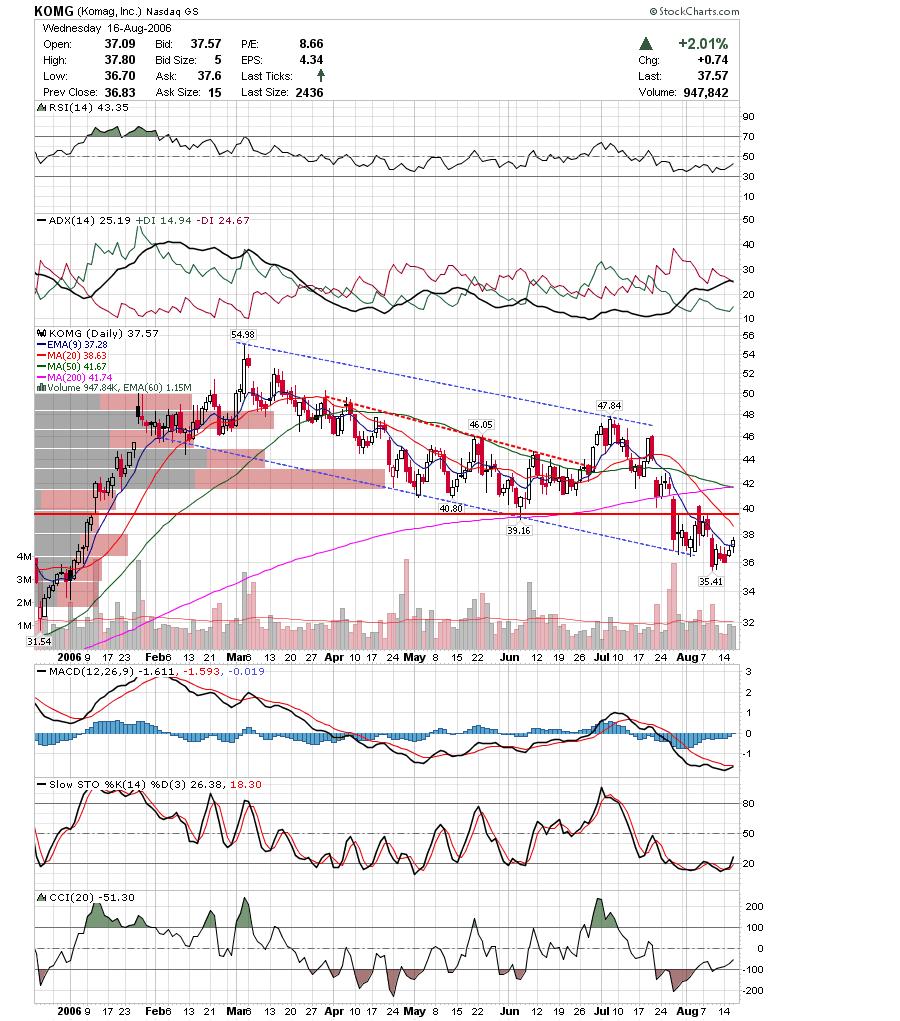 Natural Gas stocks have fallen a little off the radar but the sector still looks good. Here is CHK's weekly chart. It is wedged between two previous trendlines.
 TRMB had a nice reverse head and shoulders breakout and may now be ready to clear the entire base.
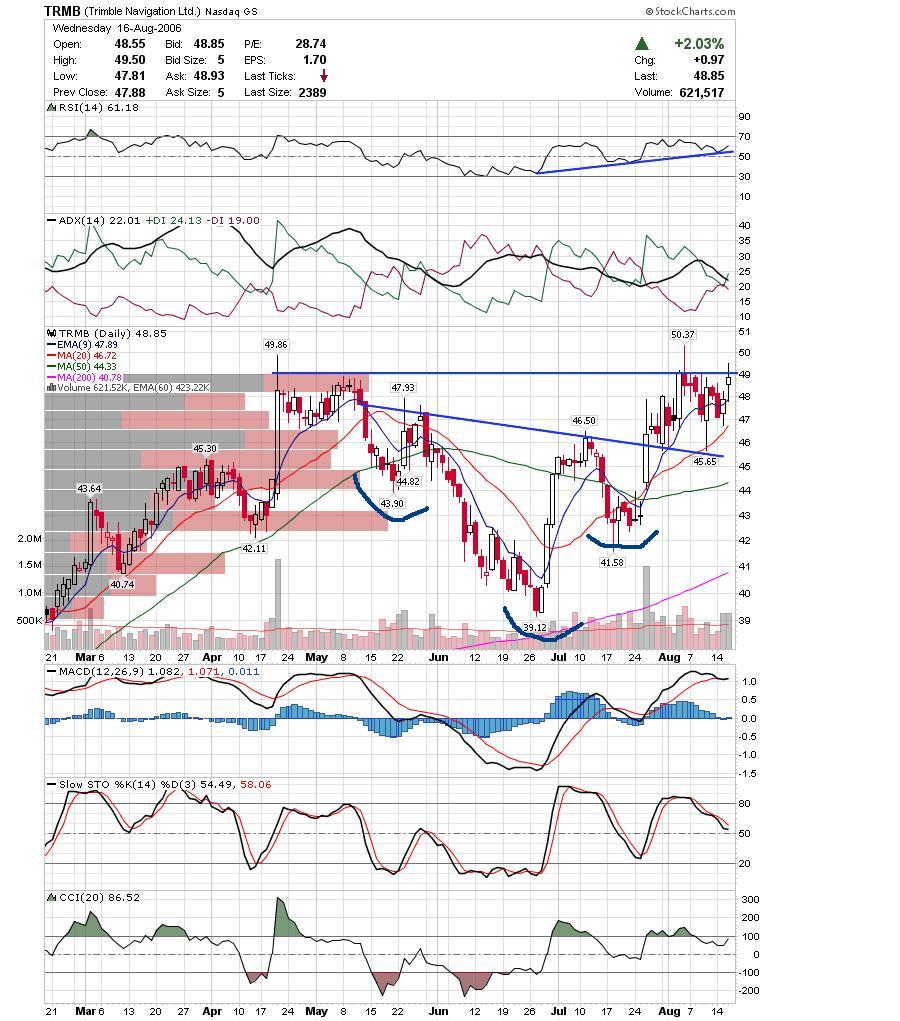 TNL looks like it is clearing this small consolidation.
 ICE appears to be breaking out of a triangle reversal pattern.
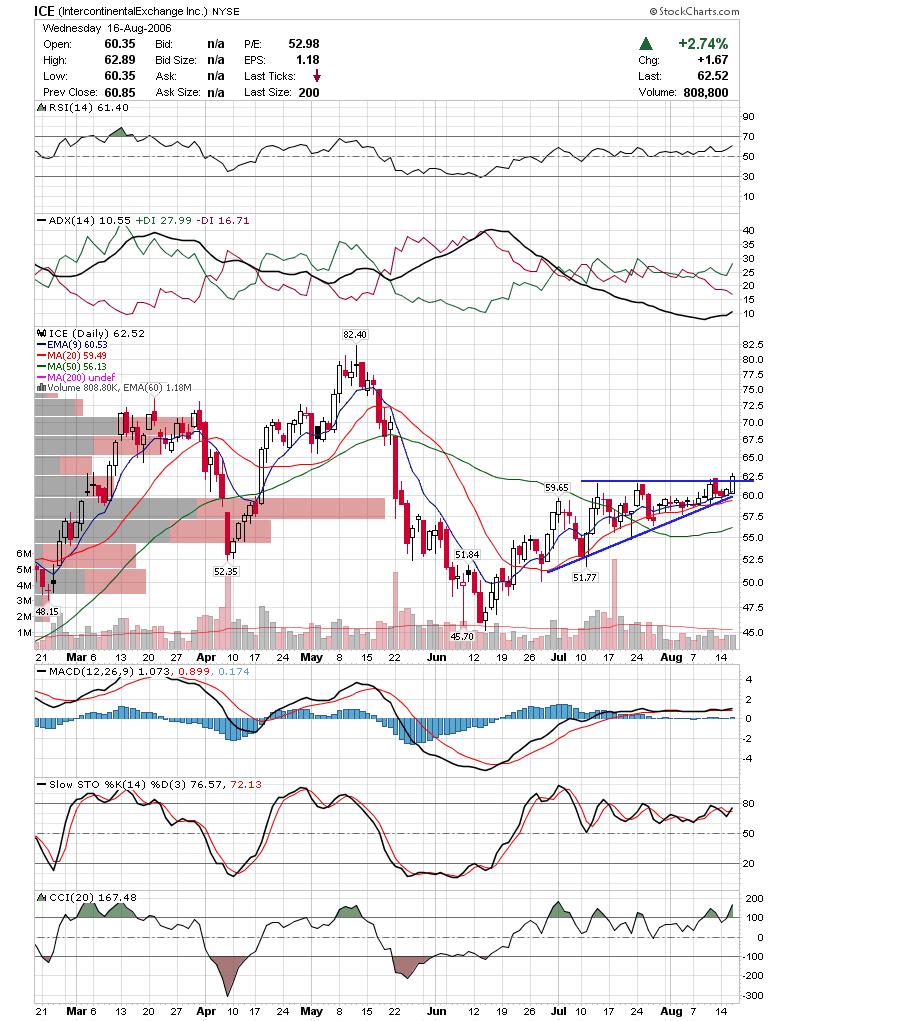
Keep in mind that options expire on Friday and may bring a counter move. Also, I would be a little wary of trying to chase tech stocks after 2-3 days of rallying.
Good Luck,
DT
It was a very perplexing day as the markets gapped above the highs of yesterdays long wicks and maintained above yesterdays highs as they consolidated and then closed at the highs. It will be interesting to see how they react to tomorrows inflation and housing numbers. Keep in mind that this is options expiration week and I wouldn't dismiss program trading trying to jockey for position kicking in already. With that in mind, todays action was decisively bullish and there is a chance for a follow through tomorrow. Tomorrow could be tricky so it's best to wait till after 10 before initiating any new positions.
Here is an updated chart of CXW which I think gave a buy signal yesterday.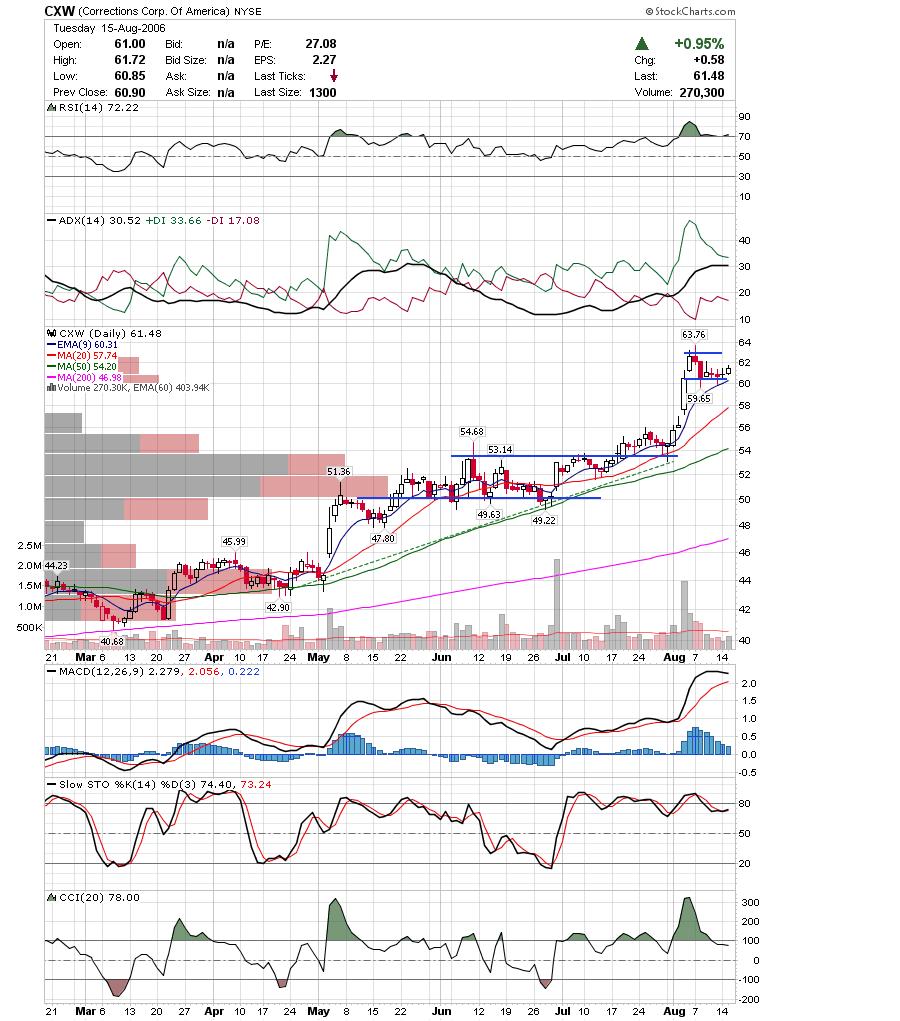 INFA continues to look bullish here. You could classify the chart pattern as a cup and handle or reverse head and shoulders with a close above 14.
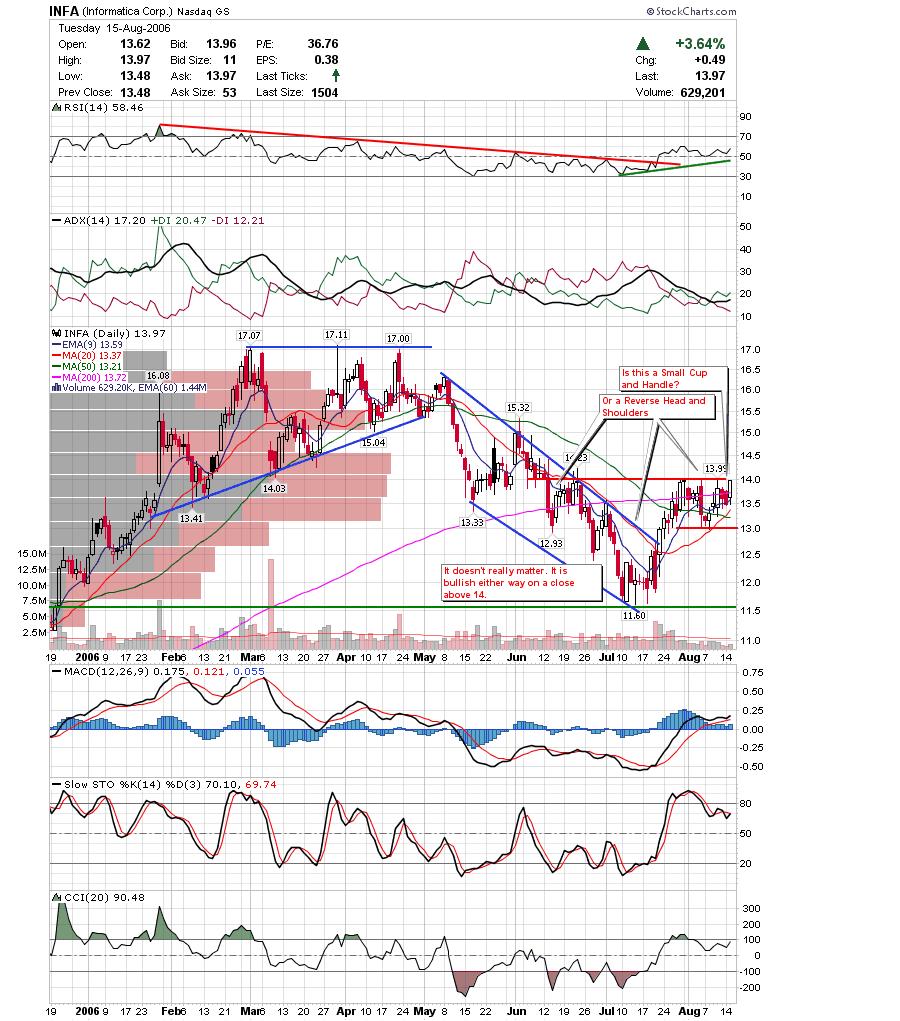 HANS tagged the 200 yesterday and reversed, followed by a bearish engulfing pattern today (on a strong day no less). Looks pretty weak to me.
 BWNG successfully cleared the downtrend and looks to have cleared a bull falg consolidation.
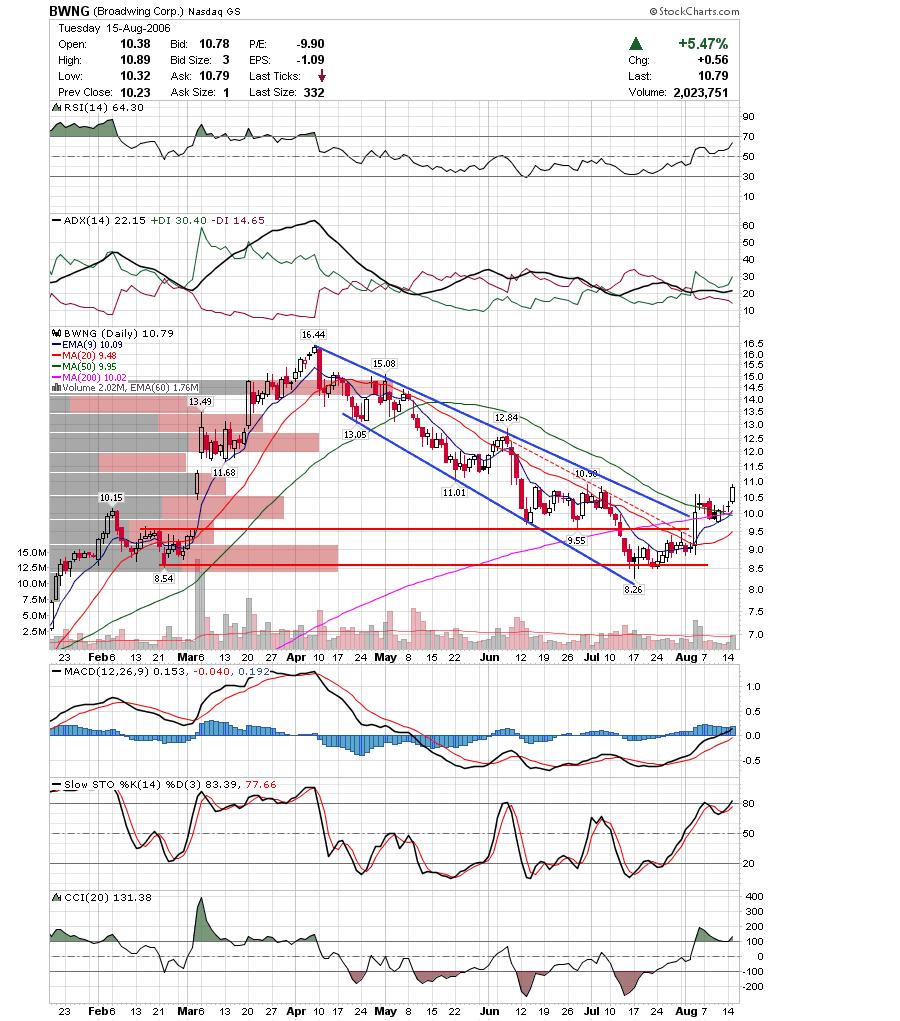
This is a similar chart for MYOG, except it hasn't cleared the Flag yet.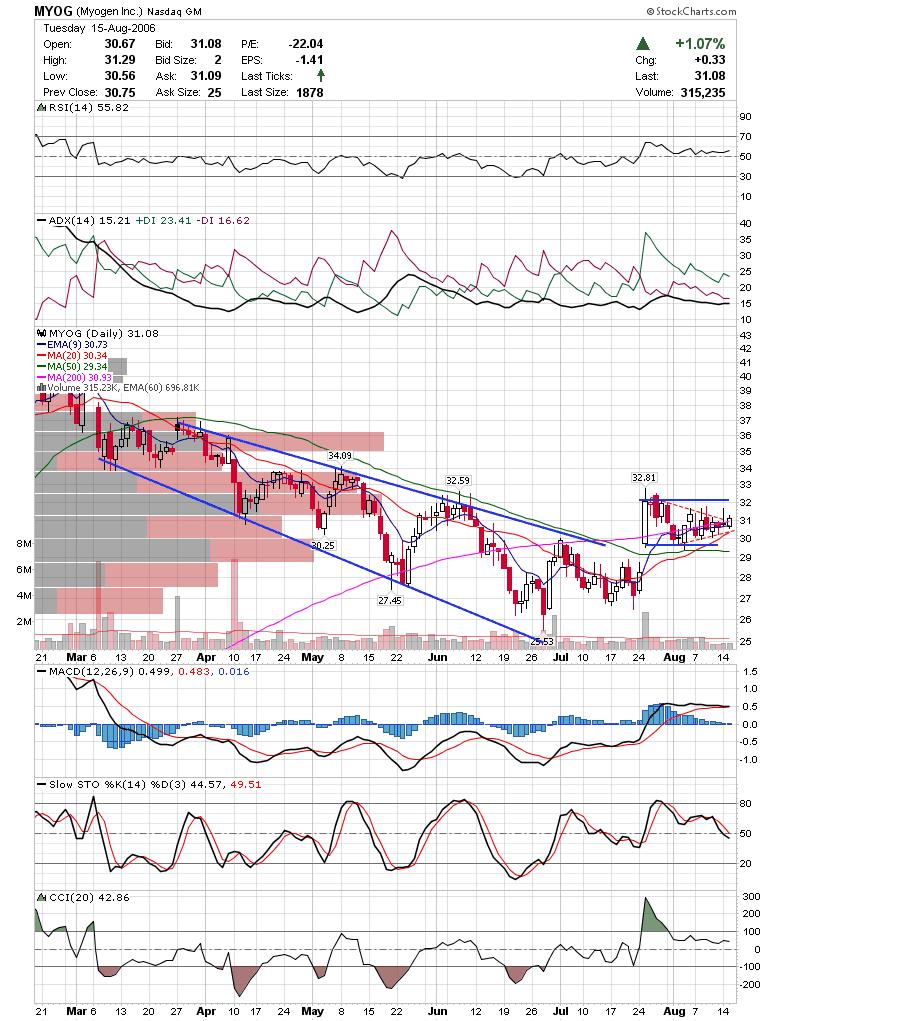
Good Luck tomorrow,
DT
Lot's of shooting stars after the indices reversed today. Things are looking bleak for the bulls as the good news of a cease fire failed to hold stocks higher. Gold, Oil, and Materials were weak again as the dollar rose. The dollar is up against resistance so it remains to be seen if there is more behind this move.
Here is a chart of Copper showing a failed breakout. Usually when a breakout fails the move down is swift as trapped bulls and shorts sell aggresively.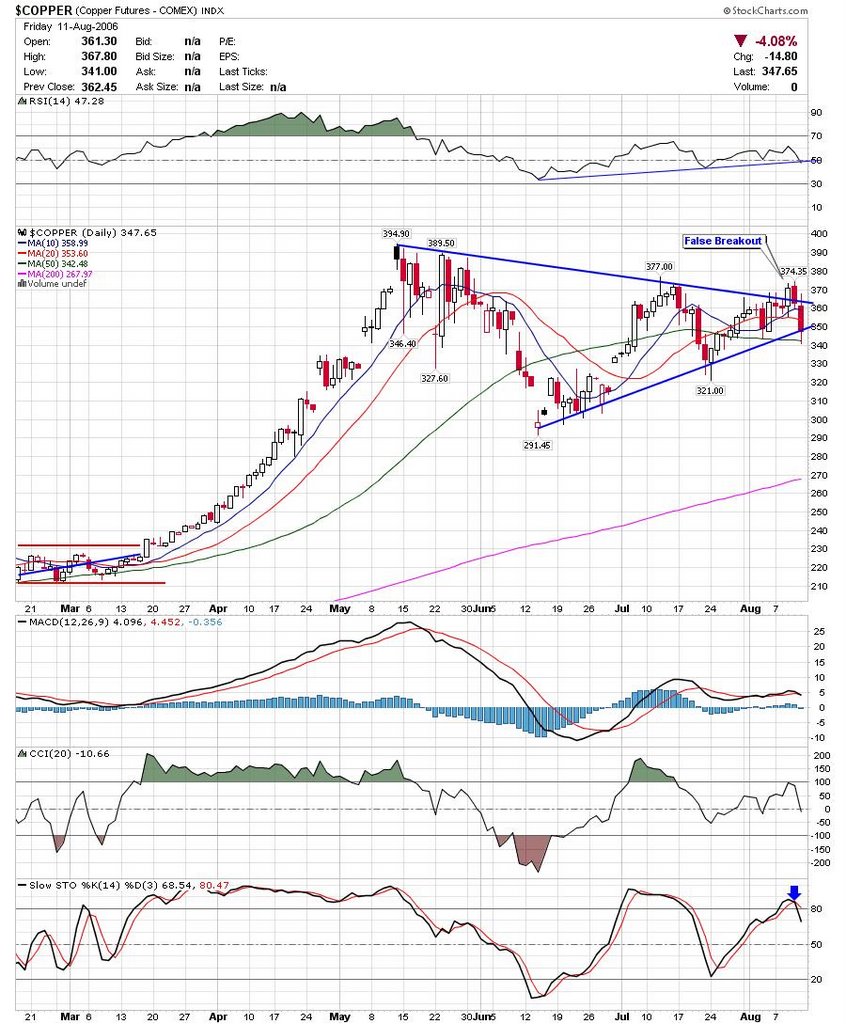 Here is a chart of the DJIA showing the shooting star. Slow Stochastics has plenty of room to the downside. It looks like the relative strength for the industrials vs the $crb index is about to break a trendline. This is a negative as it shows a slowing worldwide economy.
 I've highlighted ATI a few times and it is moving nicely. It is nearing support with both a horizontal and the 200sma nearby so it would be prudent to tighten up on a stop and get ready to watch for a consolidation.
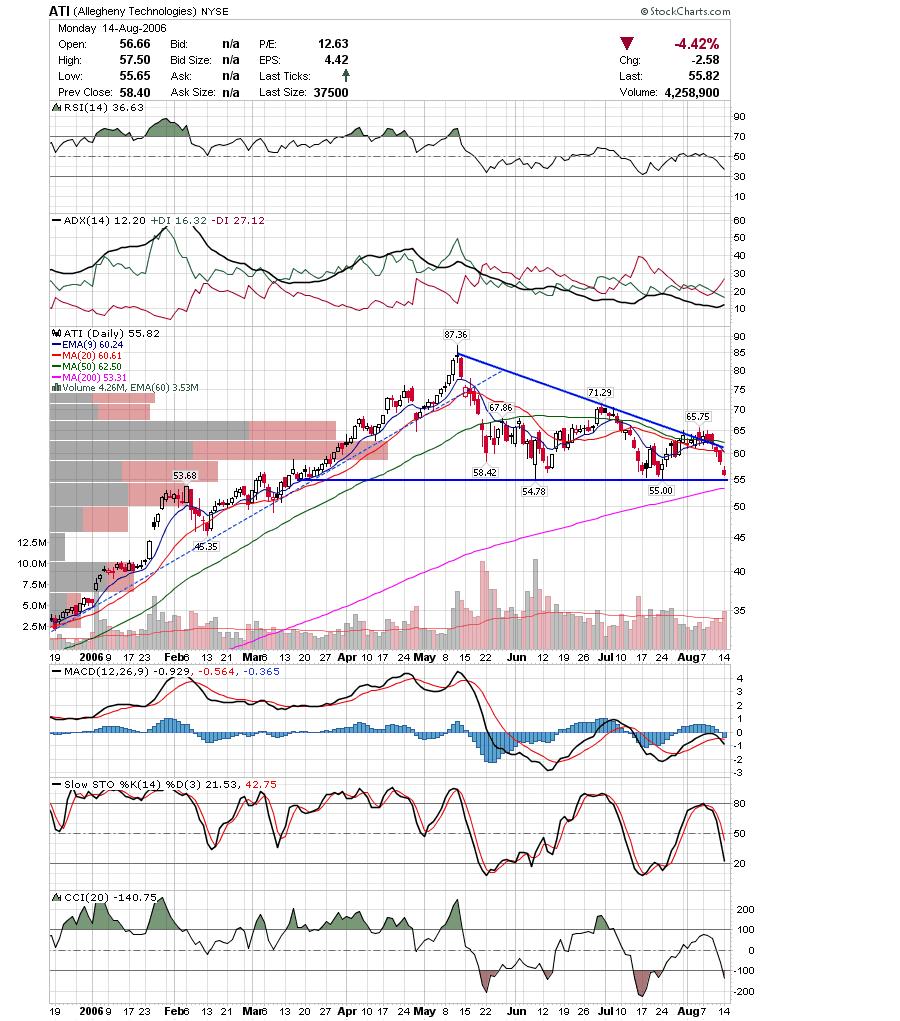 NTRI looks like it failed to get over trendline resistance and had a negative candle. With MED getting hammered to the tune of -26% after earnings it could be a rough day for diet stocks.
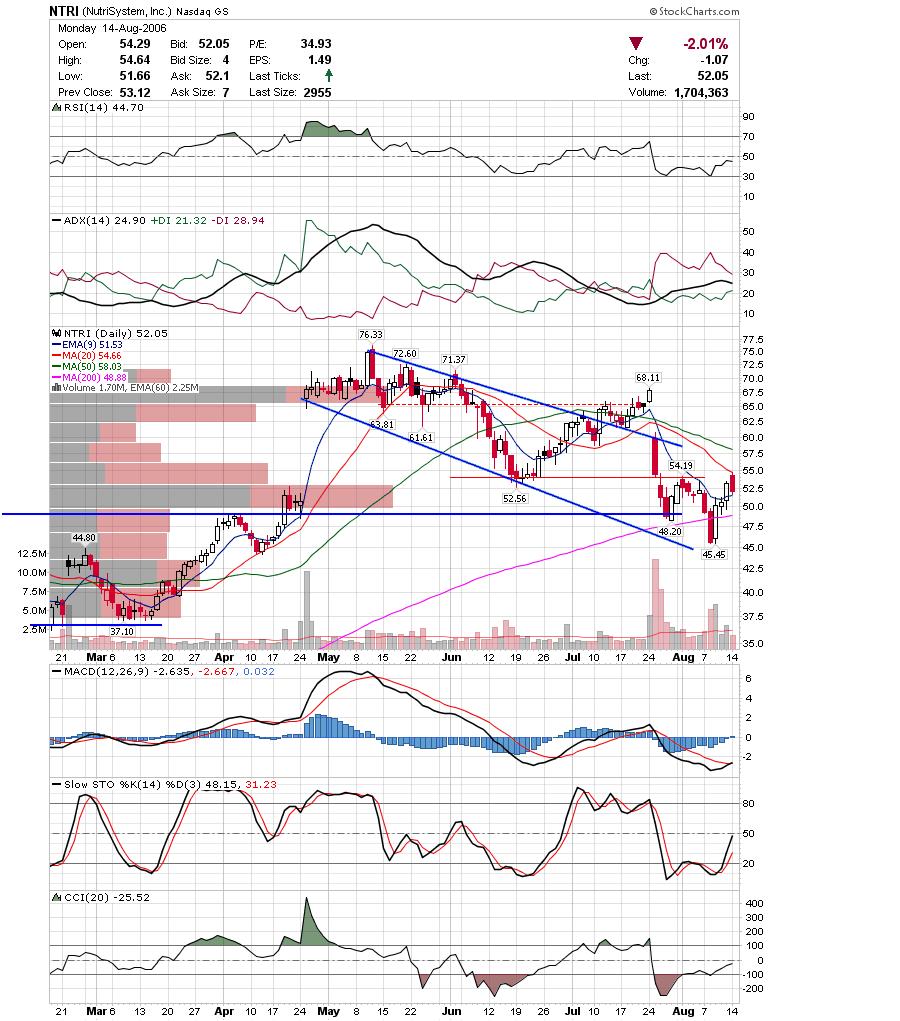 With materials stocks weakening keep an eye on NUE. It looks like NUE is breaking out of a triangle here.
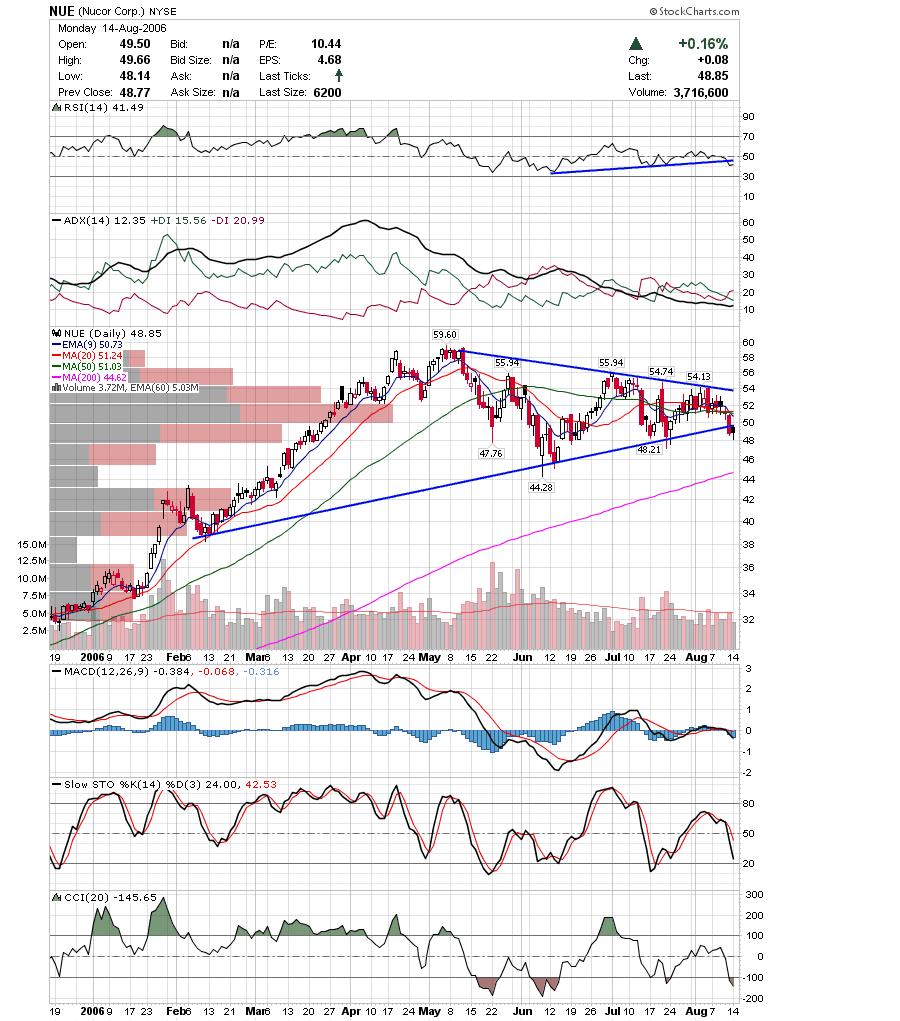 TS looks similar to NUE and which makes sense being in the same sector.
 It looks like there will be some weakness the next couple days with a possible reprieve for options expiration. Good Luck,
DT
The indices are in a precarious situation right now with most looking like they are stalling on the weekly charts. I have lots of charts tonight so I will get right to it.
Gold continues to drop and it will be interesting to see how the cease fire in Lebanon will impact Gold and Oil.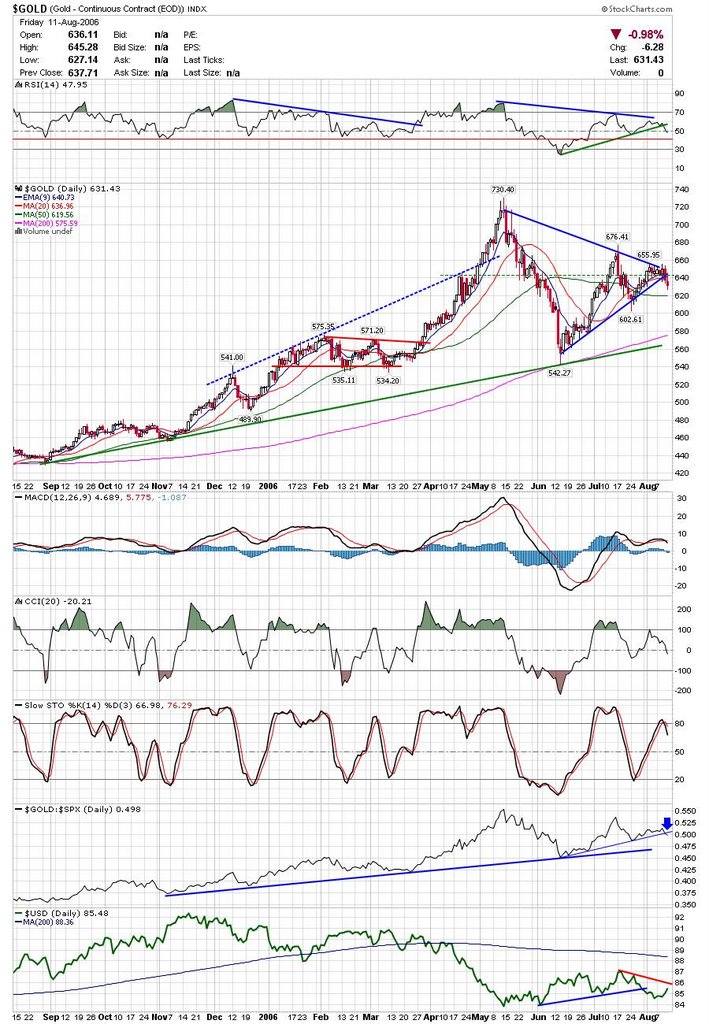 Here is a weekly chart of the Russell showing a doji followed by a reversal candle. Keep an eye on the trendline.
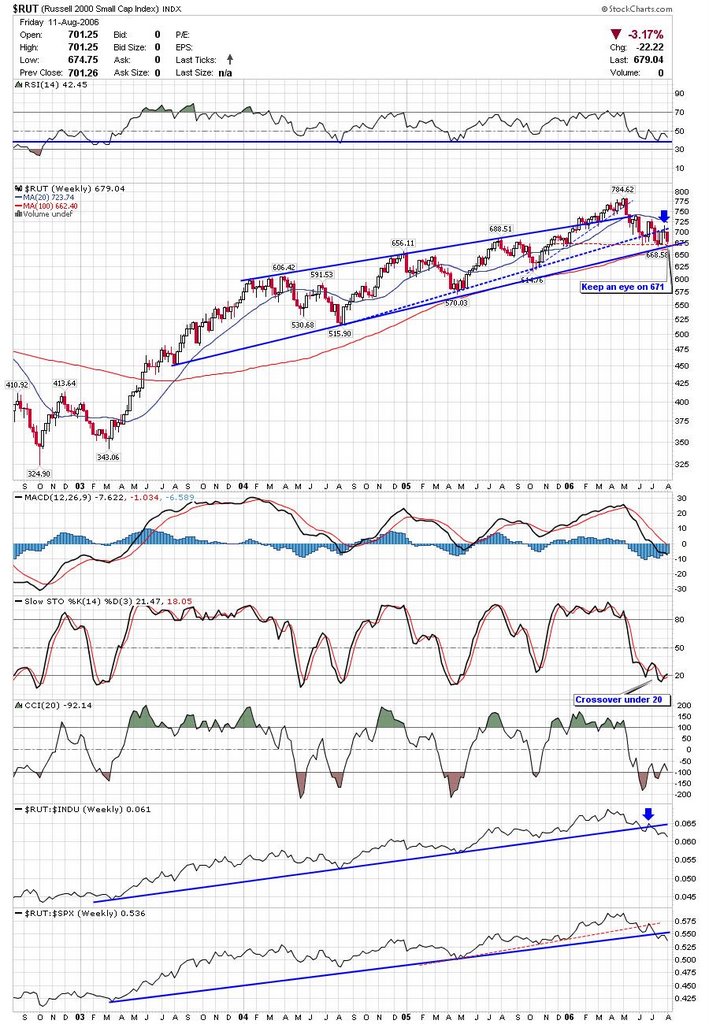 Here is the OIH etf. The head and shoulder top remains a threat and if oil pulls back on the Middle East news then OIH may complete the pattern.
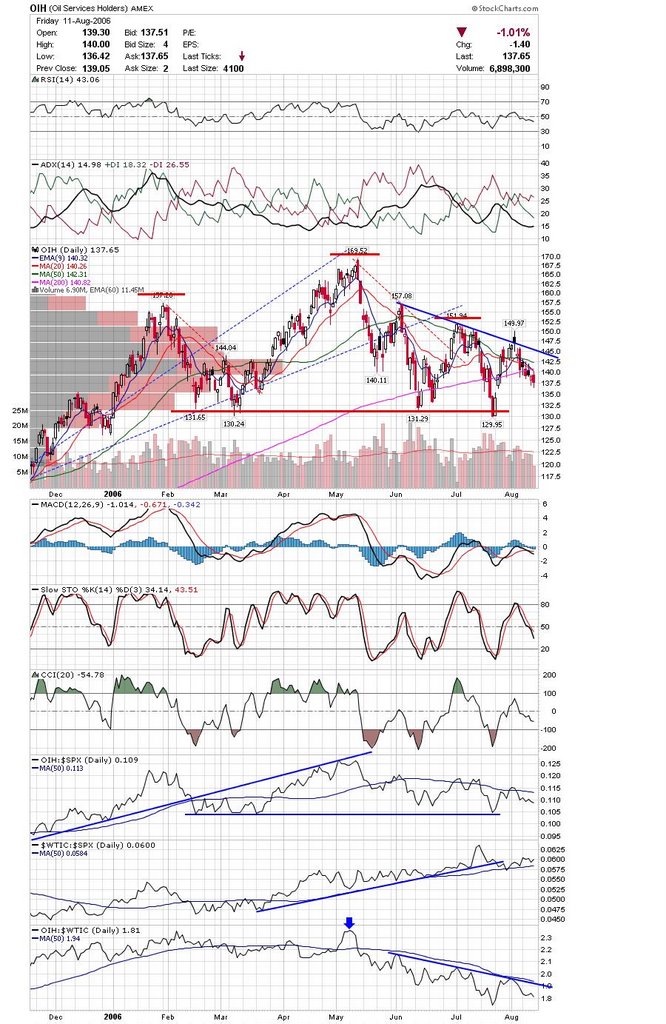 KOMG may resume the downtrend after two inside days.
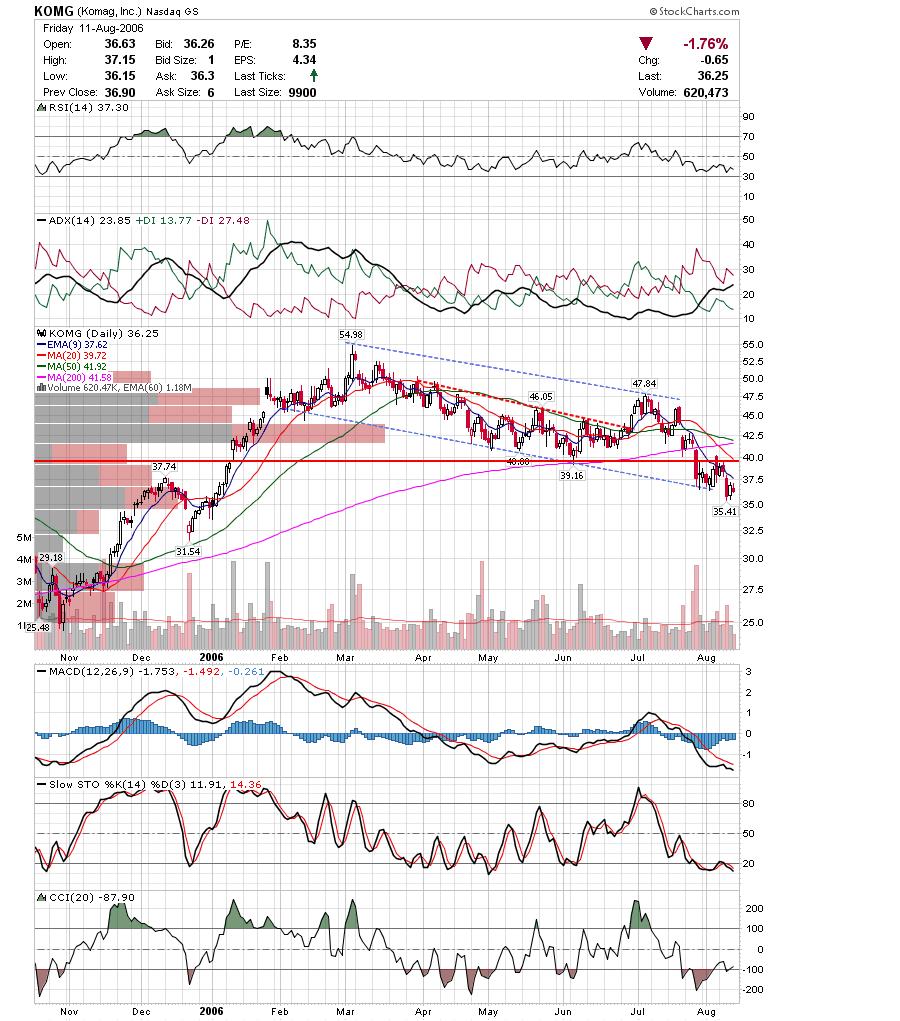 ARD may get a pop on moving higher in IBD 100 rankings.
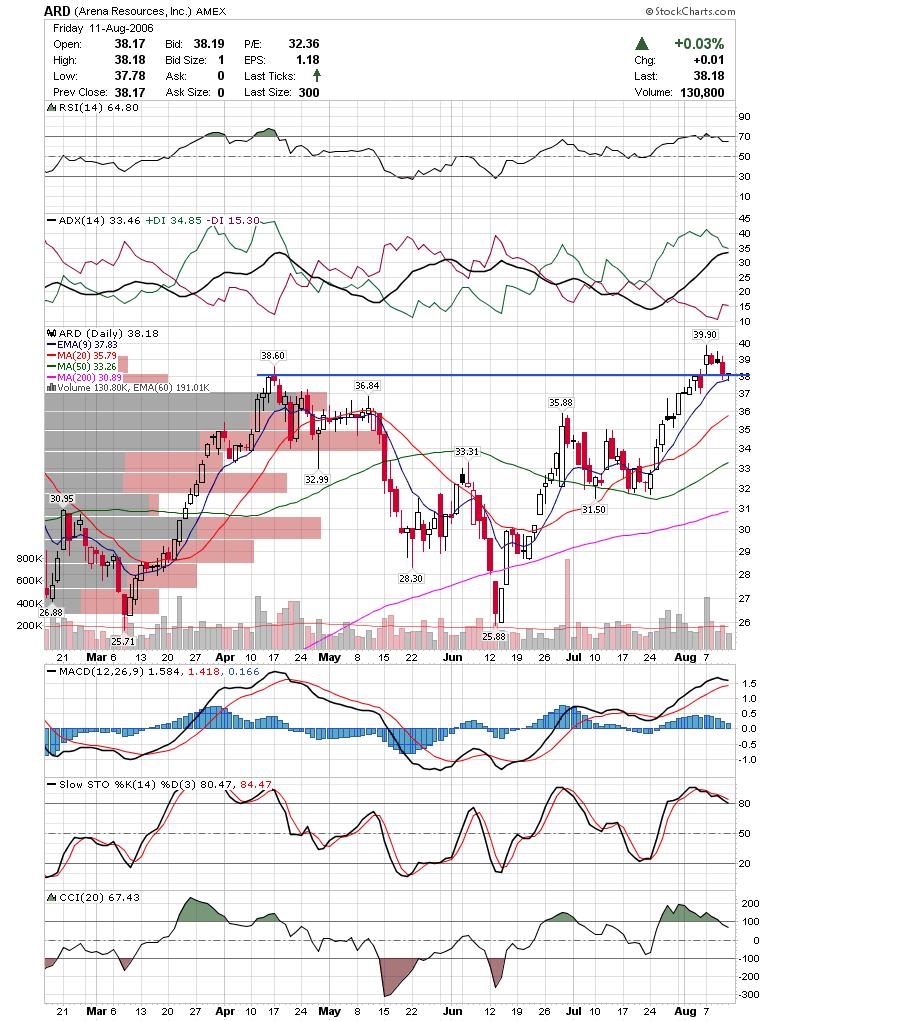 ETP printed a bullish candle pattern on support so watch to see if it can clear resistance.
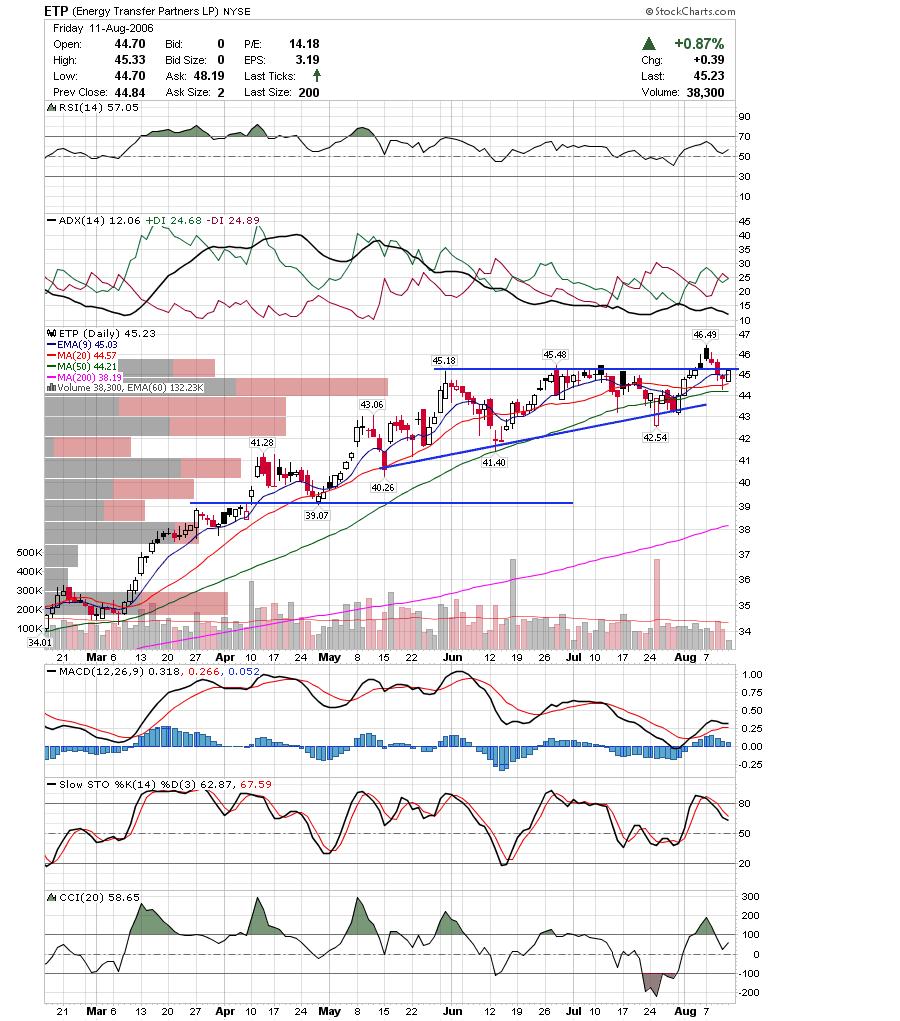 ISYS is above resisitance and has been holding up on weak days.
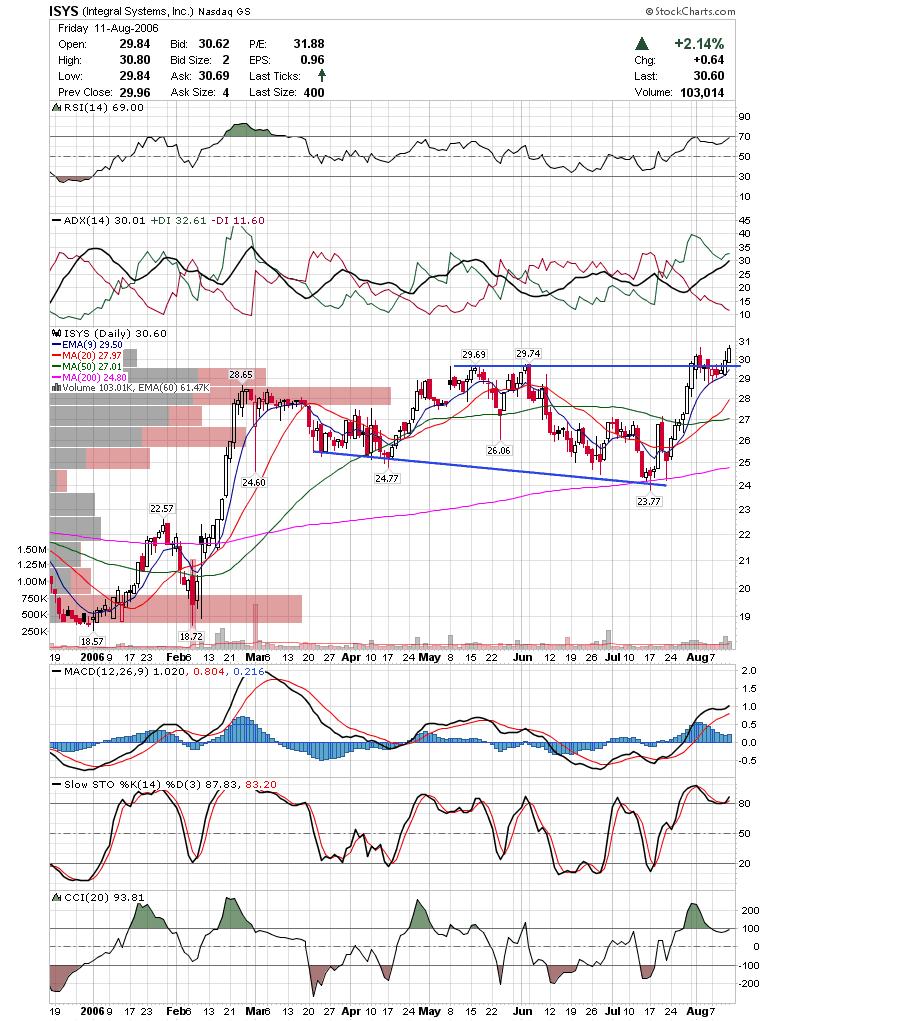 PVA is close to completing a reverse head and shoulders pattern. Keep an eye on the neckline.
 Here is another reverse head and shoulders pattern that was completed in SU. It could be a whipsaw though as a shooting star at 86.78 is giving a warning.
 SYKE may be in the process of forming a bull flag.
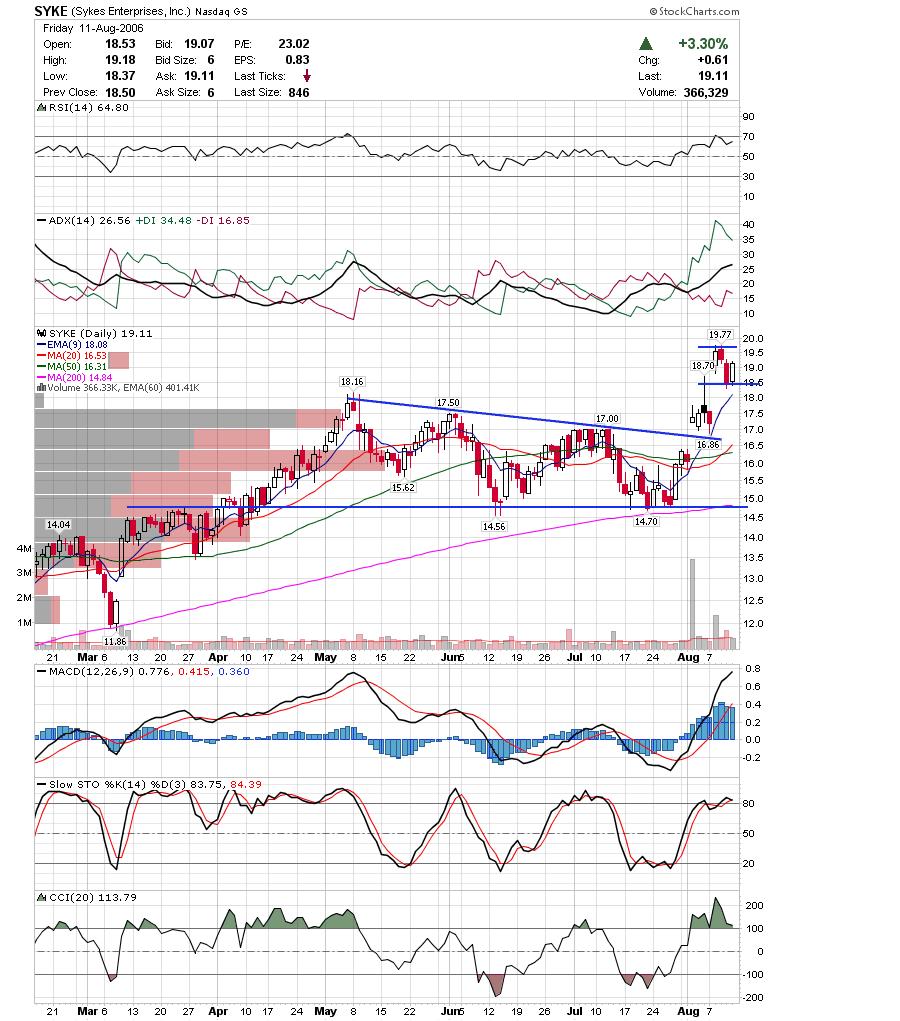 EOG looks to have failed a breakout. It still has room to the downside after completing a head and shoulders top.
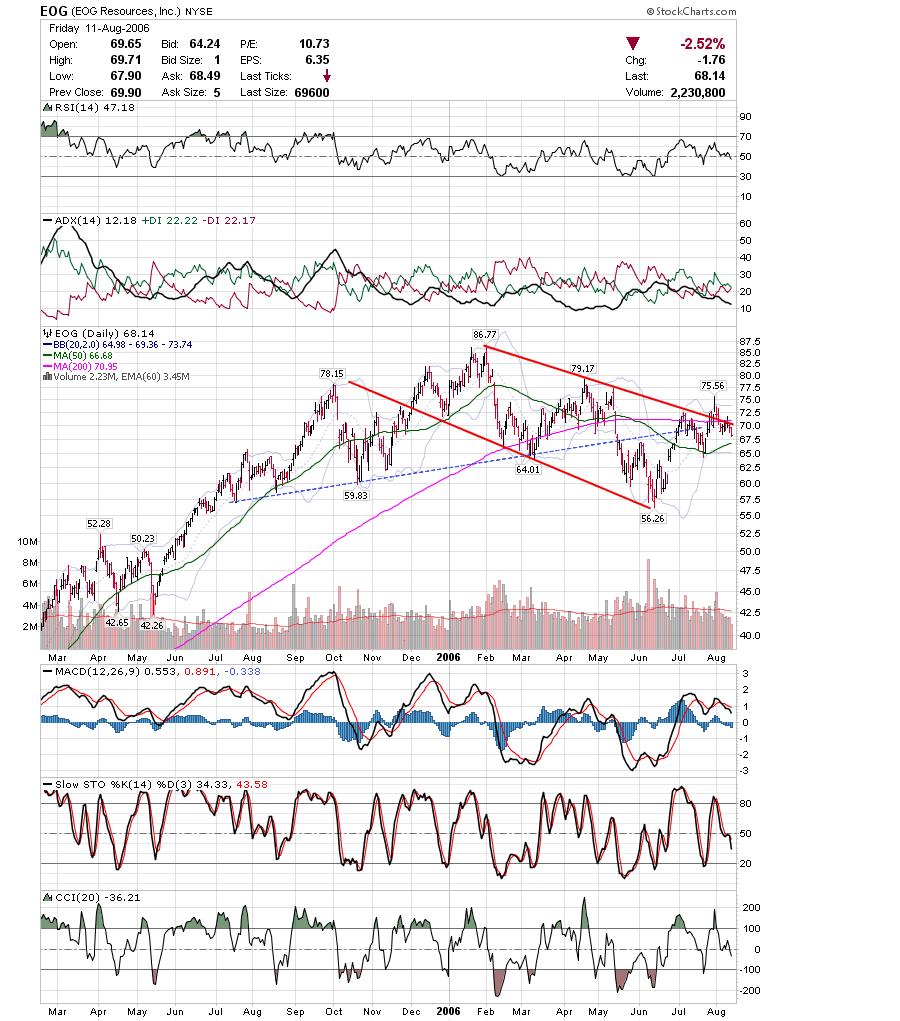 OIS is up against longtime support. If it breaks down it should fall a long way.
 CXW has been holding up well and could move higher if the markets get a bounce.
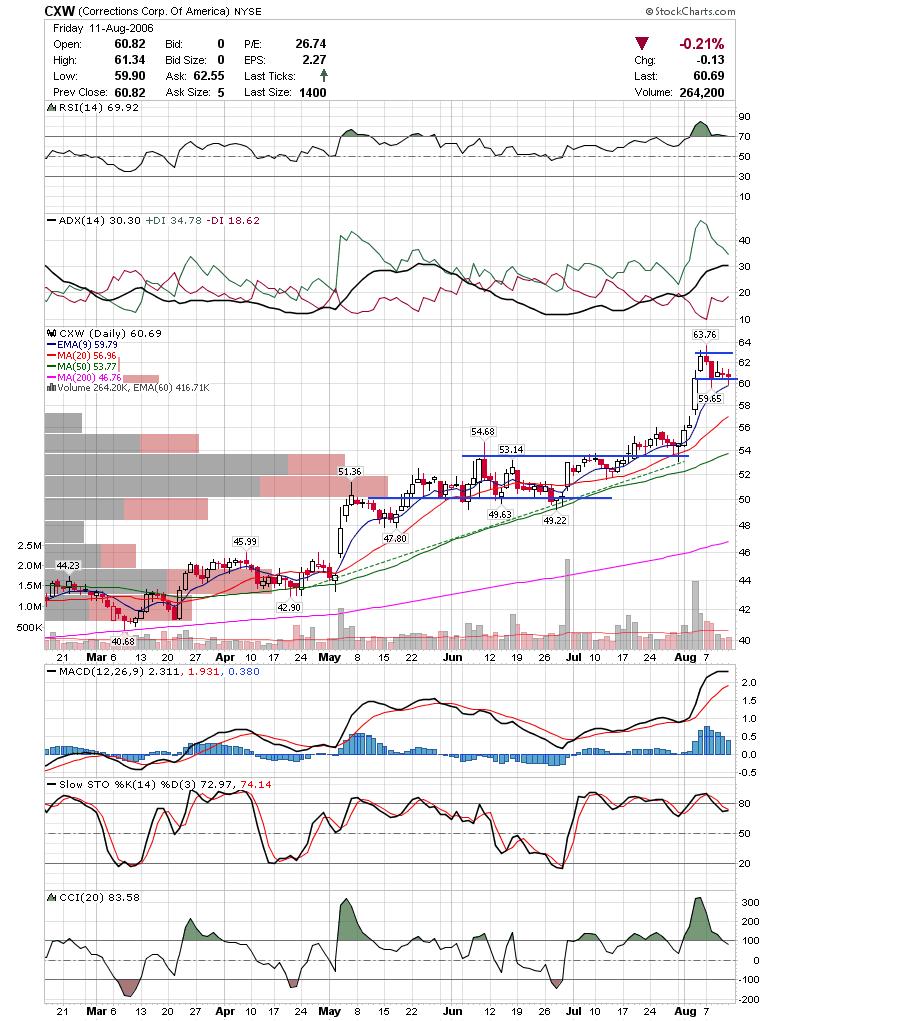 HAL has been holding up in this area, but momentum is slowing and the trend is still down.
 HLX is another energy stock that looks weak.
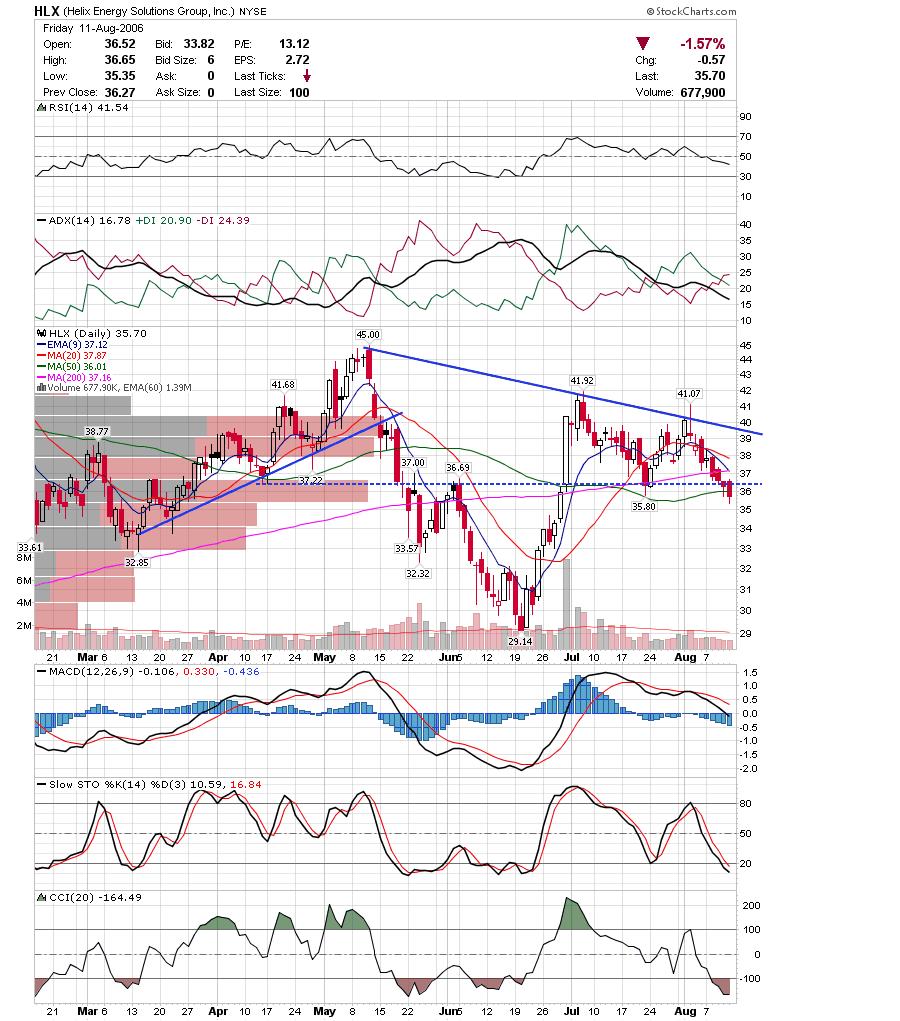
I highlighted BBBY last week and it continues to stay under the trendline. It looks like it will head much lower.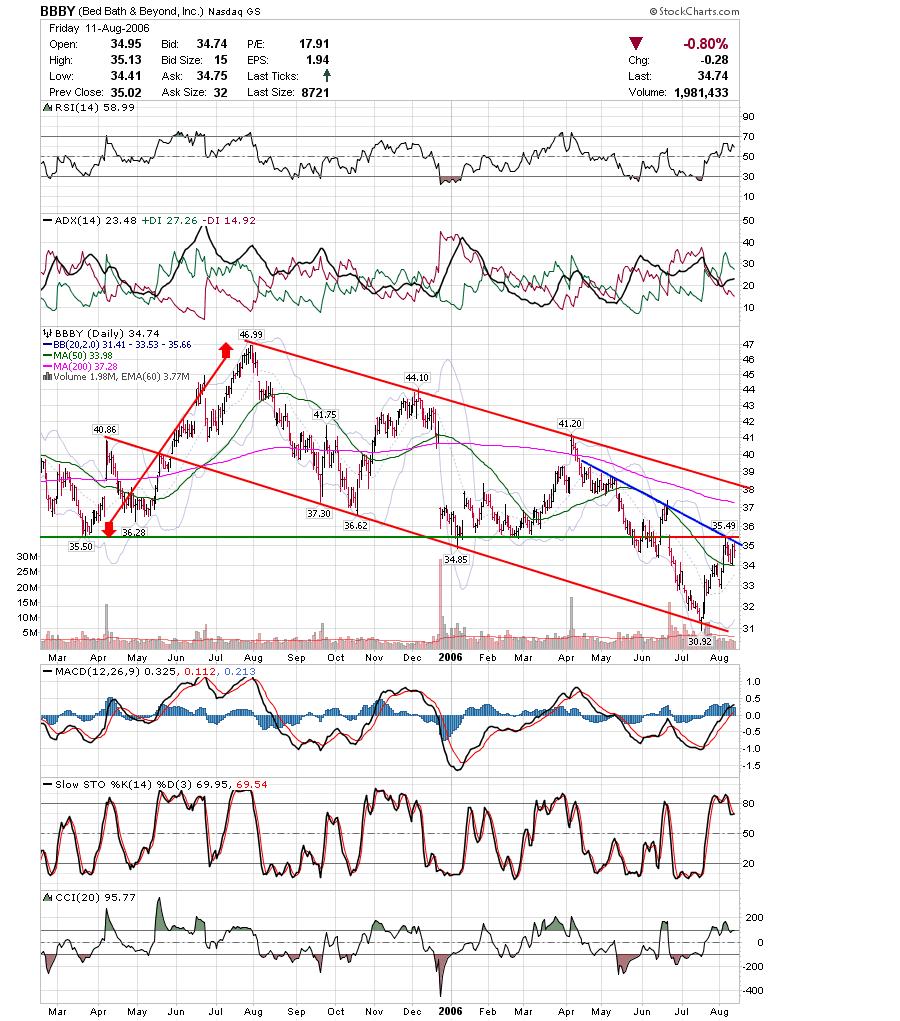
Thats it for tonight. Good Luck,
DT


