The markets had a decent close after showing some weakness during the morning. If the markets can follow through then it would pave the way for the next leg up of this rally. It looks like tech is the place to be if the markets will rally as Basic Materials and Energy have been looking weak.
Here is a chart of copper. It has retraced up after breaking out of a triangle and it looks like Slow Stochastics will cross back over to the negative.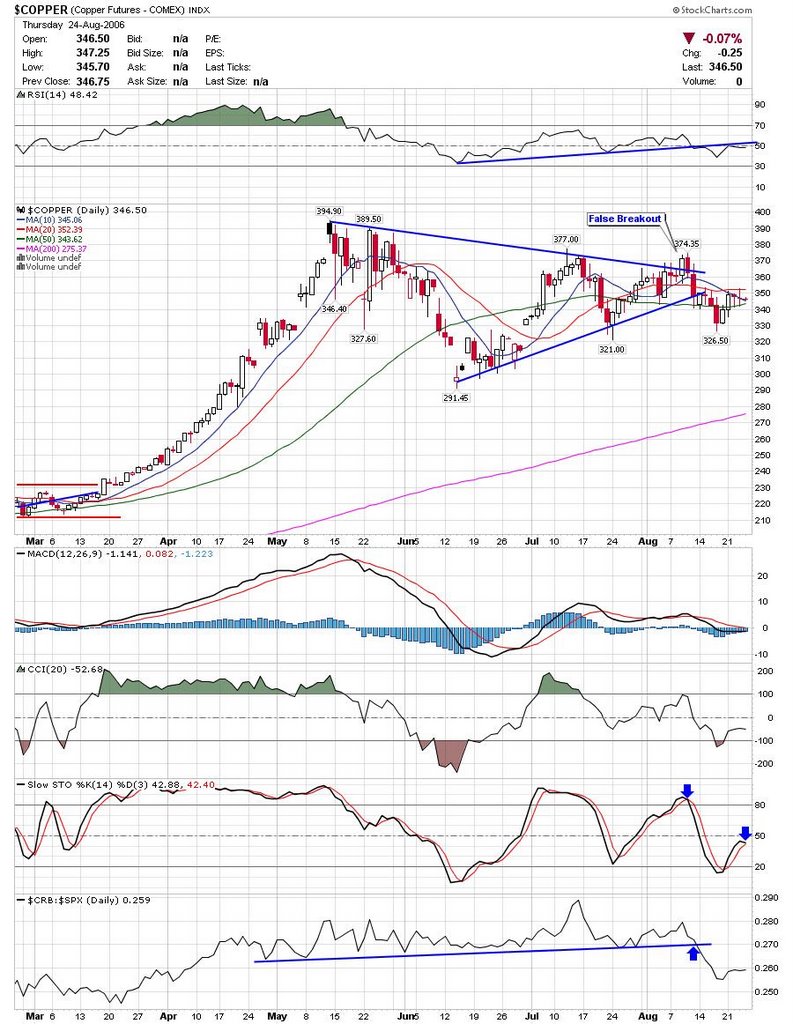 Here is an updated chart of gold. Everyone is bearish on the dollar so it would only make sense if it went higher ;) . Notice the gold/dollar ratio indicator towards the bottom of the chart. It is close to breaking a trendline. As always, you can click on the chart to make it larger.
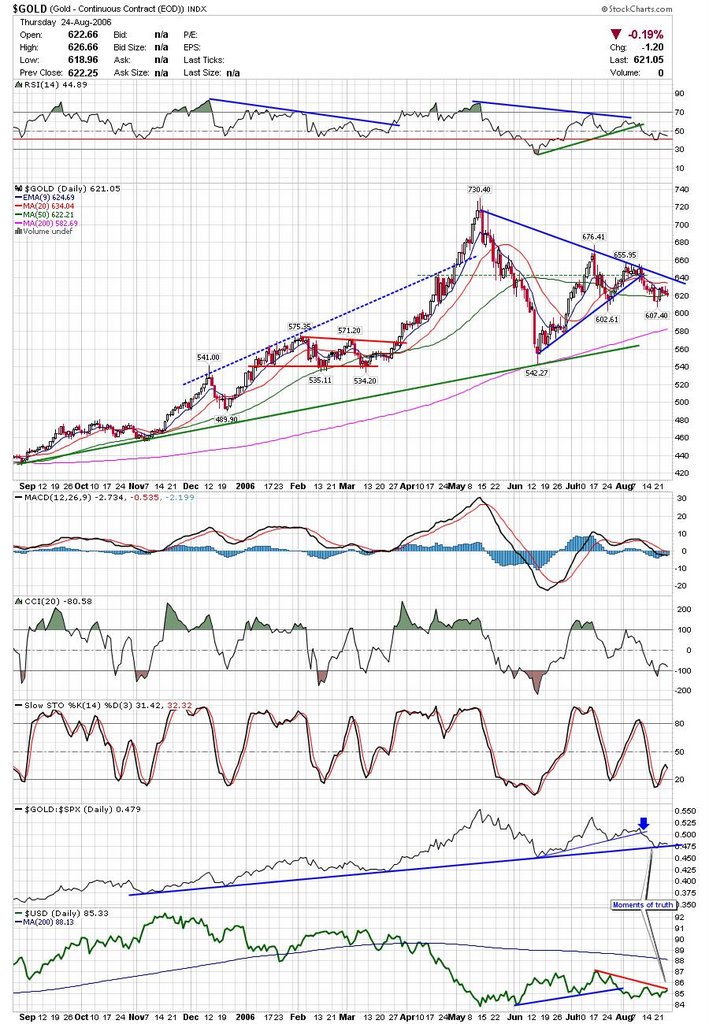 AKAM has been consolidating the recent breakout and may be ready to start moving back up.
 FLSH was strong today reversing yesterdays losses with an outside day. This stock just hit a 52 week high and may follow through tomorrow.
SVNT is a smaller stock that looks like it has broken an ascending triangle. Volume is increasing which is bullish.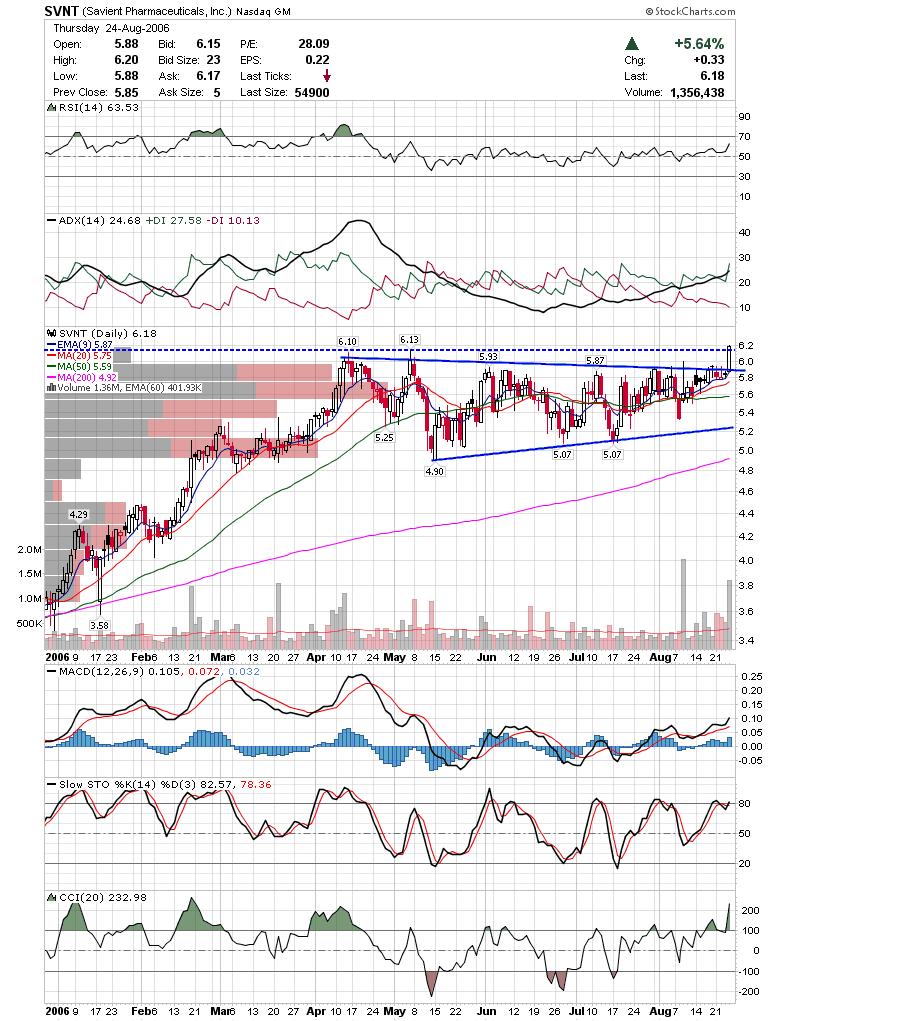 QCOM had an inside day which partly negates yesterdays reversal. This stock has been beaten down and may incite a short squeeze if it can clear this little flag consolidation.
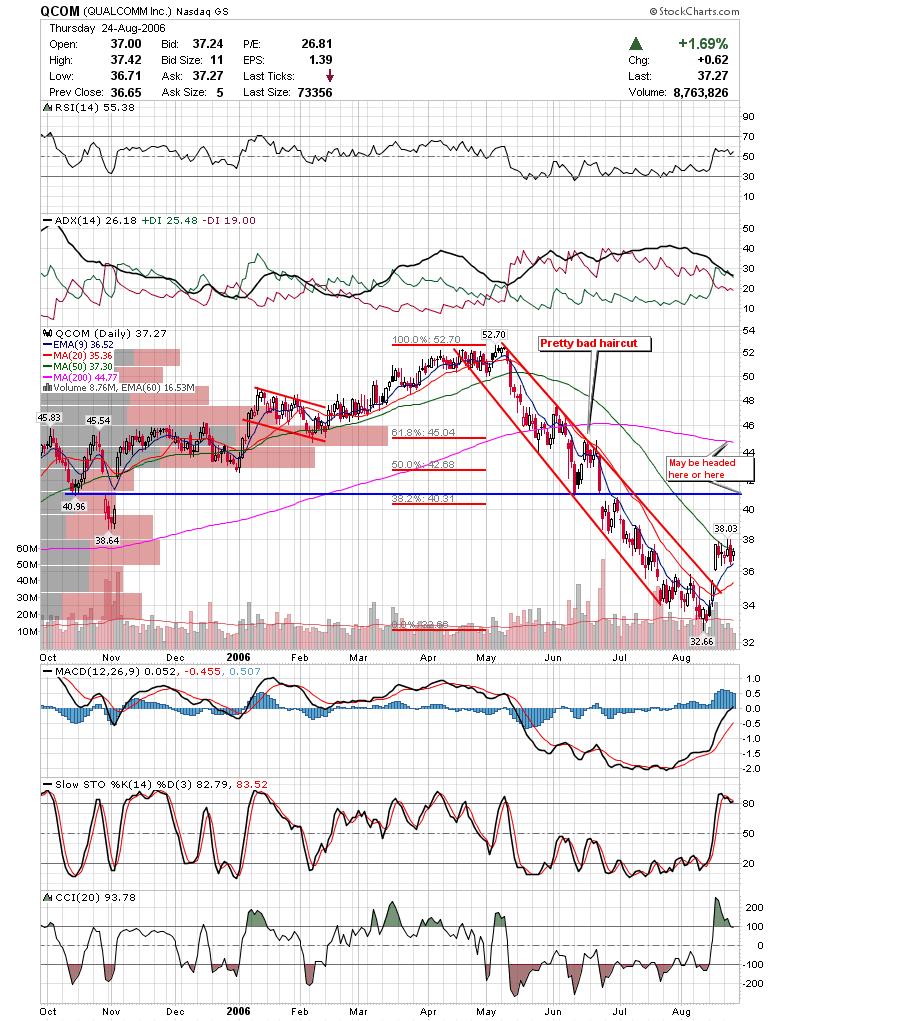
Good Luck,
DT
I will keep it short today since I have a splitting headache. While todays declines were on lower volume, most indices and plenty of stocks are showing bearish engulfing patterns. This may be a hint of lower prices to come in the near term.
With that in mind, here are a few short charts.
JCOM may be failing after filling the gap and wrestling with the 200 sma.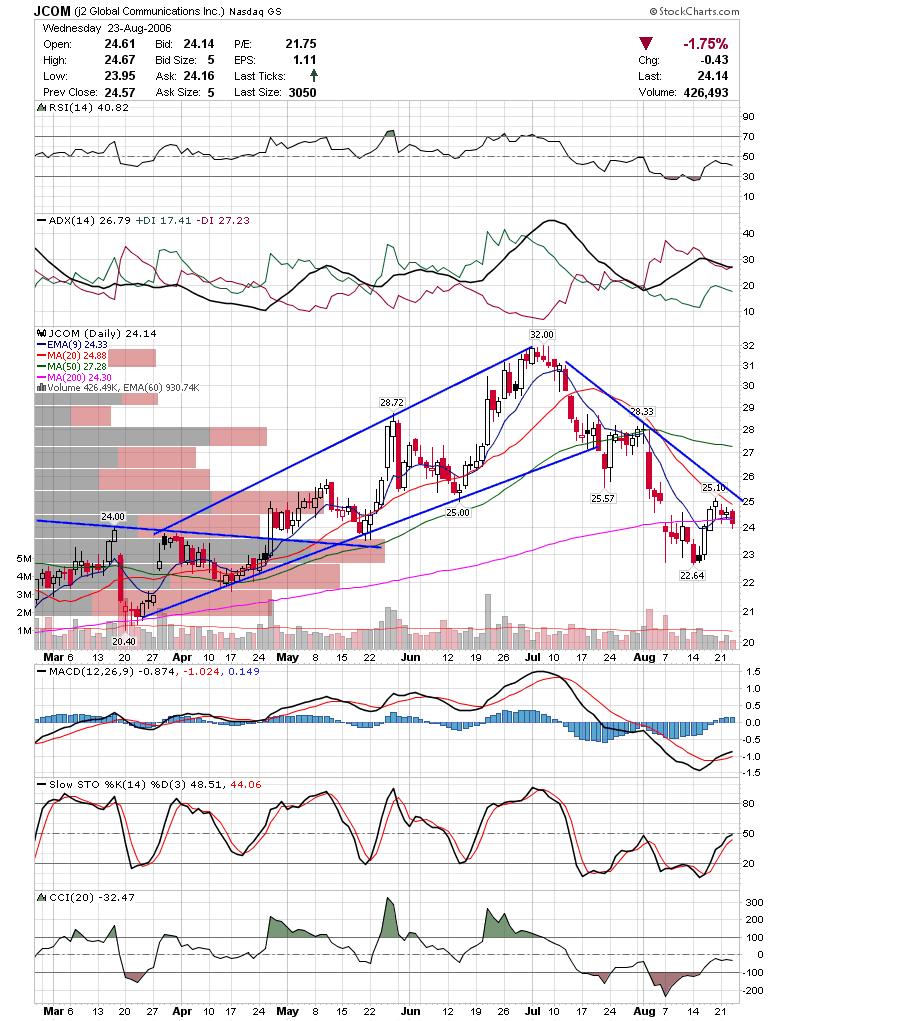 KOMG may be slipping into the accelerated downtrend channel shown in red.
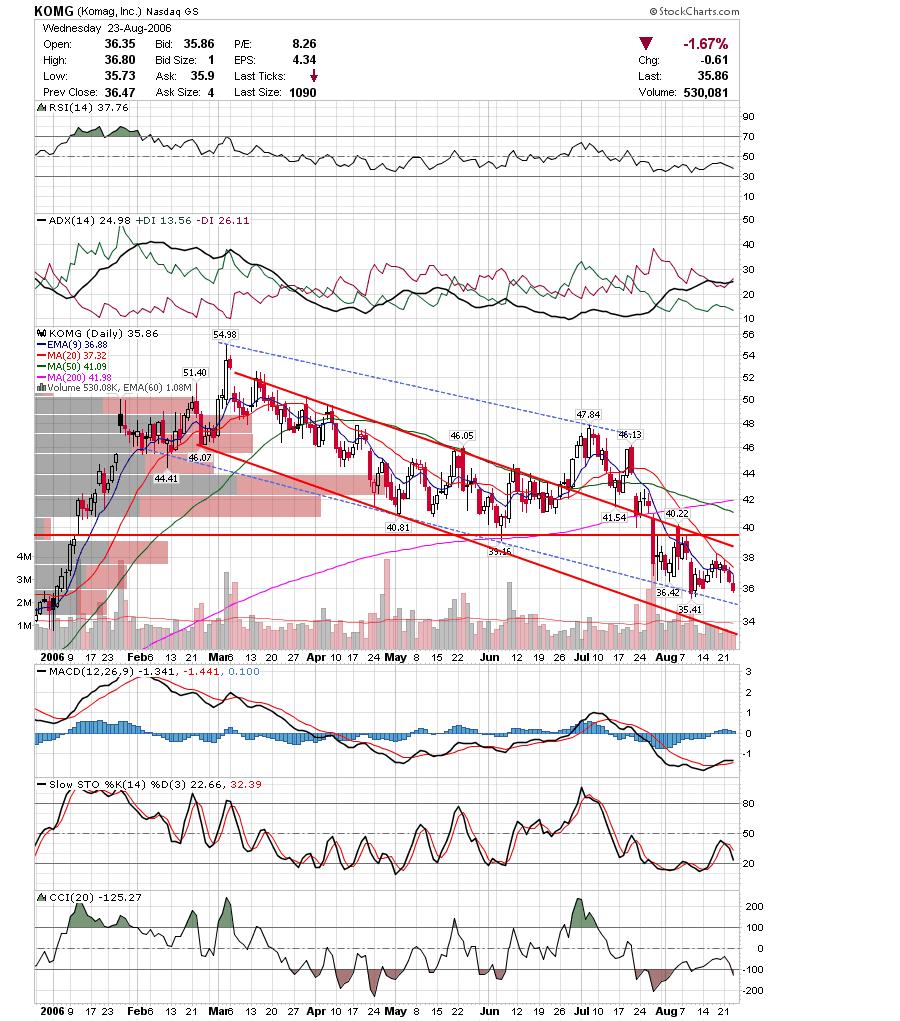 HAL has been putting up a pretty good fight refusing to go down, but it also has failed to move up much higher and has stalled at the 61.8% retrace of the last leg down. The target for the head and shoulders top is still pretty far below.
Good Luck tomorrow,
DT
Looks like I have a bunch of new visitors today, so I would like to offer my welcome. Thanks to Dr. Brett for the mention on his blog today. Also, thanks to Trader Jaime of Wall St. Warrior for the mention on his stocktickr interview. Check it out here, it is an interesting read, as are the other interviews.
For those visiting for the first time, this blog is mainly about sharing what is on my watchlist with the public. I started the blog as a way to share my charts with some trading buddies and groups I was a member in. I think it fills a niche in the blog community as most blogs are dedicated to reviewing daily trades or general trading advice. My main objective is simply to provide a watchlist of stocks likely to move BUT that also offer a decent short term entry for swing traders. If anyone likes what they see or has any suggestions / ideas please feel free to leave comments.
I'll start tonight by showing my CRB / US Dollar ratio chart. It is interesting to note that Gold and Oil seem to be bouncing short term, however, it appears that a top may be in place. Look closely at the chart below and notice that the CRB index failed to reach the upper band after a normal correction and looks like it may of formed a double top. Also, the major Ratio trendlines are close to breaking. At this stage in the economic cycle, it seems like the time is right for a peak. Funny that I will follow that up with a bullish oil and gas refiner, but the charts are what they are short term. There are several refiners in tonights watchlist and we'll start with ALJ. It hasn't triggered yet and may drift to the ascending trendline, but I will be watching for a break of this little pennant type consolidation.
 WNR is another refiner that looks like it has already started to bounce.
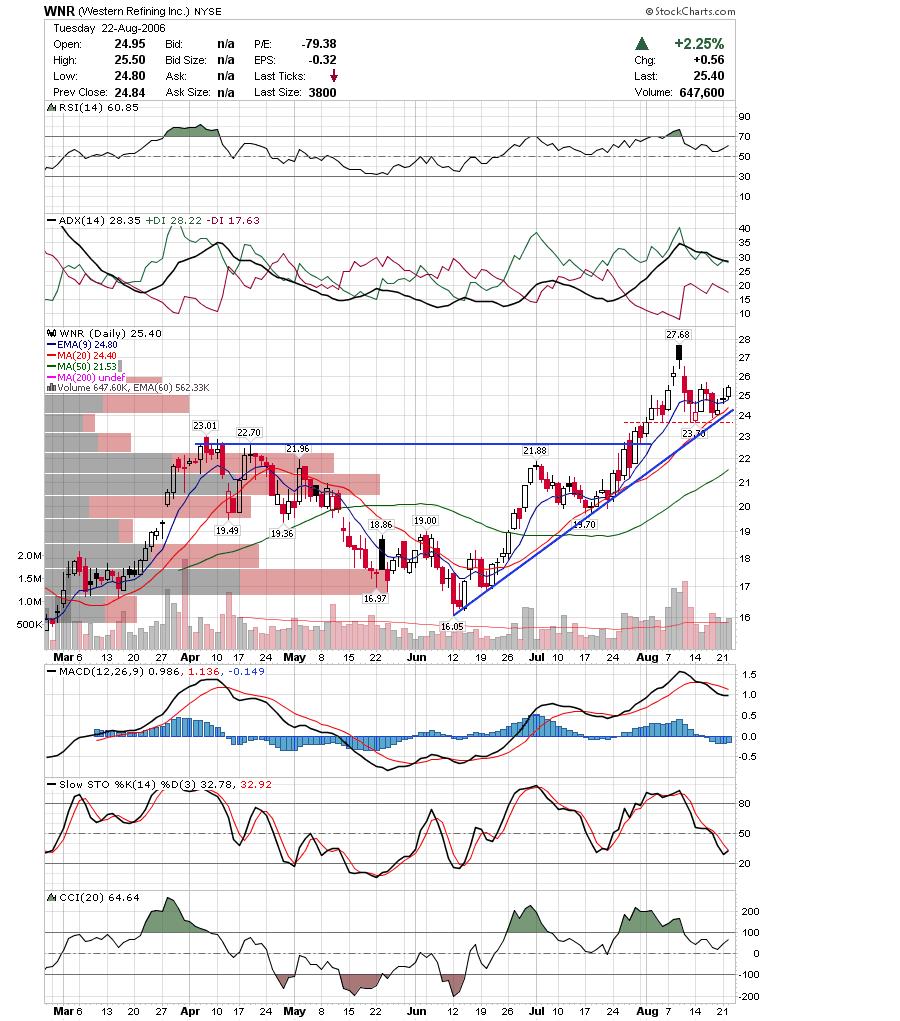 NITE is looking like it has cleared resistance and may get a nice move if it can clear the wick left yesterday.
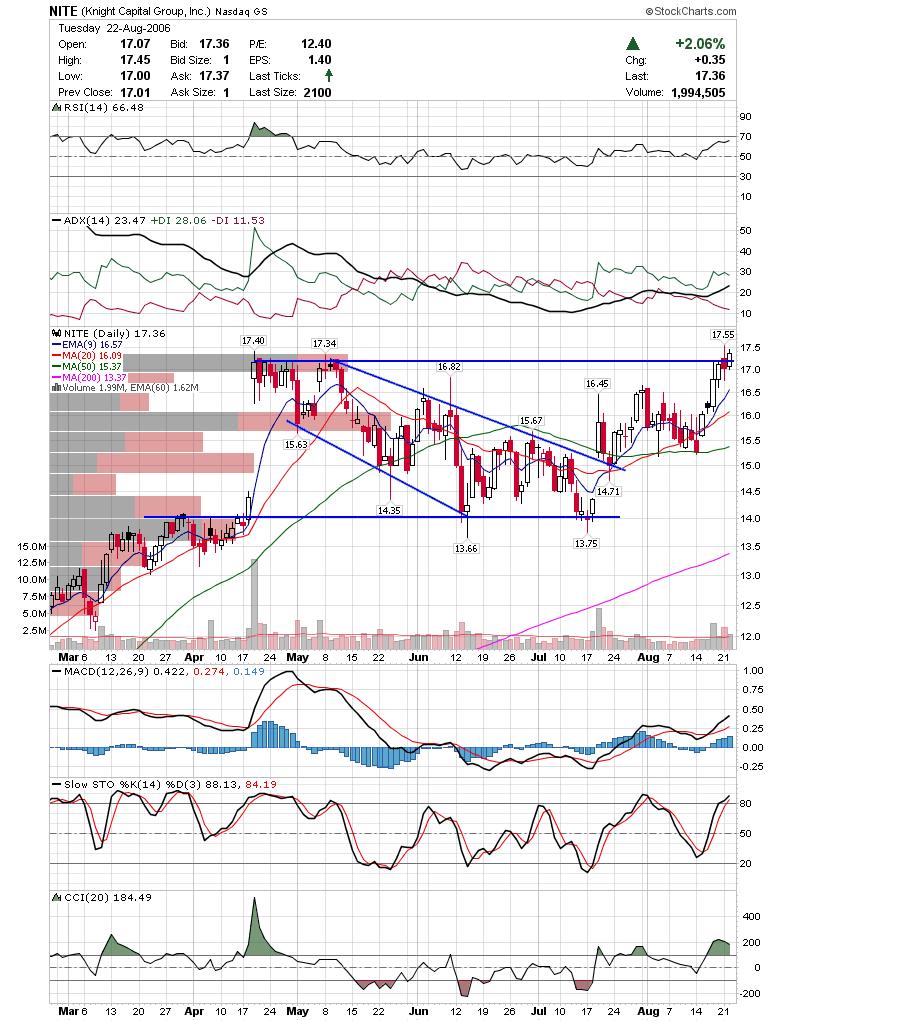 MYOG has been consolidating the breakout move for three days and may be ready to follow through.
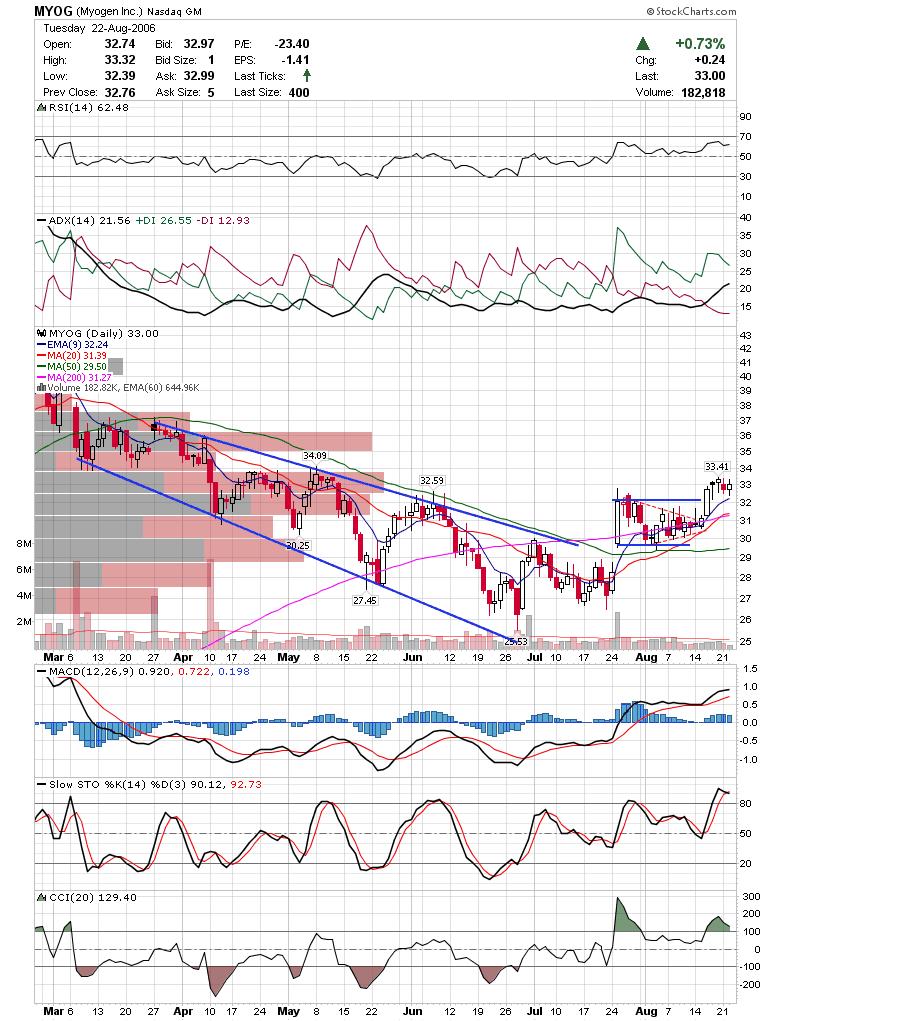 DBRN is looking pretty bearish after the head and shoulders top and then a failed consolidation. There is a sliver of support on the lower trendline, but the major trendlines are broken.
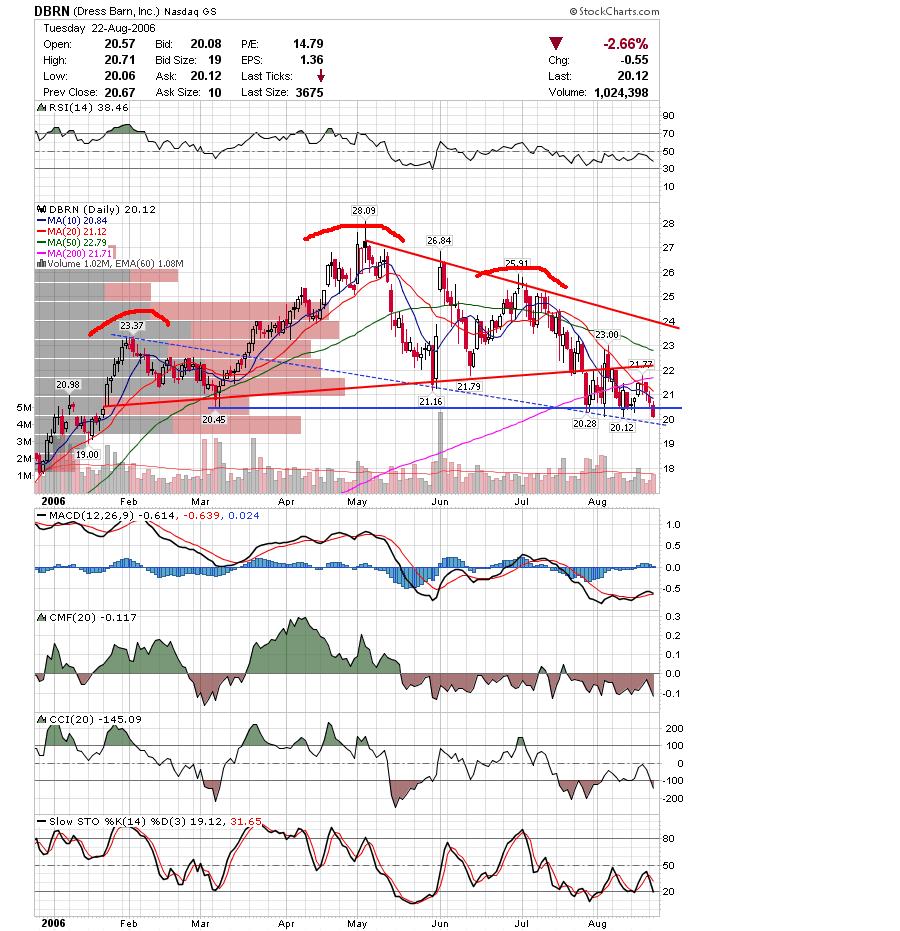 CTCM is for aggresive traders not shy about IPO's. Has a little pennant going and a morning star type reversal pattern.
 CTSH is a very nice looking chart with a little whipsaw after the failed breakout. If it can clear this little consolidation, it would validate the breakout and offer a very nice target.
 HOC is another refiner that looks bullish. Although these trendlines are a little unorthodox, it is clear that these are lines of importance and candles are confirming support right here.
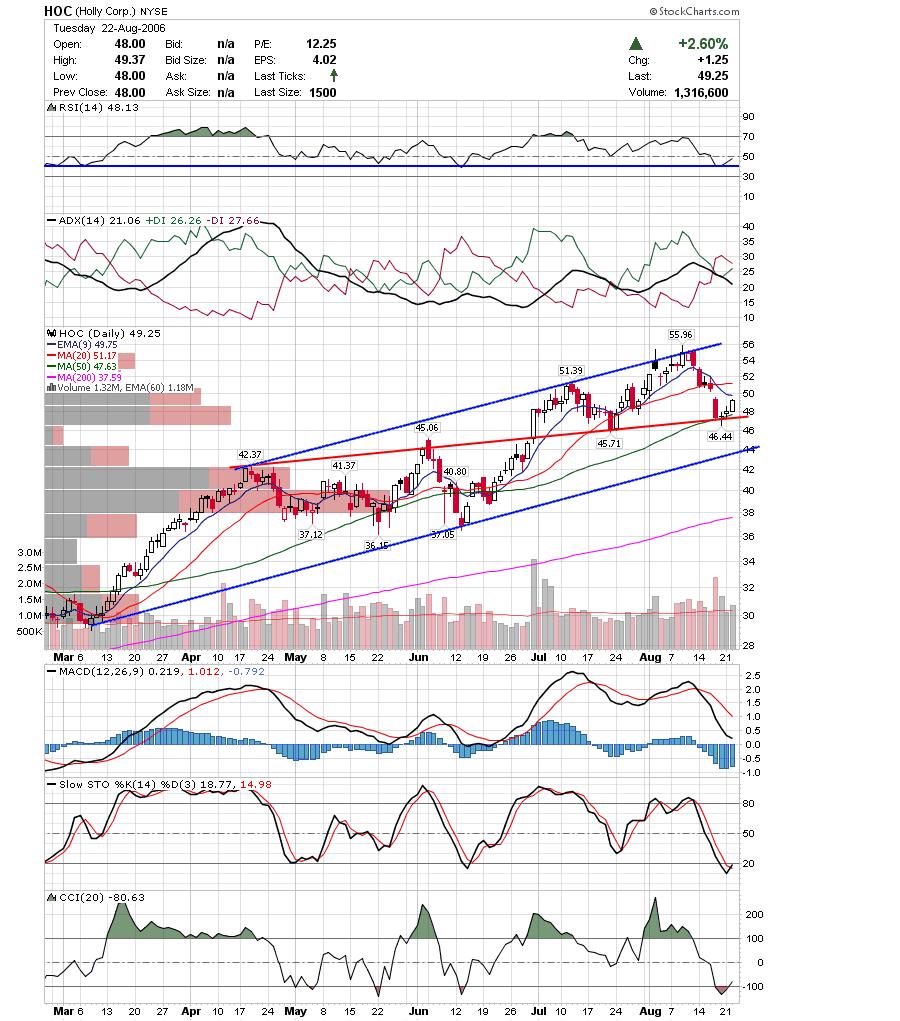 Here is a possible head and shoulders top in the making. ODFL is in the transports sector which has been showing weakness with signs pointing to a weakening economy.
We've had some decent moves on stocks mentioned on this weeks watchlist such as ORB, NEU, ETP, ARD, EZPW, TXU, so make sure to keep an eye for follow through moves.
Good Luck,
DT
Not much to add tonight so I will just post a few quick charts.
ORB looks like it wants to breakout here. MACD is about to crossover and Slow Stoch and CCI are moving higher.
 TIE is back to the descending trendline and showing a little weakness. Keep an eye on it at the least.
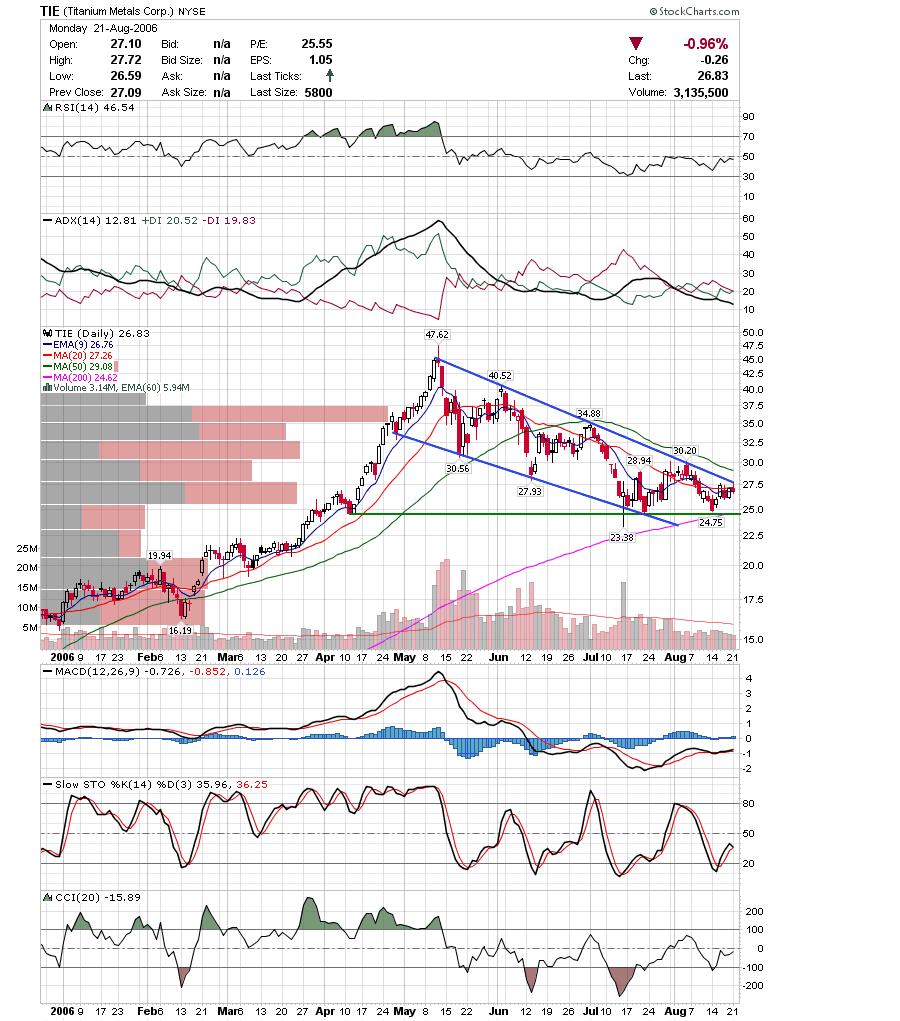 ETP was mentioned last week as it looked like it might try and clear the triangle. It looks like it did and may follow through tomorrow.
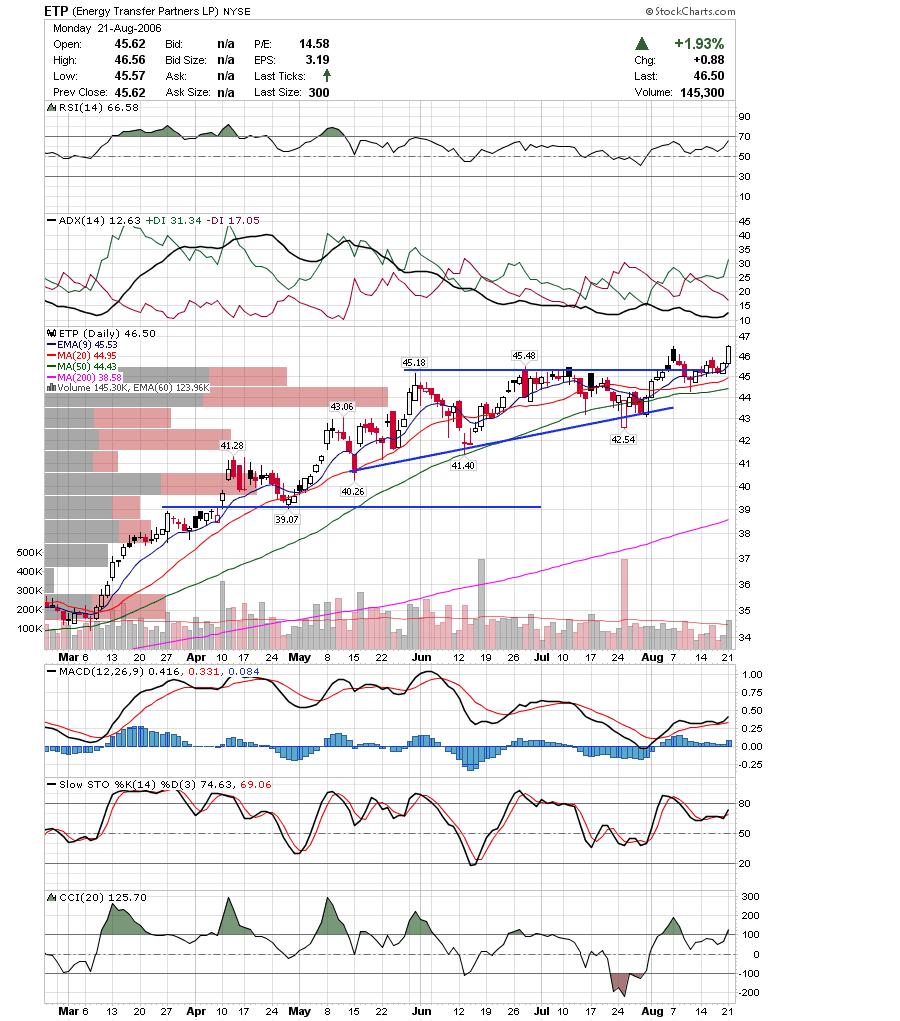
Thats it for tonight.
Good Luck,
DT
It was tough to prepare tonight as the markets look like they could easily do anything at this point. The indices are overbought and could easily consolidate sideways. They could continue to push higher as excitement builds, or they could fall apart abruptly due to various pressures not limited to seasonal weakness, inflation concerns, etc. In looking at the indices the charts are certainly looking bullish and although there are several signs pointing to a weakening market we can't fight the tape. If the market is going up in the near term, then we go long.
Here is a chart of the Nasdaq composite. The most interesting thing to point out is near the bottom. If you look at the Nasdaq / SP500 ratio you will notice a trendline break. This is bullish as it shows market participants taking bigger risks.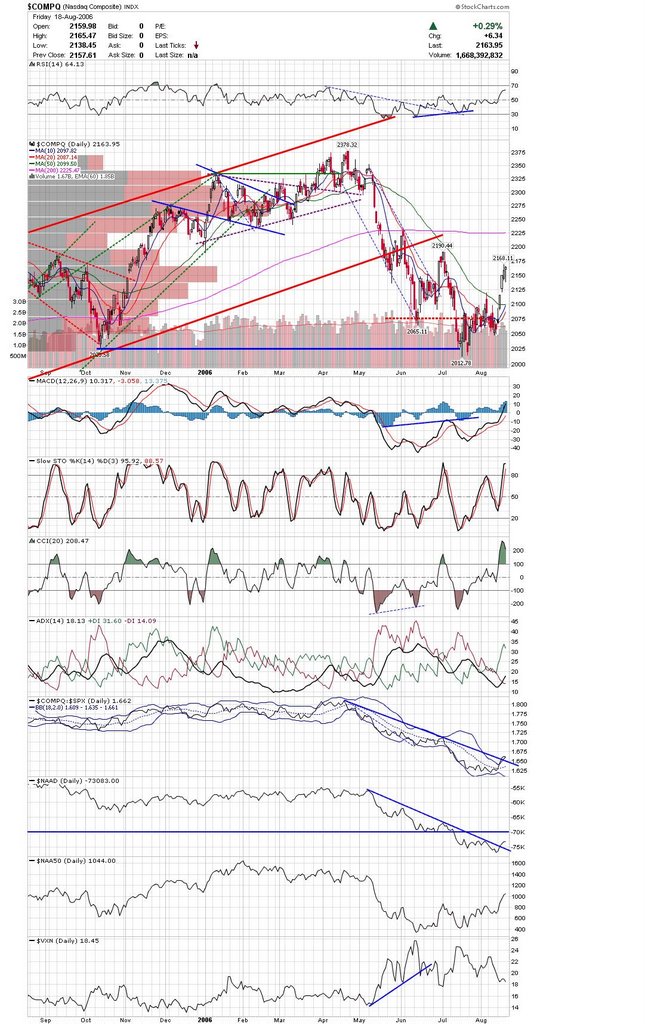
Here is the Dow Industrials clearing a double bottom with a target that takes it to new high territory.
Here is a monthly chart of the DJIA showing a cup and handle type base. It will be interesting to see if it attempts to clear the pivot point.
ADM is looking interesting as this base matures. It failed to reach the lower area twice now and looks like it is headed to the upper trendline.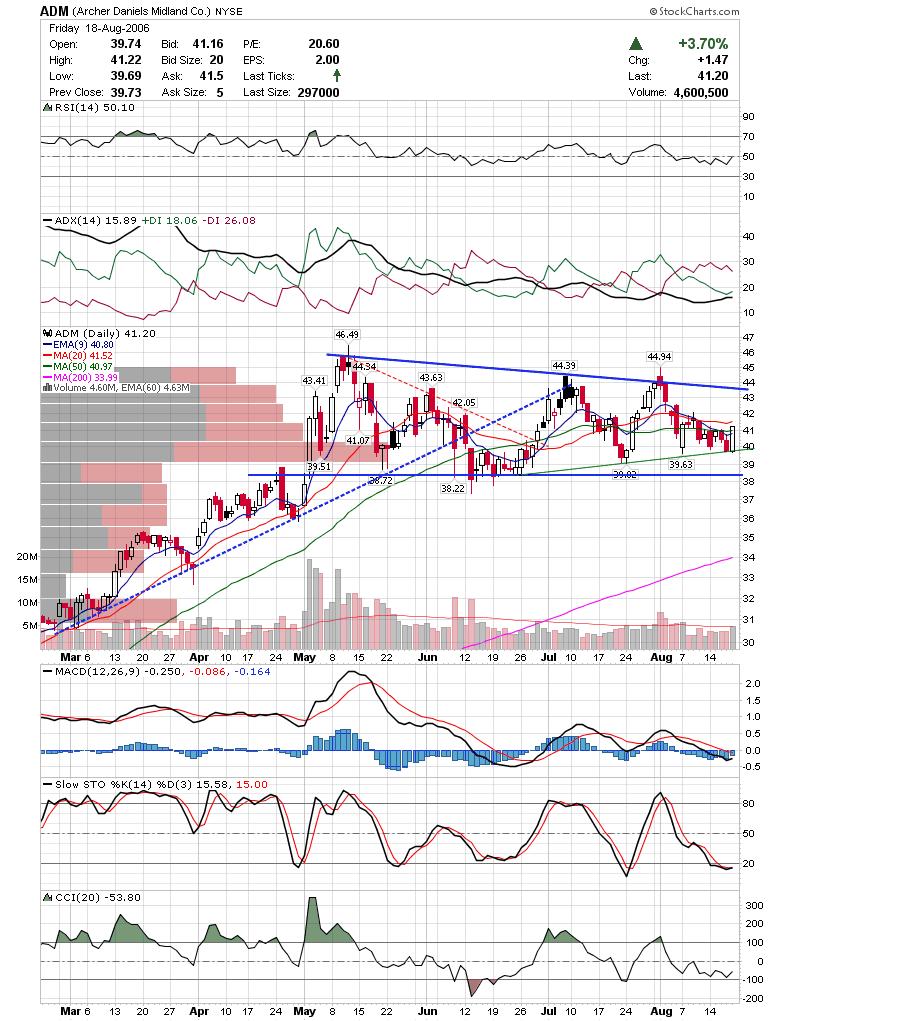
ARD has been holding up well with weakness in it's sector. It may get a bounce on this ascending trendline. EZPW looks like it is finding support and may be headed higher.
Lots of gold charts look oversold and may get a bounce this week. Here is GG near the bottom of a triangle.
The GLG chart looks very similar to the GG chart showing a hammer at a support line.
ICE looks like it will follow through on the triangle breakout.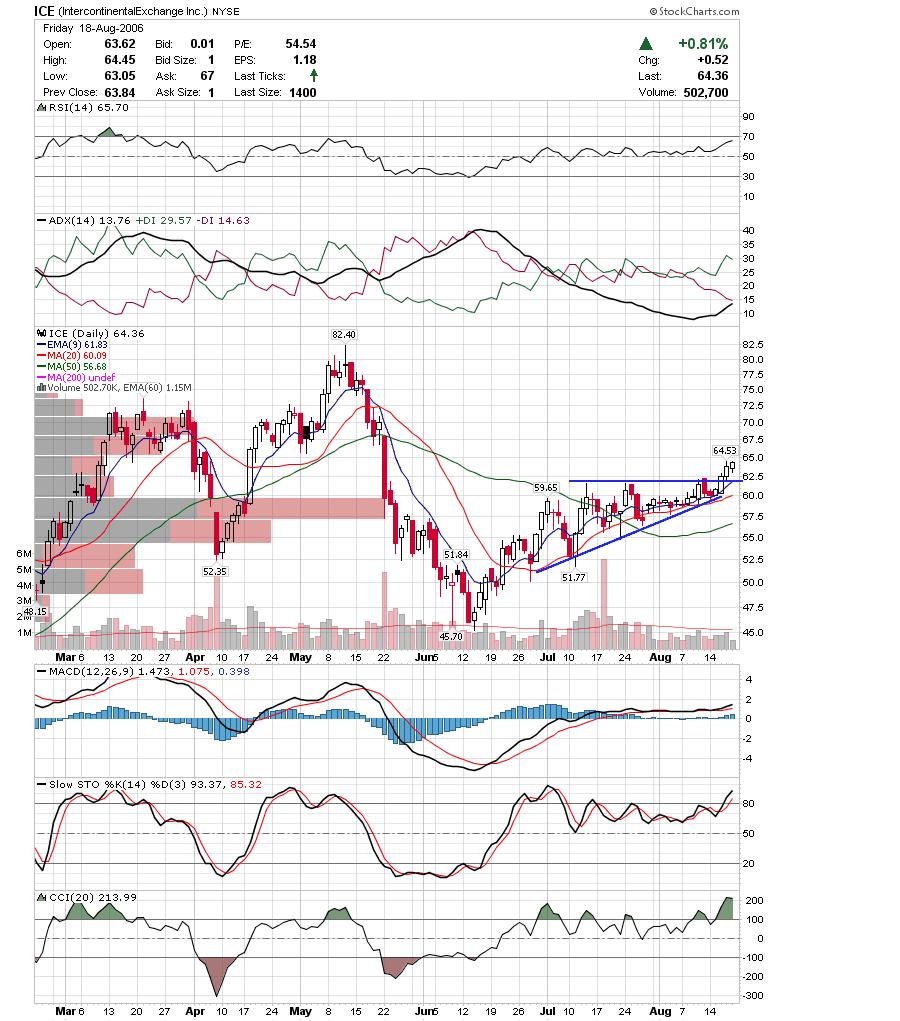
NEU cleared the downtrend and now is consolidating in a bull flag. If it clears the flag it should head to a new high.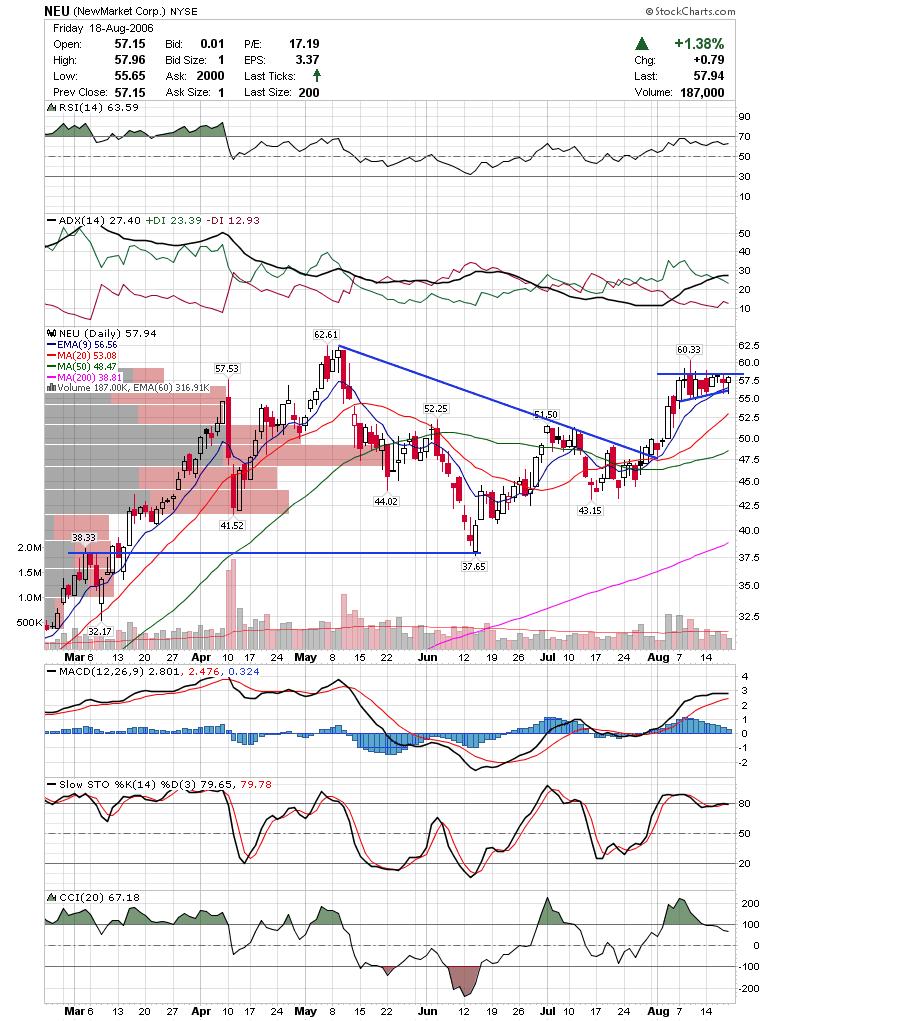
TXU came back to test the breakout area and had a nice bullish morning star candle pattern on support.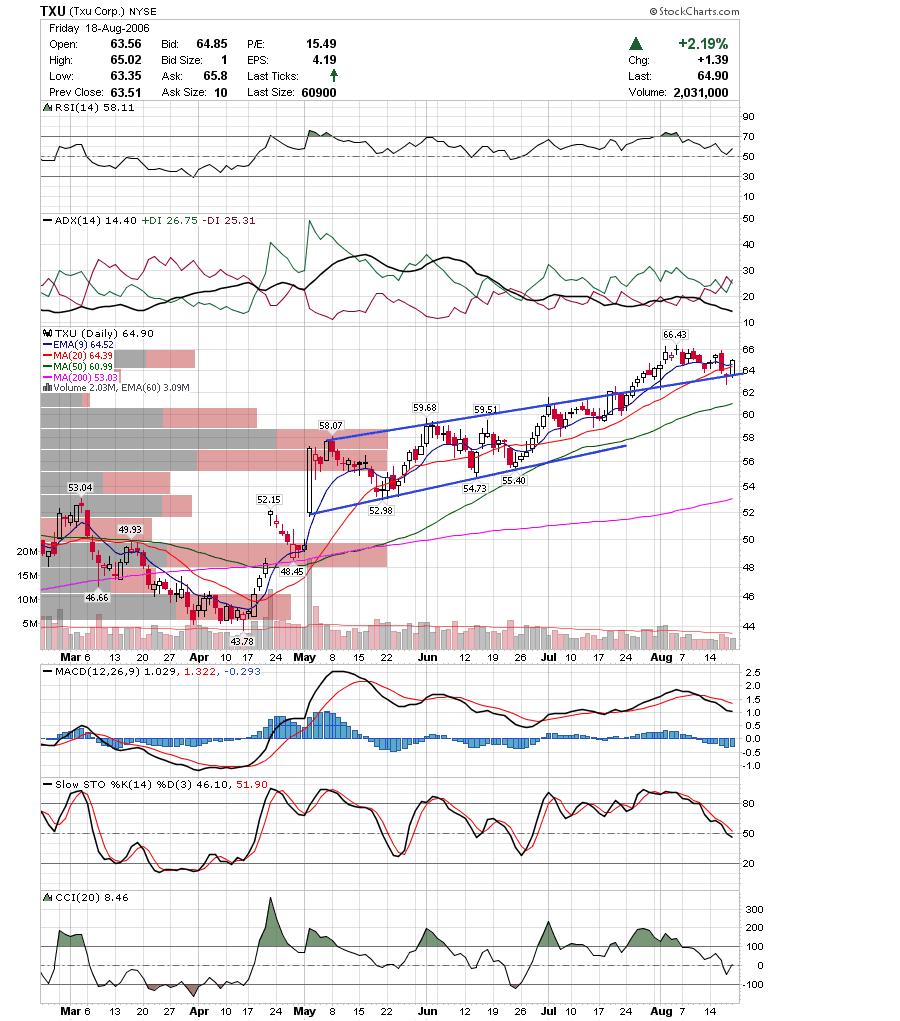
WCC looks to be breaking down here as it was rejected on the descending trendline.
ANDE looks like it may hold up at the bottom of the ascending triangle. I would be careful if I was short as it could break the downtrendline on this attempt.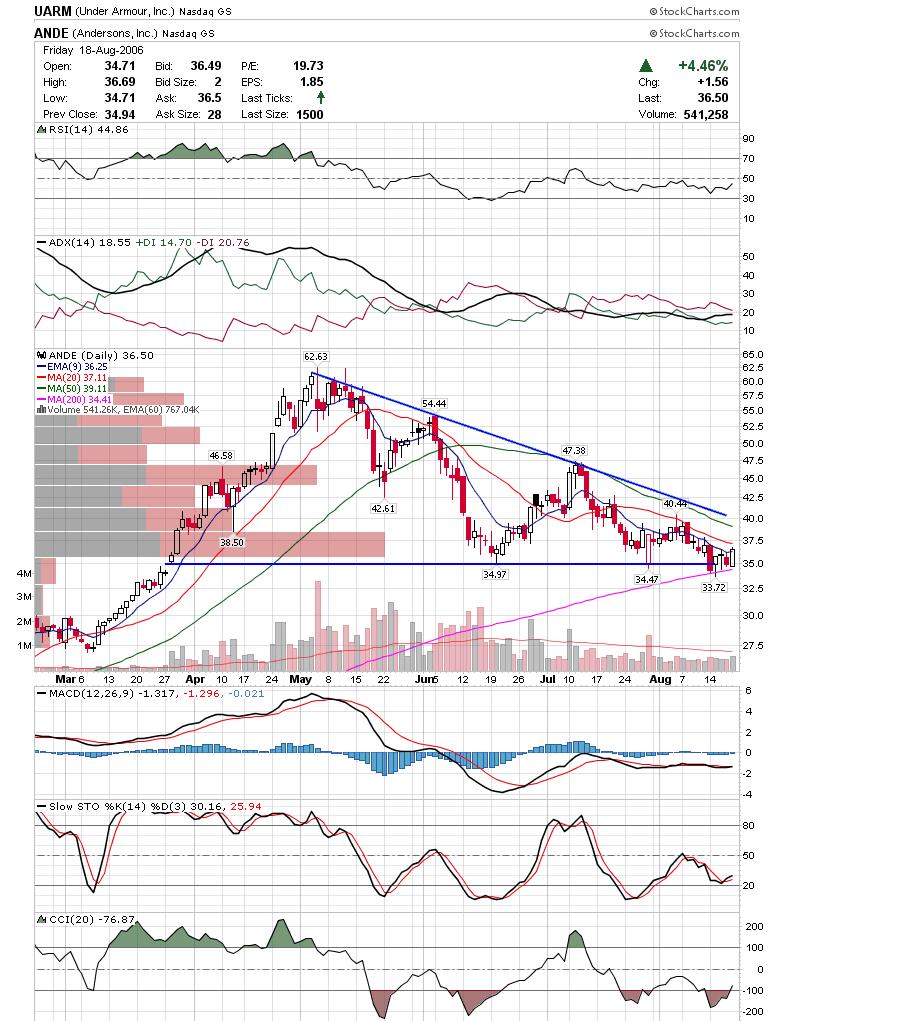
FILE is looking quite bullish with this bull pennant forming.
As pointed out last week VIVO indeed touched the downtrendline. At this point, we wait for a reversal pattern for confirmation.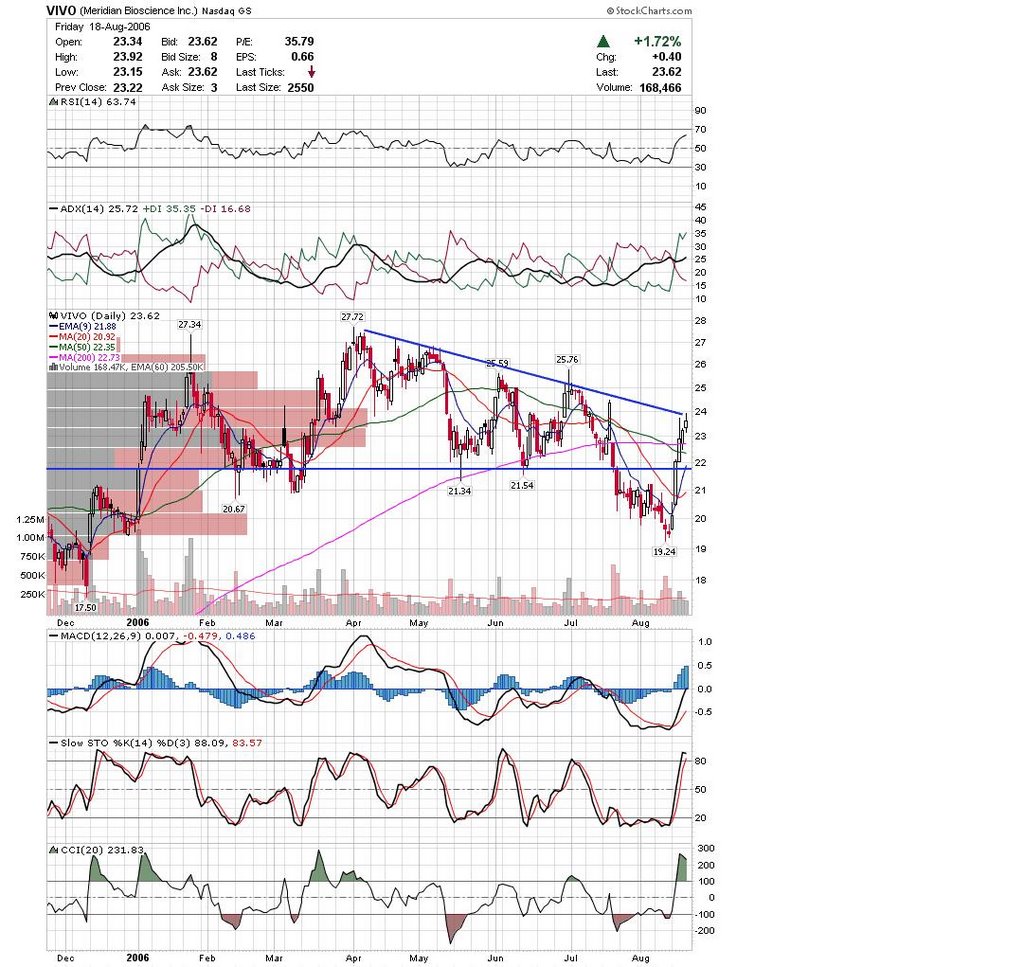
TIE is headed back up to the descending trendline and may be a short again.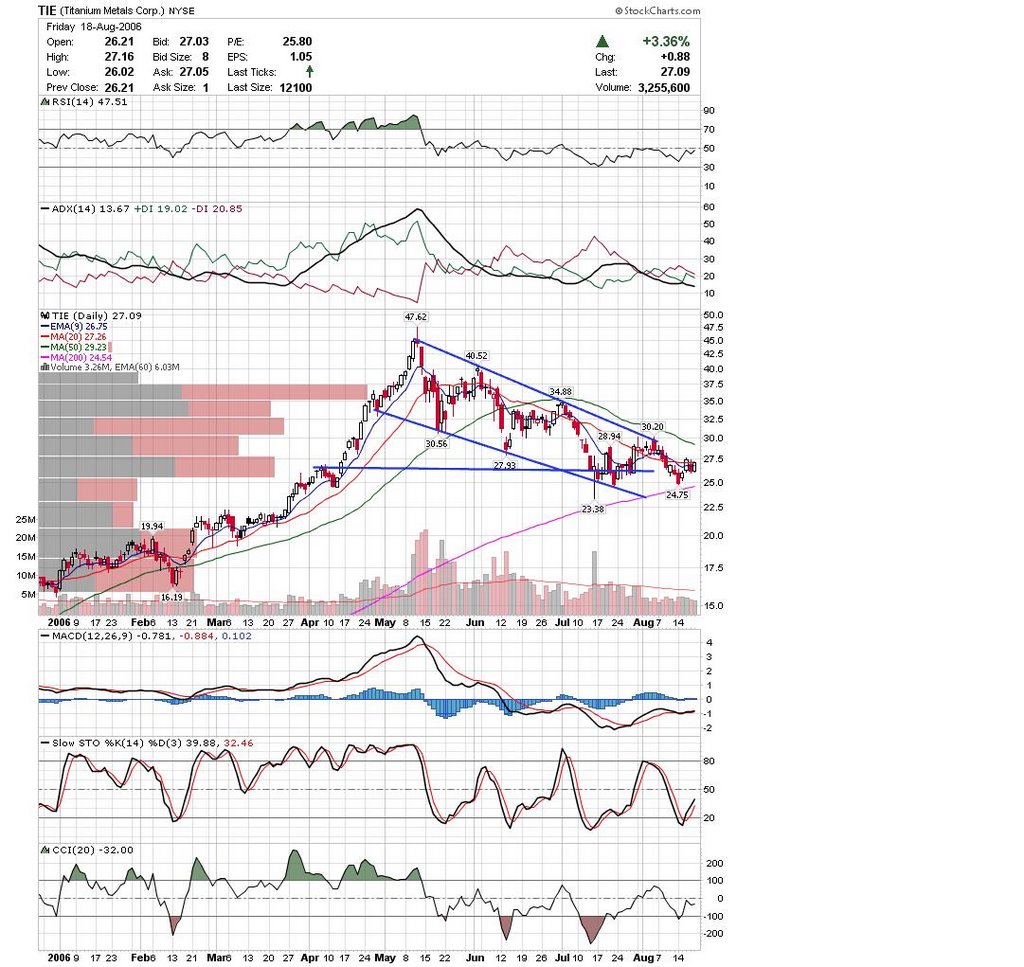
NTRI is quickly running out of room and should make a move anyday now.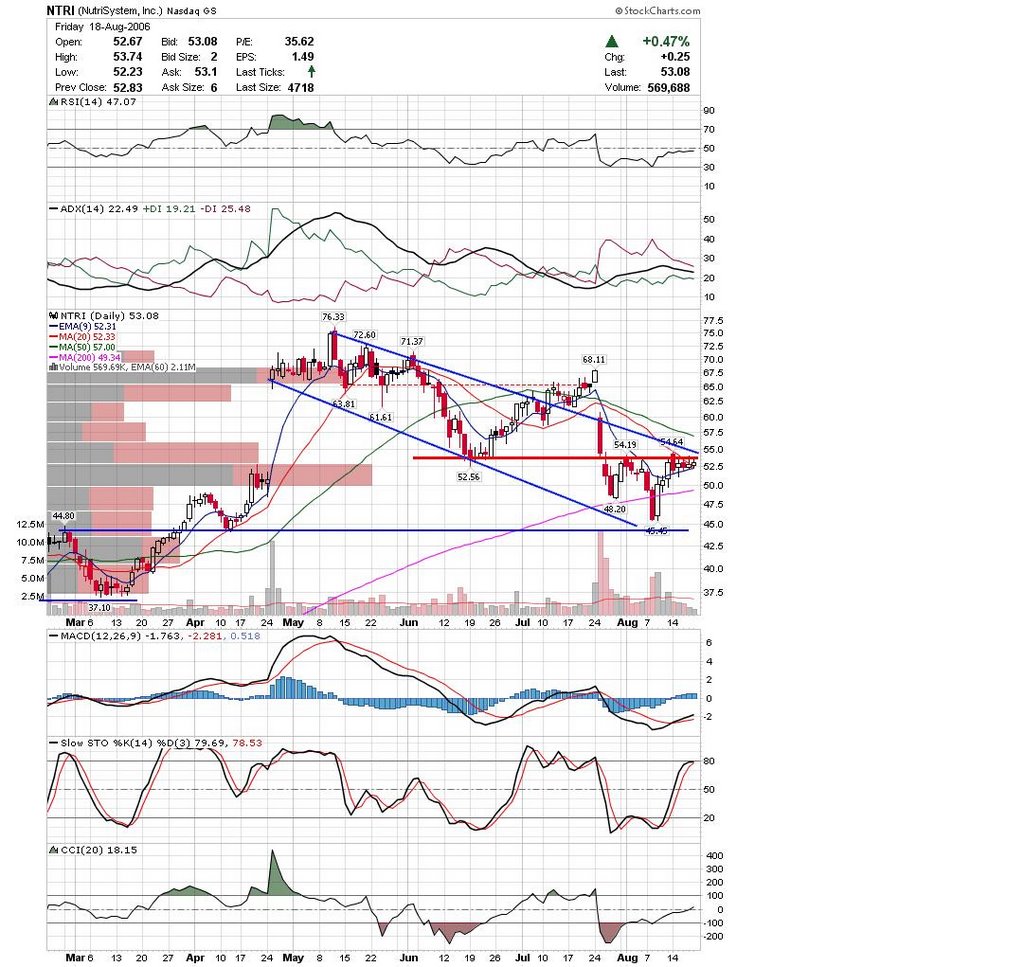 WNR looks like it is trying to find support here at the ascending trendline.
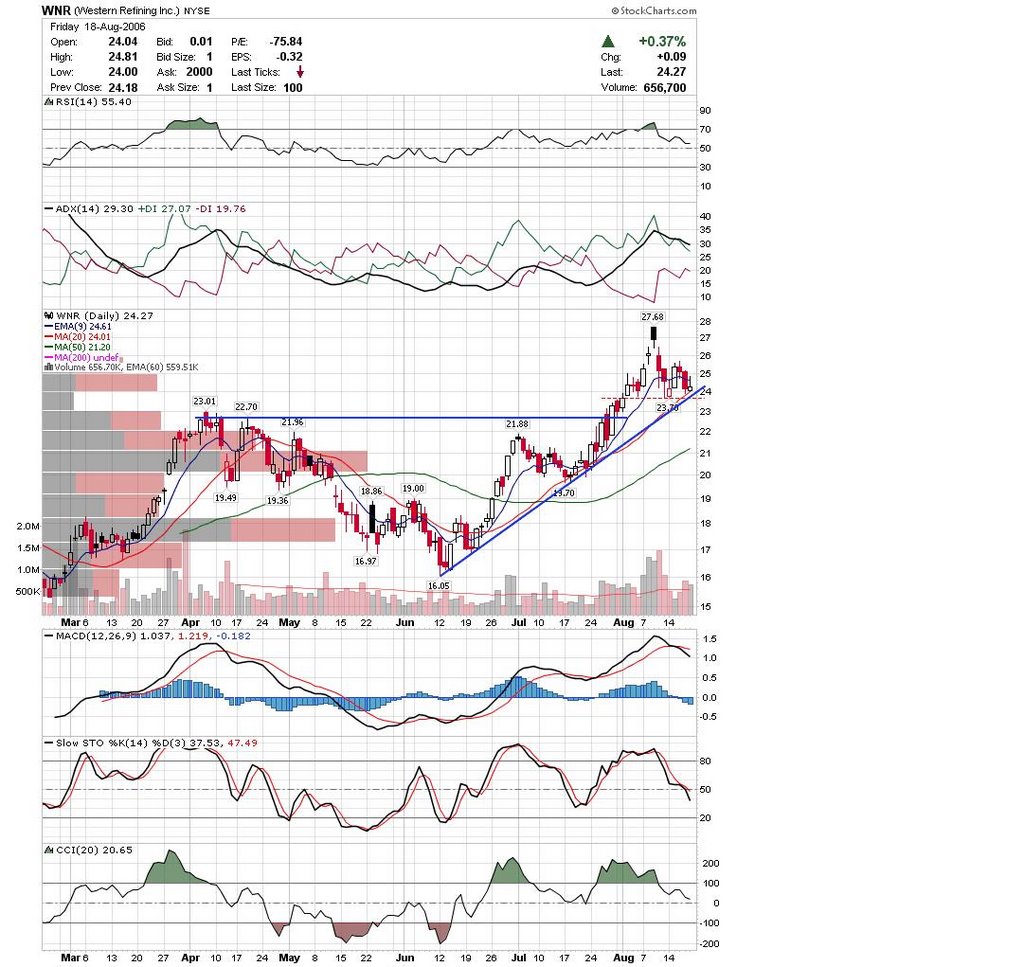
CKFR fell out of this little triangle on Friday and may be headed for a retest of 34.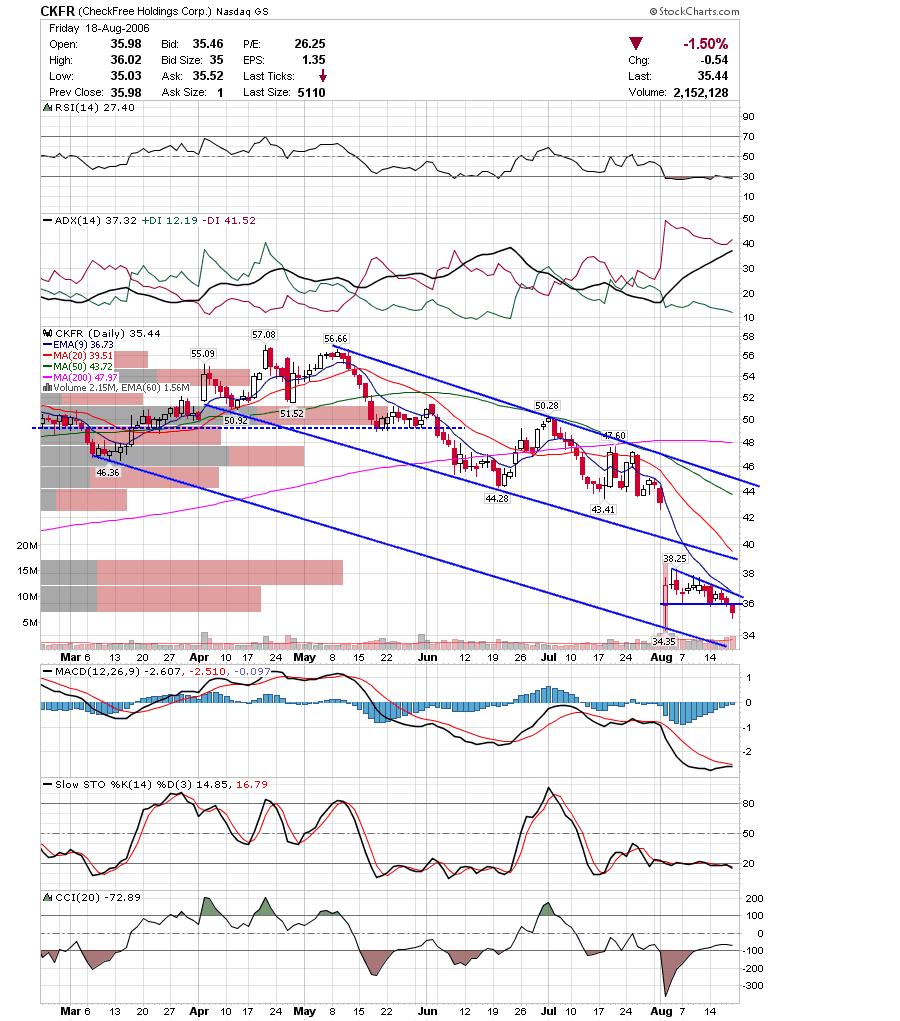 Keep in mind that sometimes on the monday following options expiration there is a counter move to the preceding action which would mean lower prices the next few days. Also, Traderfeed had some interesting data on the days following 5 day highs on the SP500.
Good Luck,
DT


