I will be on vacation tomorrow through Monday so there will be no posts till probably Tuesday. Not much changed today other then indices quickly got to their 20 day sma's. I would imagine the next few days could go either way and probably be a bit choppy as bargain hunters and trapped longs try to be the early birds. The best course of action is to wait a couple days, which makes it nice that I will be on a Ship hundreds of miles out at sea ;) . I am holding 3 long and 2 short positions and about 40% cash, so I think I'm properly leveraged here. Good Luck the next couple days,
DT
PS. Go Dolphins tonight and Broncos Sunday. If anyone is interested, Boogster is having an NFL sportsbetting game this year with first place taking a laptop. I am in and it would be cool to have a bunch of readers in there as well.
This is the difficult part of being a trader. Trying to determine if a drop like today's is signaling that a top has been reached or if this is all part of working off some overbought readings. Today's selling was definitely distribution, but then, that is also a part of normal behavior for markets. The key will be how the indices handle upcoming support levels and whether they will be breached without a fight. It is important to adhere to your stops and wait patiently for things to sort themselves out. I am posting updated charts of the four major indices tonight with certain trendlines drawn in.
First is the SP500. It should find support in the 1290-1295 area and if it doesn't, then that is a clear signal that all is not right with it.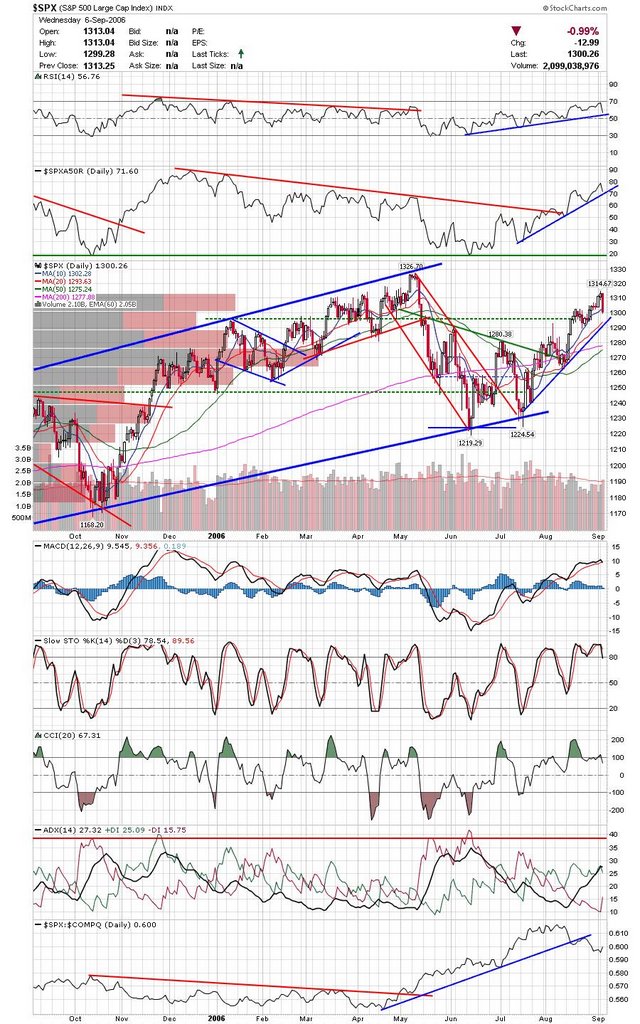 Next is the Russell. Today came close to invalidating the recent breakout and in fact, it may have. Keep an eye on whether it can reclaim the 200sma. My guess is that the best shorts for the next leg down will be small caps as they have been getting hit the hardest on down days.
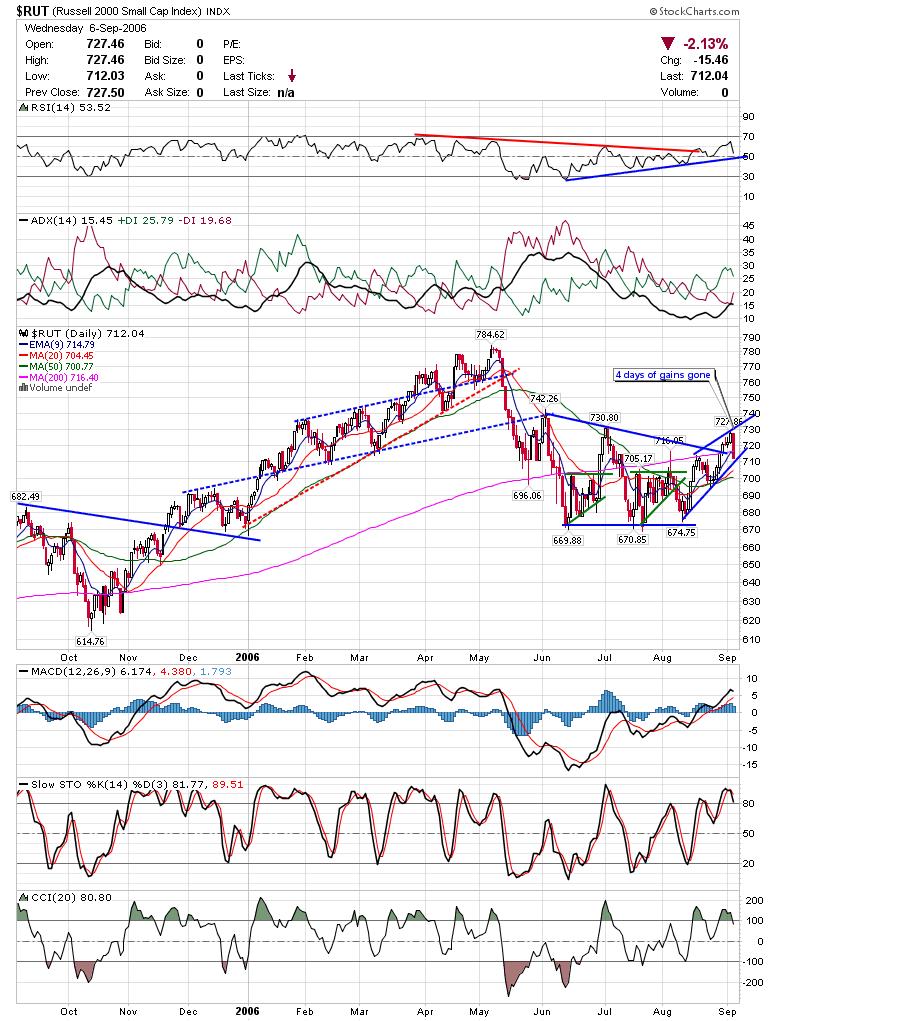 Here is the Nasdaq composite. Todays drop took it right to expected support. What you don't want to see is a few days consolidating near the bottom or under todays range. Notice Volatility getting close to a breakout. That would be bearish.
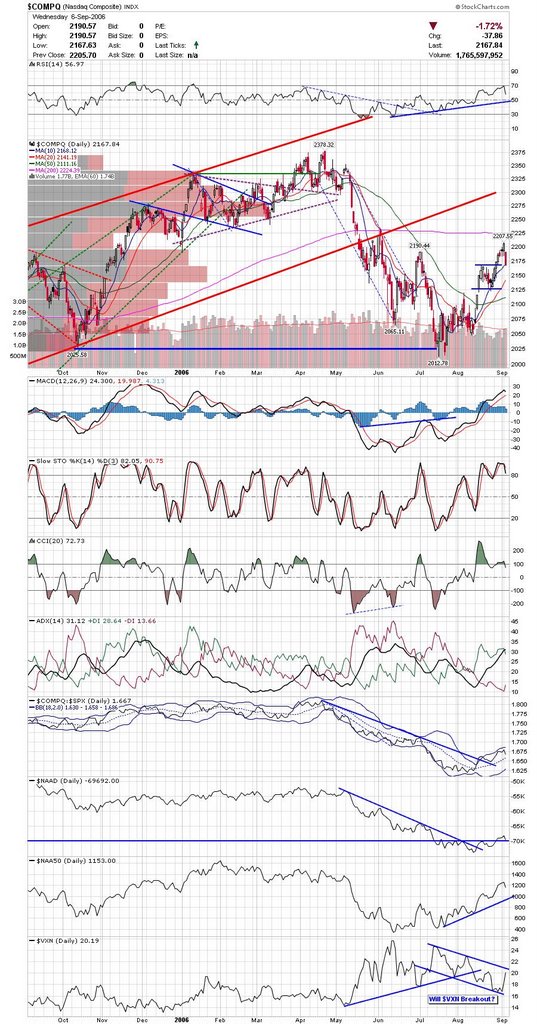 Here is the DJIA. This could be a bearish wedge breakdown and should probably be shorted if it breaks the trendline.
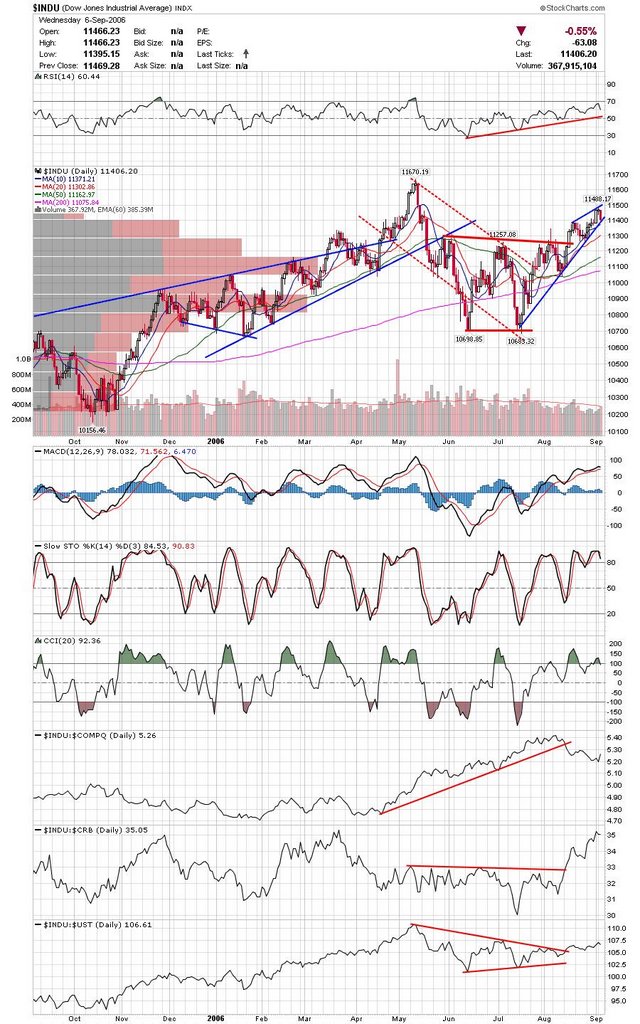 The thing that has been tripping me up lately, is while seasonal influences point down, and while the market internals are pointing down, and economic indicators are pointing down, the markets clearly formed some chart patterns that have yet to reach their targets. The key is what happens with volume and certainly that has been down lately.
Good Luck,
DT
Bulls took over today and closed the markets strongly. The indices are getting quite overbought and may be in need of a breather. That doesn't mean they will take that breather though, so the best course of action is to adhere to your trading plan and be cautious about any new entries at this point. We had some decent moves in some of the charts I highlighted last night led by a strong move in BTJ. I am adding a few charts tonight, but keep an eye on the ones mentioned last night as well.
OIH is either ready to break this trendline or ready to offer another short entry. It's best to wait for confirmation at this point.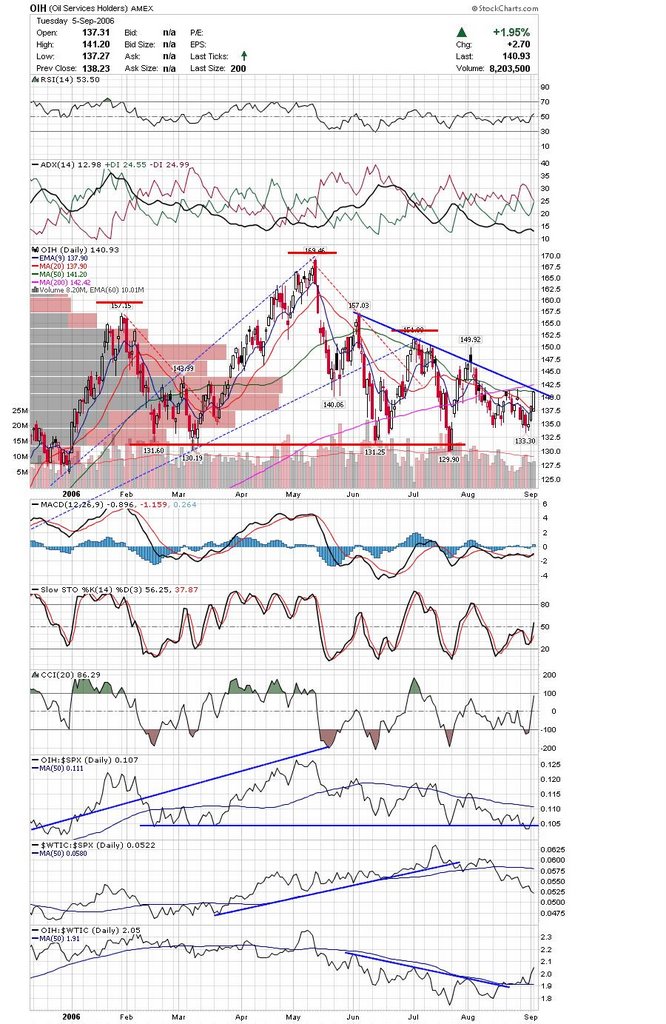 INFA has been getting support in the mid to low 14's as shown by the tails on the last three candles. There is still plenty of room left to the upside here as well.
 ODFL looks like it may resume the downtrend here.
 BWNG may offer a scalp play tomorrow if it follows through on todays move.
 NTRI had a strong day and is still possibly forming a reverse head and shoulders here.
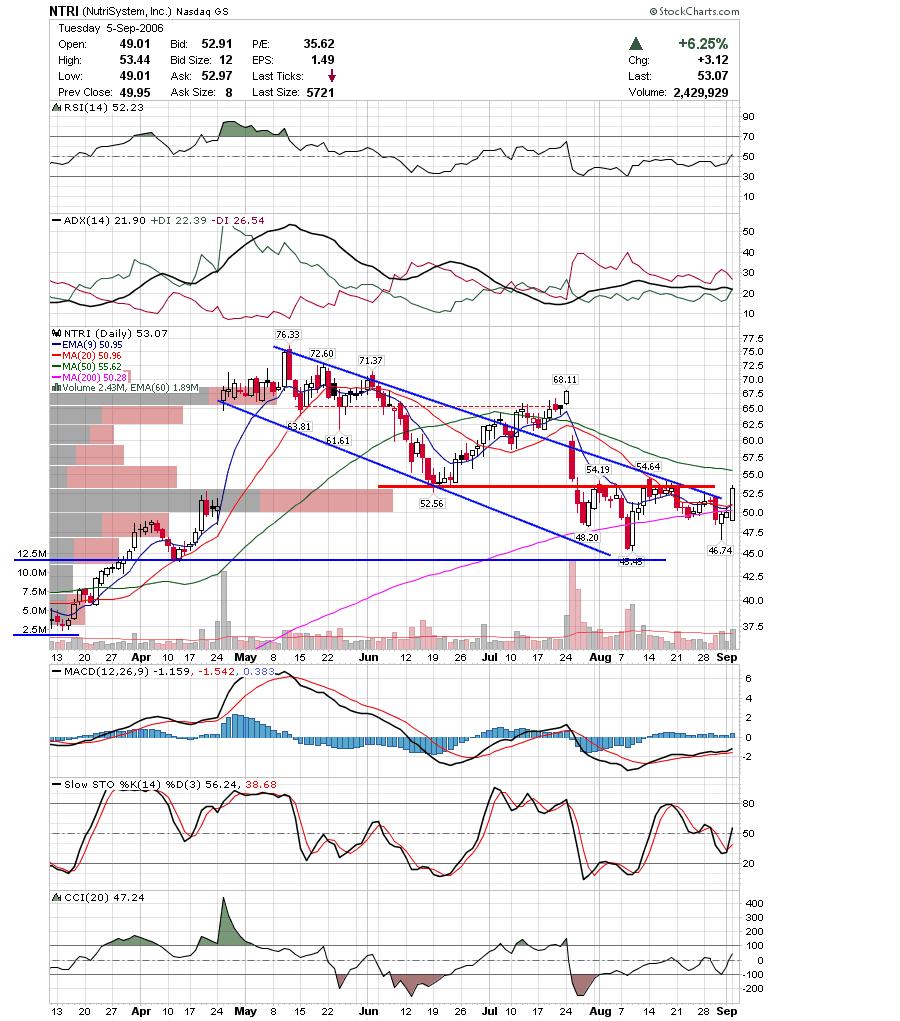 My buddy Dave called TIE a couple days ago and unfortunately I let it go. It looks like a bottom may be in here.
 IIIN is in a similar sector and may be close to breaking out as well.
Good Luck,
DT
As usual, I am posting a ton of charts for the weekly watchlist. This week will definitely be interesting as people are expecting all sorts of things now that the summer trading season is over and the bearish fall season is upon us. With the indices overbought, I'm not sure it's a good idea to start initiating a bunch of intermediate swing trades. Of course, the indices can continue to remain overbought longer and the best plays will probably be quick hits with tight stops. It is probably a good idea to not be fully invested as it is quickly becoming a dangerous environment. Funny enough, I found mostly bullish looking charts but I've found this to be a contrary indicator in the past, so I am definitely on alert for a reversal.
Oil is oversold and may get a technical bounce pushing the Oil stocks back up. Here is a chart of ALJ showing a hammer on support.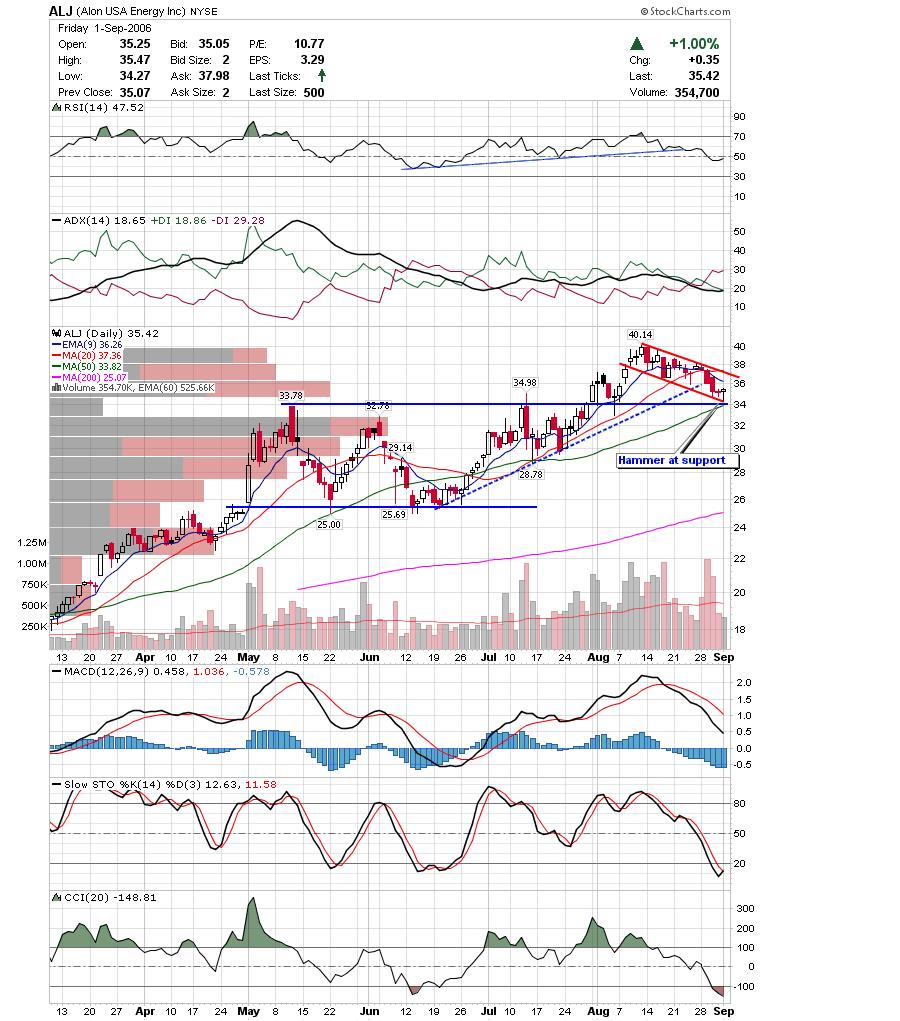 CXW has been trading a very tight range and looks like the move will be up.
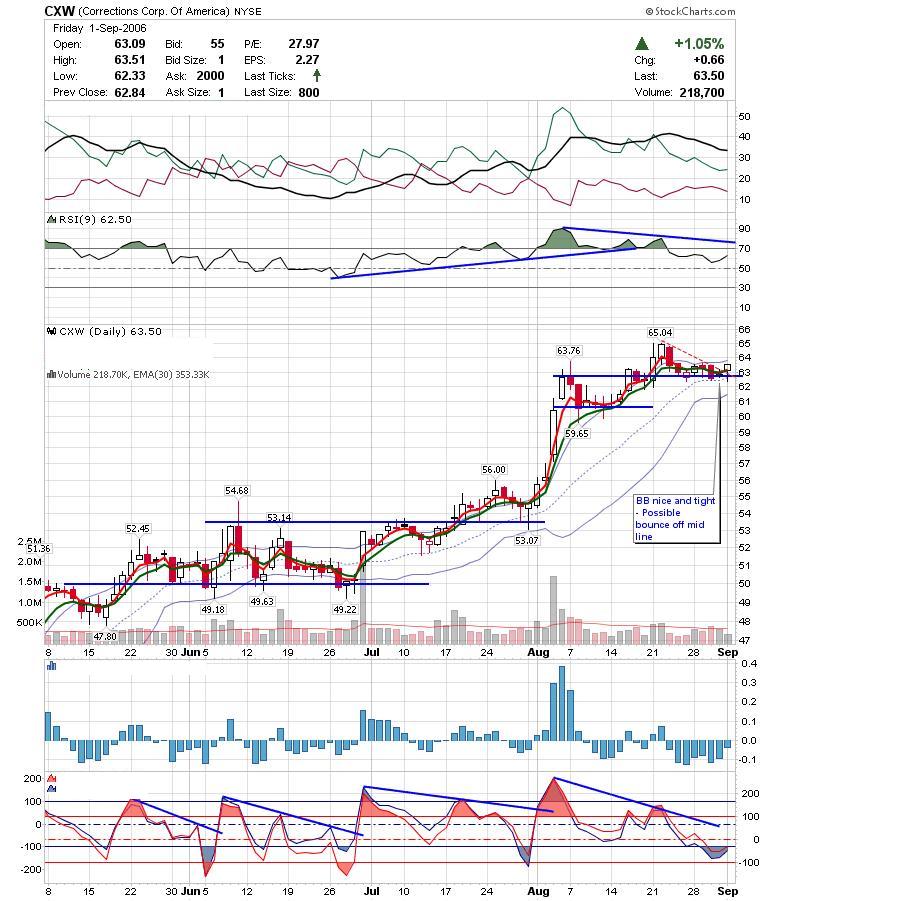 GYMB recieved strong support at the rising trendline and may be headed back to the top of the trading range.
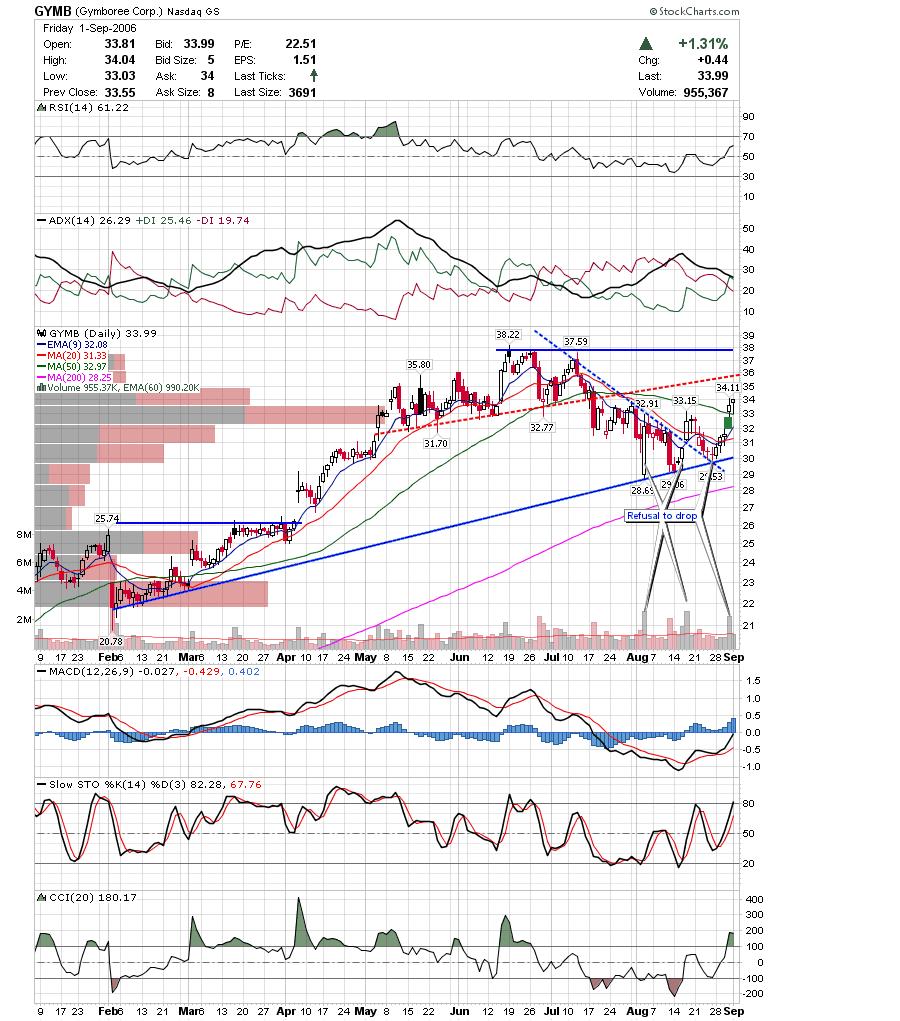 ETP has been consolidating at the upper range of the breakout candle and may be ready to move higher.
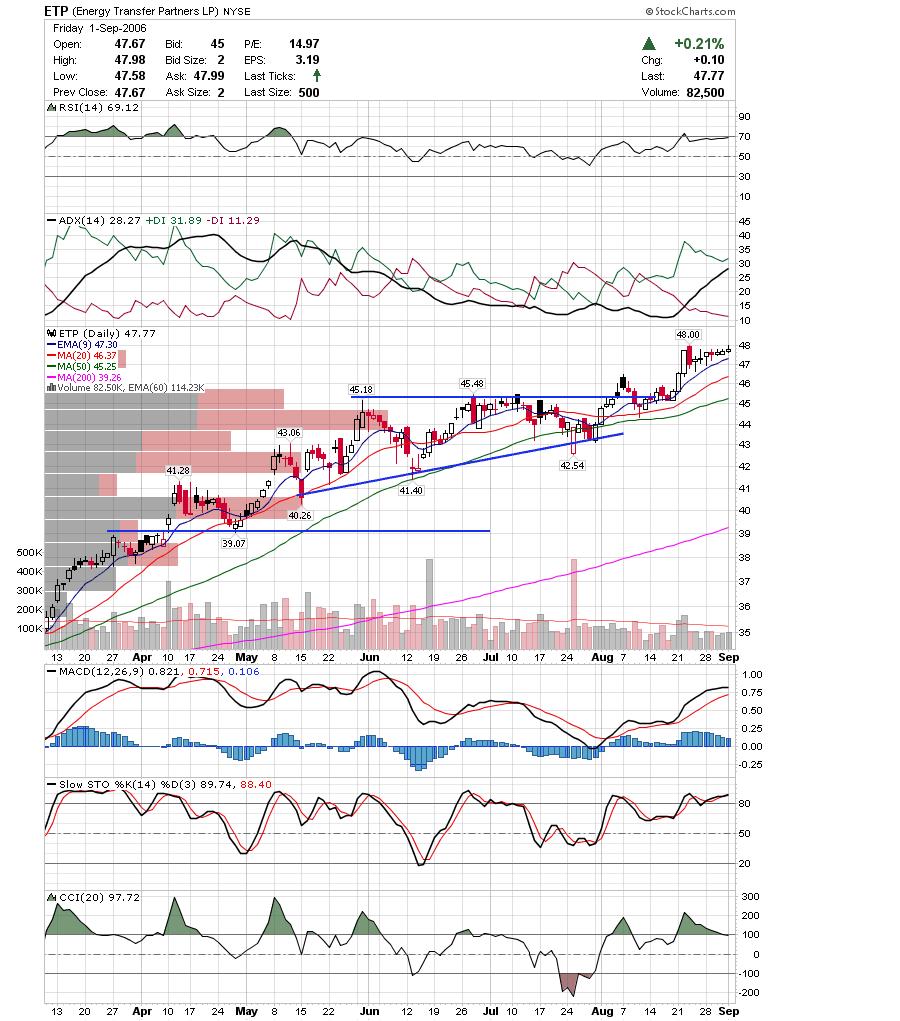 LVS may be ready to form the right shoulder of a head and shoulders top by falling out of this rising wedge.
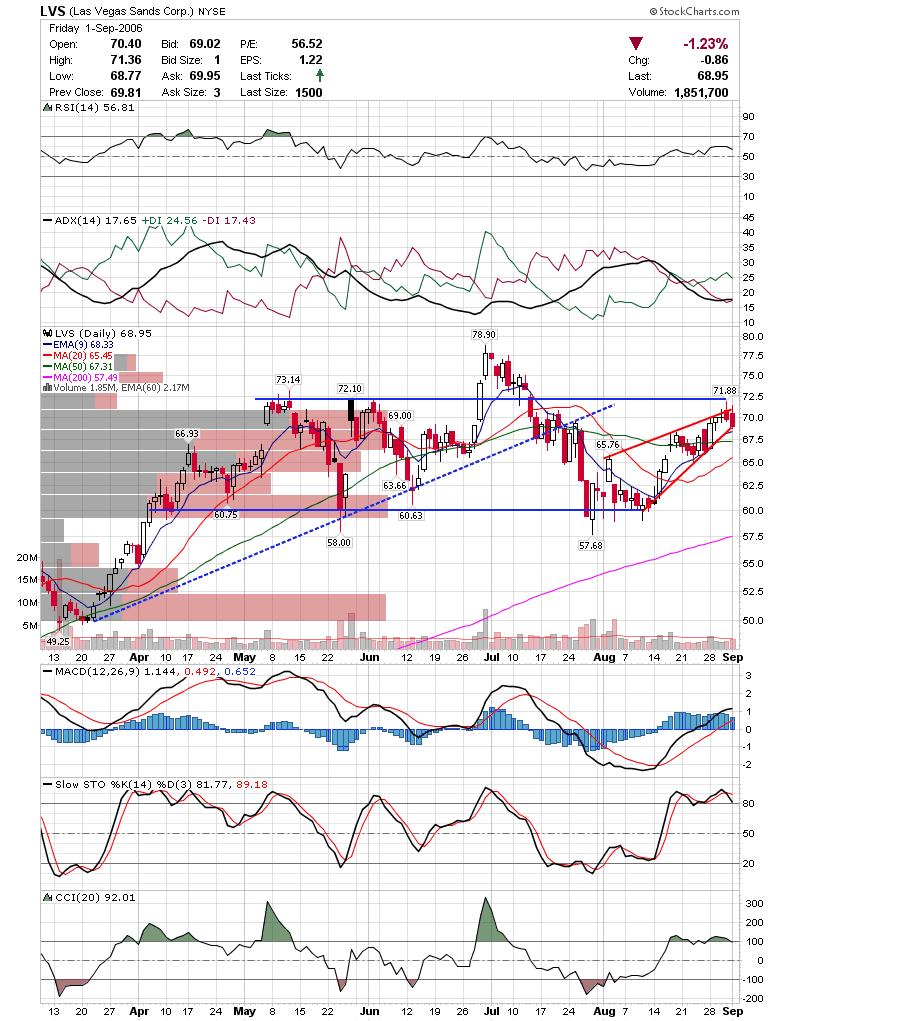 I'm keeping an eye on SLW to see if takes out it's all time high or bounces back and consolidates.
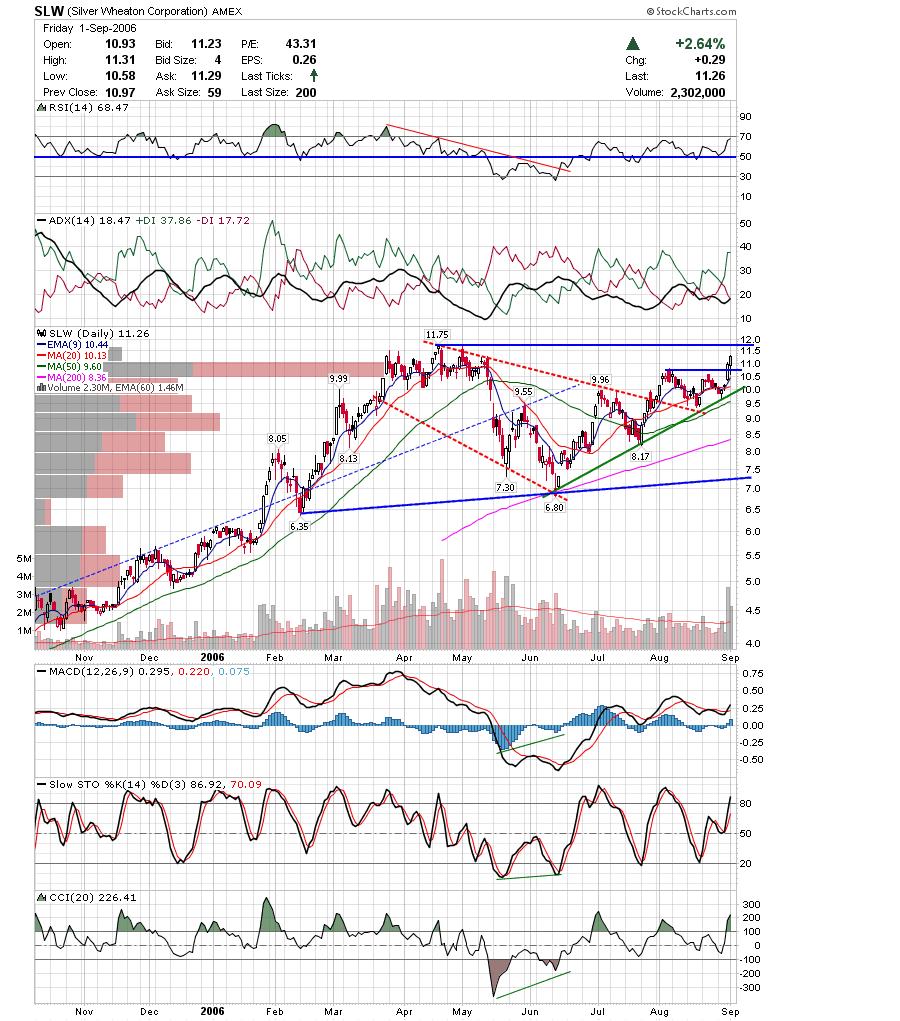 CCJ may continue to follow through here after breaking out of a triangle.
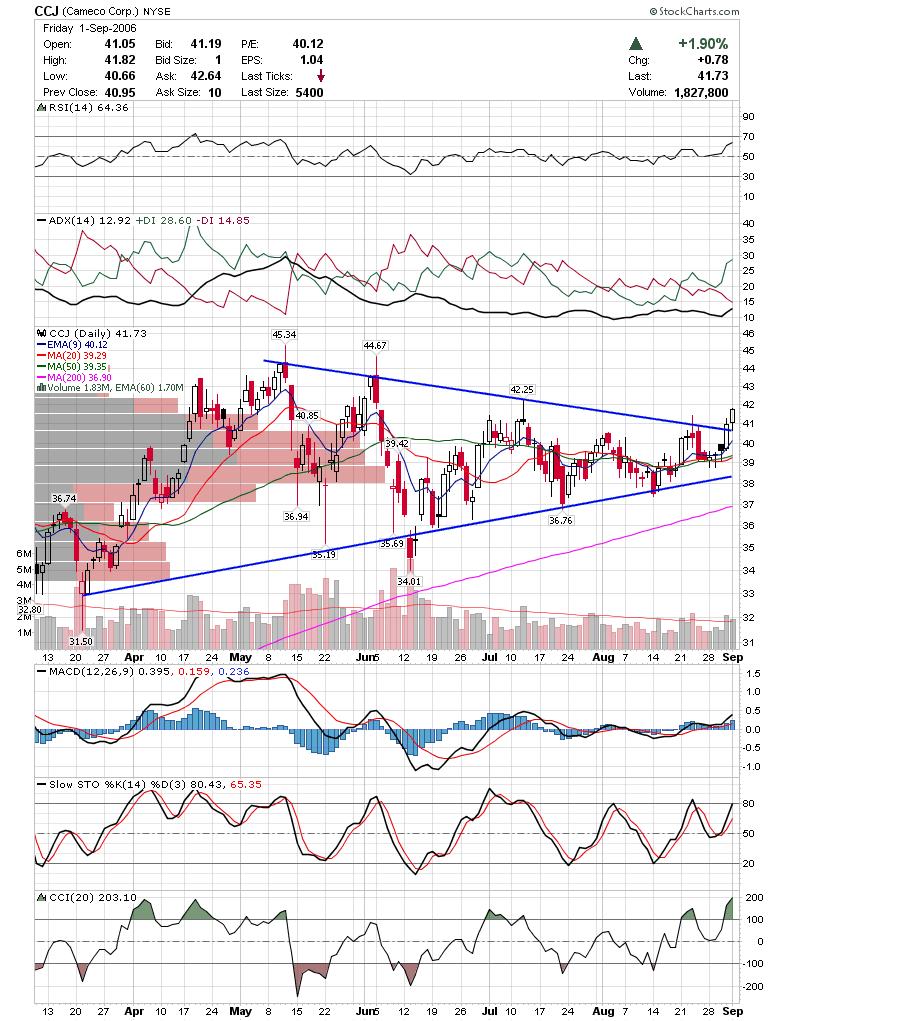 NTAP may breakout to the upside if it can clear this tight consolidation.
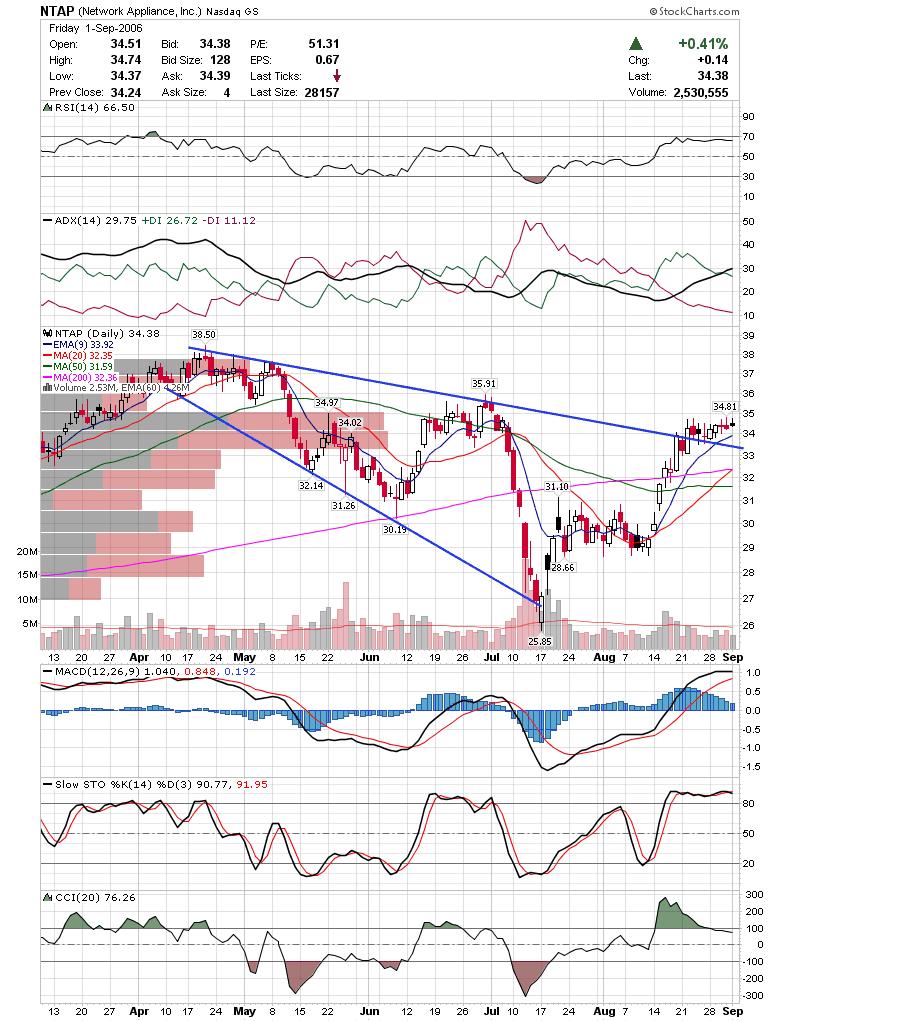 ARD is wedged between support and resistance and is worth watching to see which way it breaks.
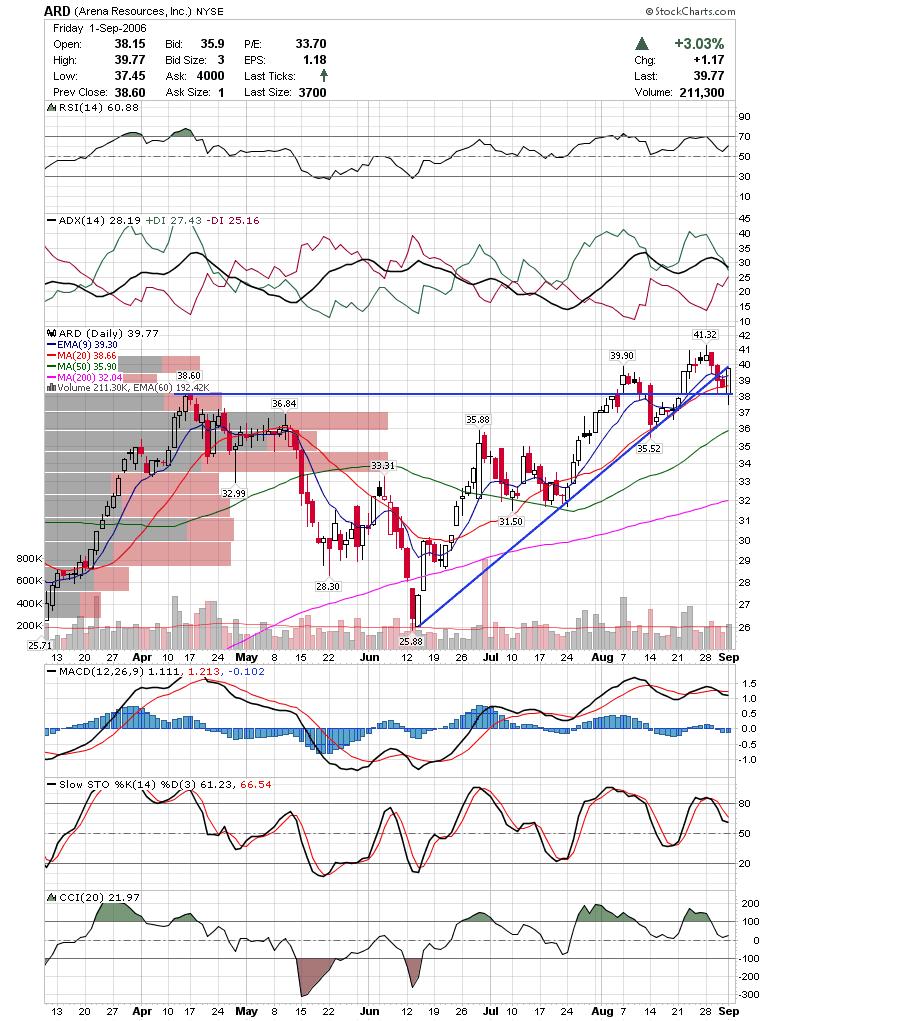 BTJ is starting to coil up for a big move. It looks like it will be higher especially after moving higher up on the IBD 100 this weekend.
 EZPW looks like it will end up at least testing the upper resistance trendline.
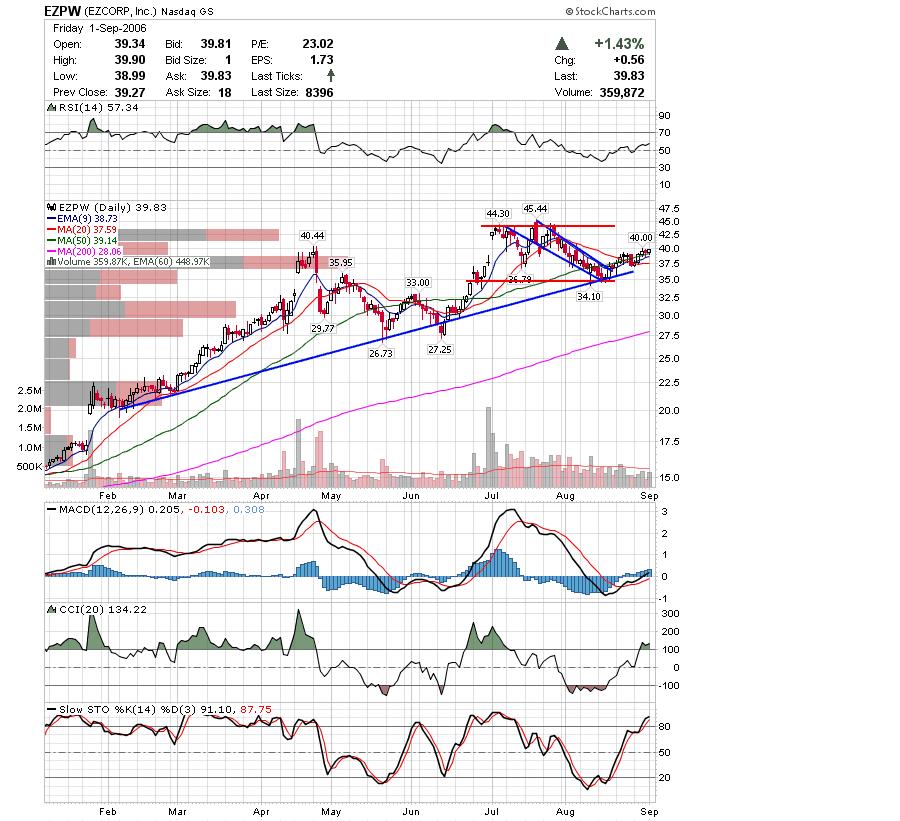 MWIV found support and looks like it will attempt another assault on the upper trendline resistance.
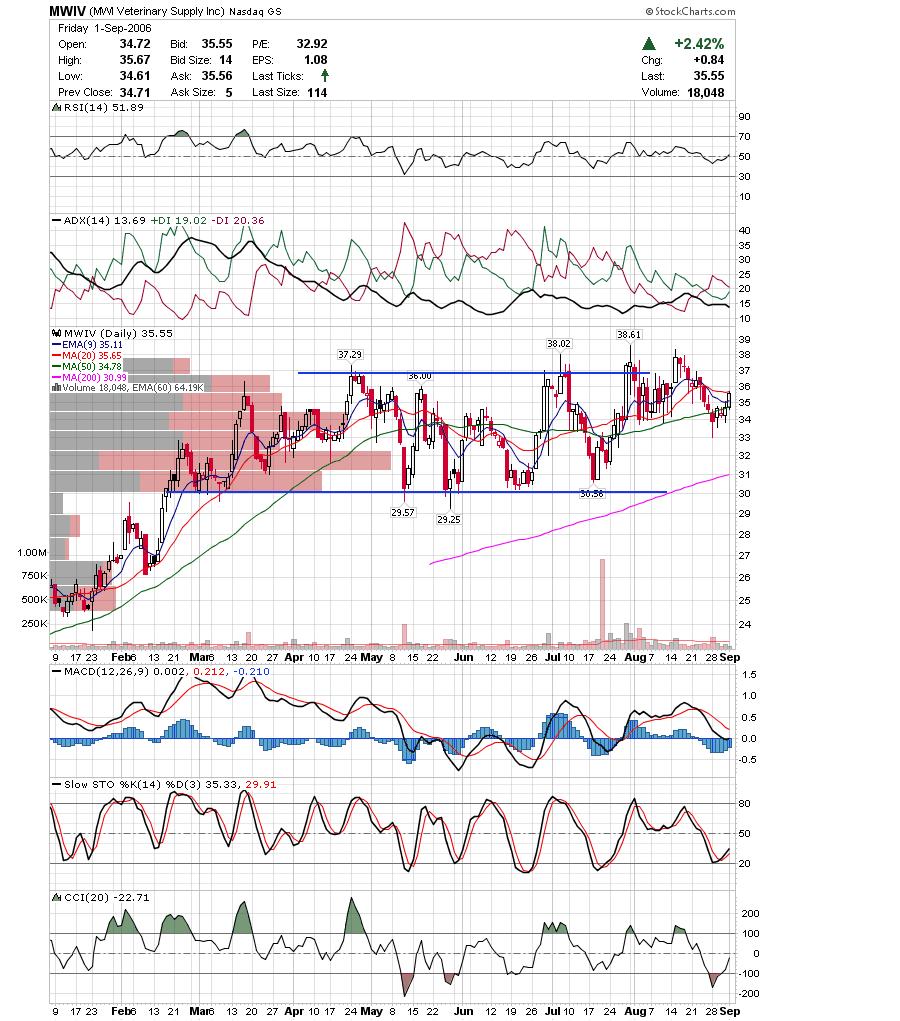 OFLX is consolidating in a bull flag pattern but the very low float makes this very difficult to trade.
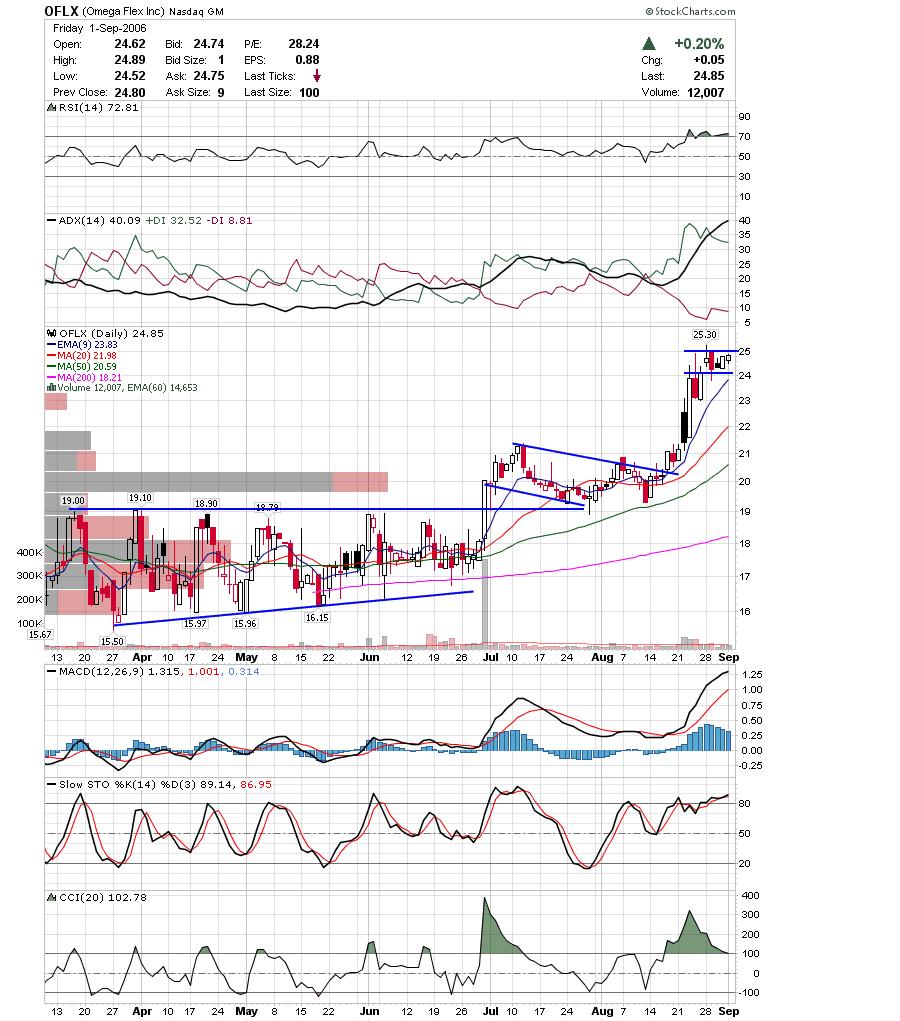 OKE looks like it is ready to resume the breakout after clearing this pennant pullback.
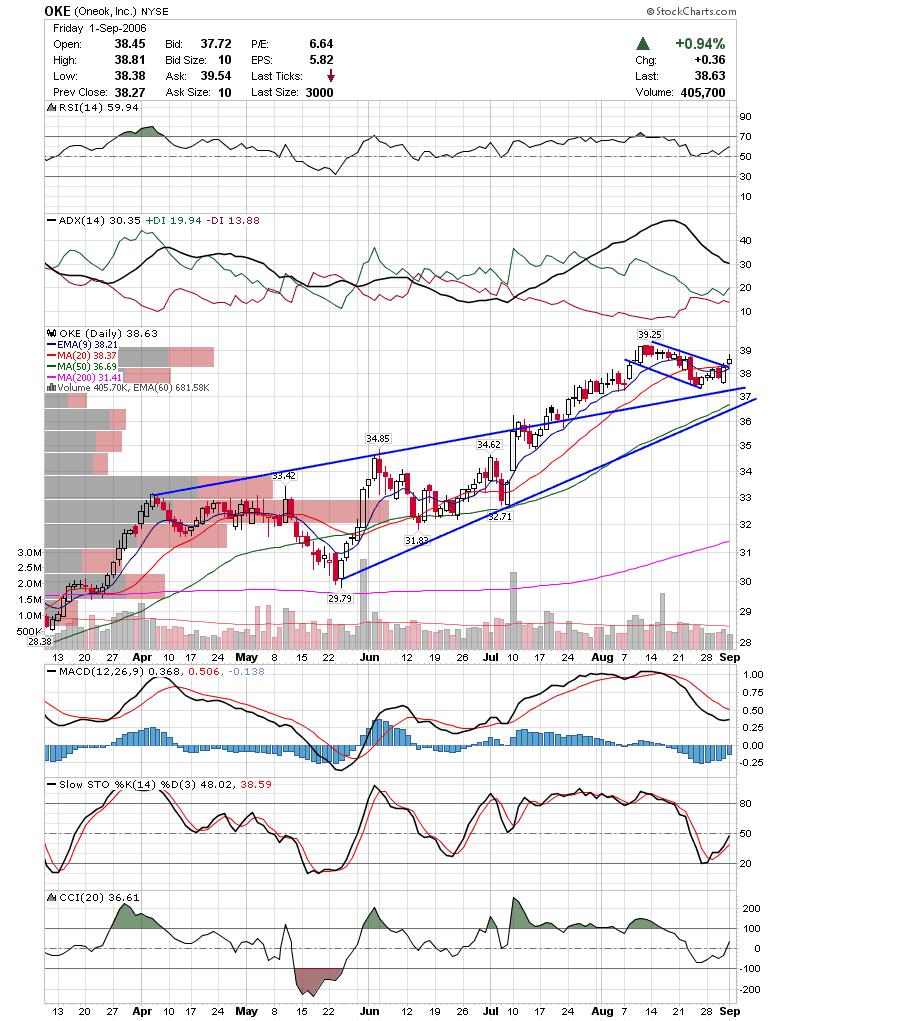 PVA continues to try and clear formidable resistance. If it can clear Fridays high, it may accomplish the breakout.
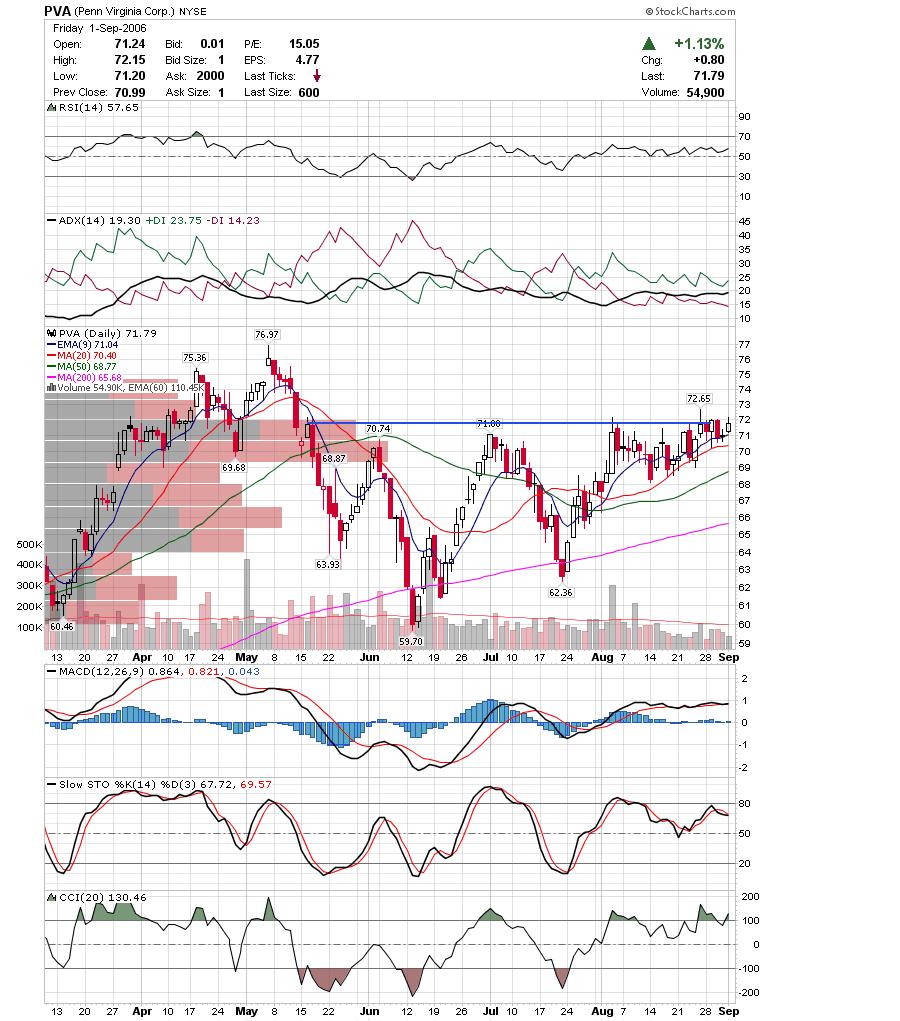 TWGP is high on my list this week as they cleared the triangle but haven't followed through yet.
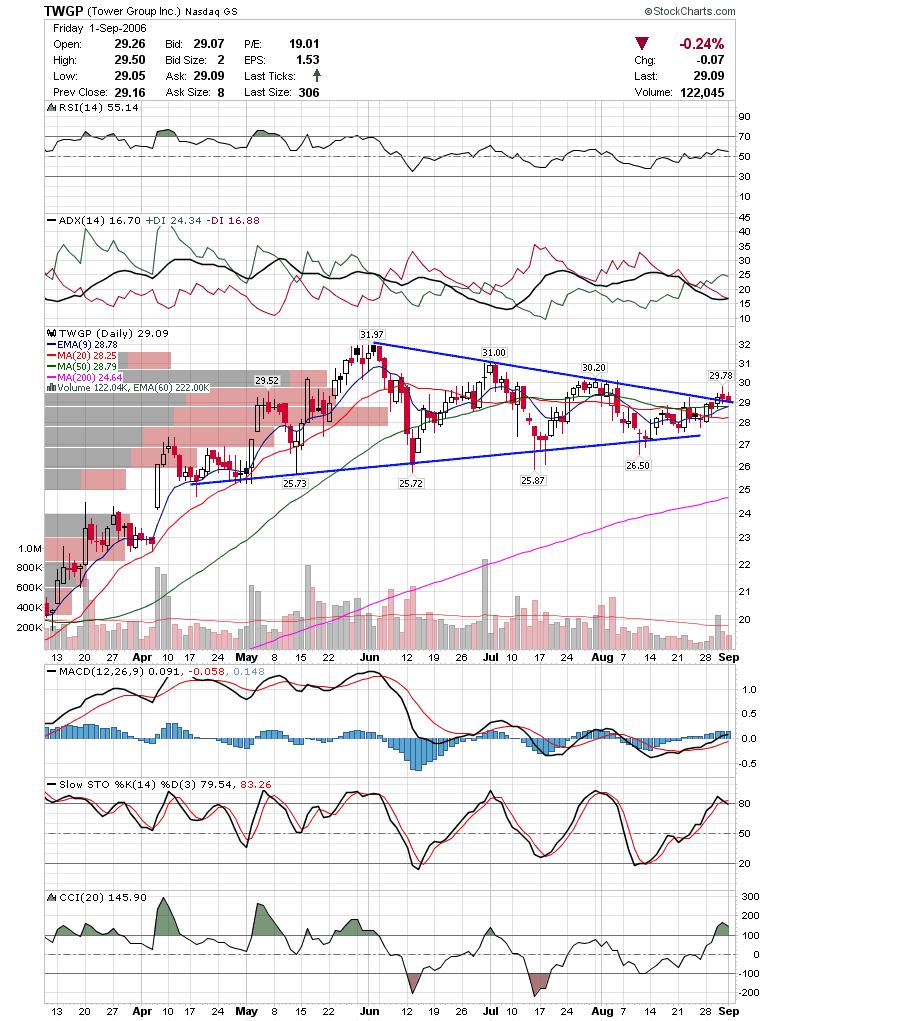 TXU opened weak on Friday and finished strong right up to resistance. I will be watching this one as well for a follow through move to the upside.
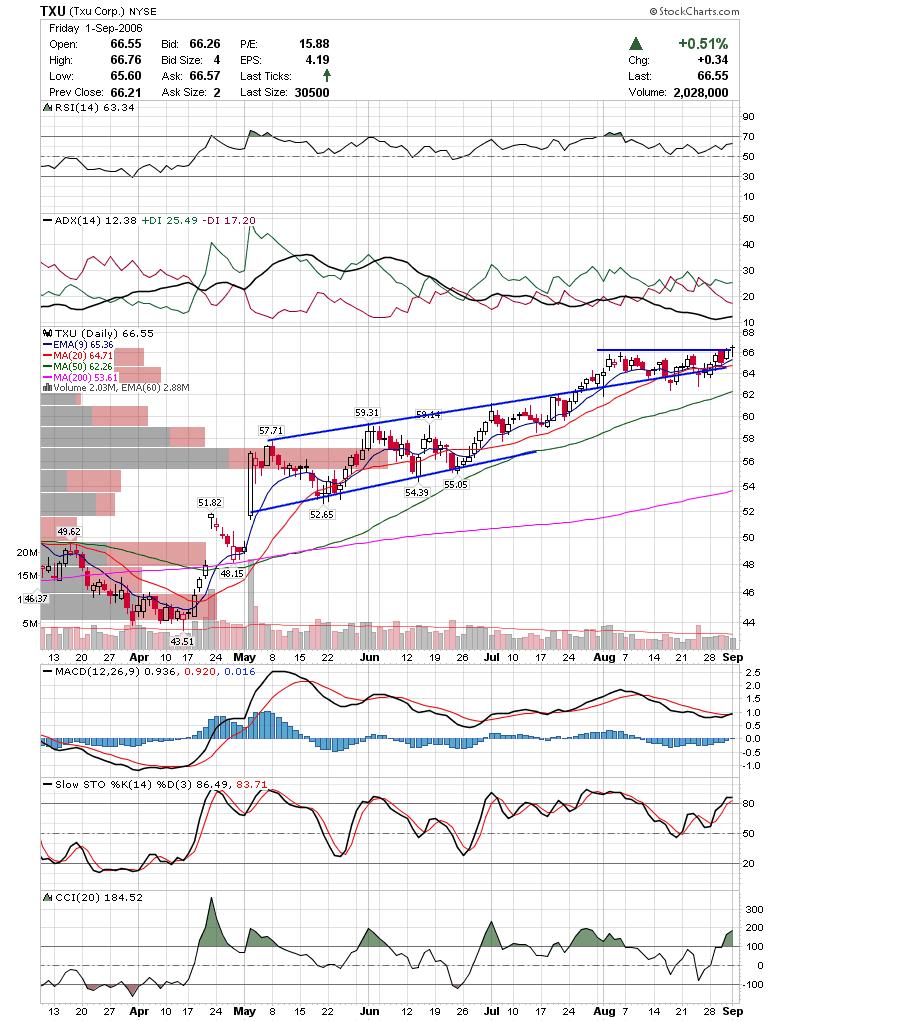 AKAM is close to breaking out as well. This was one of the better looking tech stocks I looked at.
 STLD may be forming a large double bottom base as it cleared the downtrend channel for the most recent leg down.
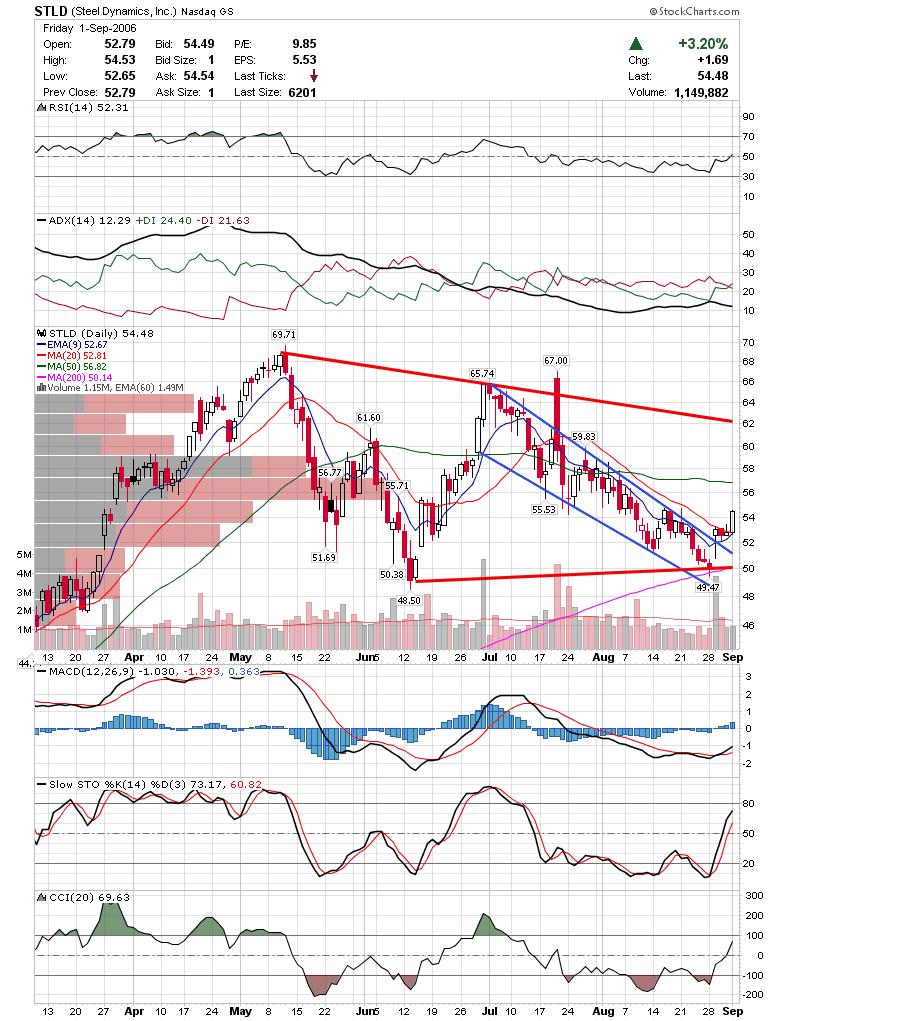
Here are some interesting links I read this weekend.
- Fallond's roundup of stockcharts.com public charts again. Great job of him sifting through the charts and highlighting some interesting ones.
- Maoxian is feeling bullish after checking out the put/call ratio.
- Great article by Tim Wood on how he combines cycles with Dow theory.
- The Stock Bandit's three signs you have a pet stock.
Good Luck,
DT


