Internal Strength

Posted by downtowntrader | 10/05/2006 07:42:00 PM | 0 comments »

The indices didn't move much today, but there was a lot of strength underneath, particularly on the Nasdaq and smallcaps. Materials and Energy were the leaders as far as sectors are concerned. Here are a few links worth checking out:

  • Traderfeed had one of the most interesting posts I've seen in a while on Program trading and TIKI.
  • While we're on TIKI, tradethemarkets has a video seminar on market indicators.
  • Martin Goldberg is seeing the same potential bottom on Gold and Silver miners.
  • Kirk on trading while traveling
  • I stumbled on Barry Ritholtz' Apprenticed Investor series the other day and thought it was great. Check it out.
No charts tonight. Lot's of what I've posted this week is moving nicely so be sure to start protecting your profits.

Good Luck,

DT

Commodity Capitulation?

Posted by downtowntrader | 10/04/2006 09:08:00 PM | 4 comments »

The Markets had a very strong move higher with volume surging today. We may be seeing a massive short covering move here, as bears may capitulate. One of the more interesting plots today was the reversal of commodity related stocks. This morning I saw oil and gold stocks tanking and my thoughts were that it may get ugly. I had a few short positions on oil stocks and I felt pretty comfortable around lunch time with them. Early in the afternoon I realized that they were at the high of the day and volume was coming in. I covered all of them early. This may of been a capitulation move as the last group threw in the towel. While I'm not calling a bottom, my guess is that we will see higher prices here the next few days and quite possibly much higher prices. If everyone is still bearish and waiting to short the next move up, then these stocks could "climb a wall of worry" much like the indices have the past few weeks.

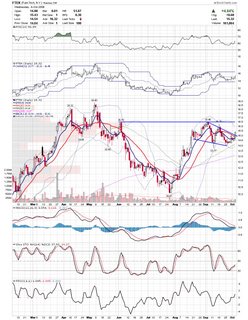
FTEK is trading a great cup and handle here breaking out of the handle today.

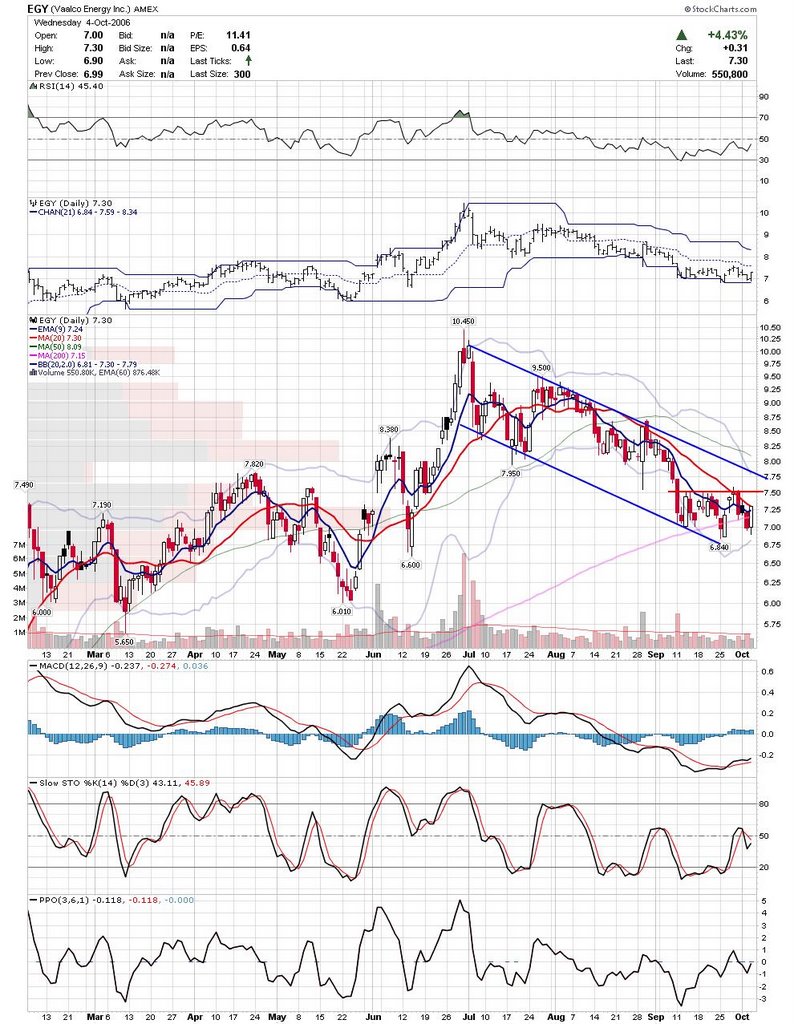
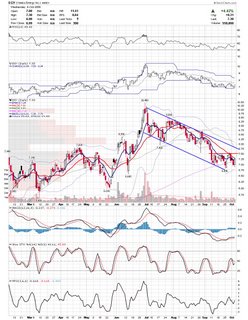
EGY is possibly bottoming here with a little triple bottom at support. It needs to clear this channel to get exciting though.


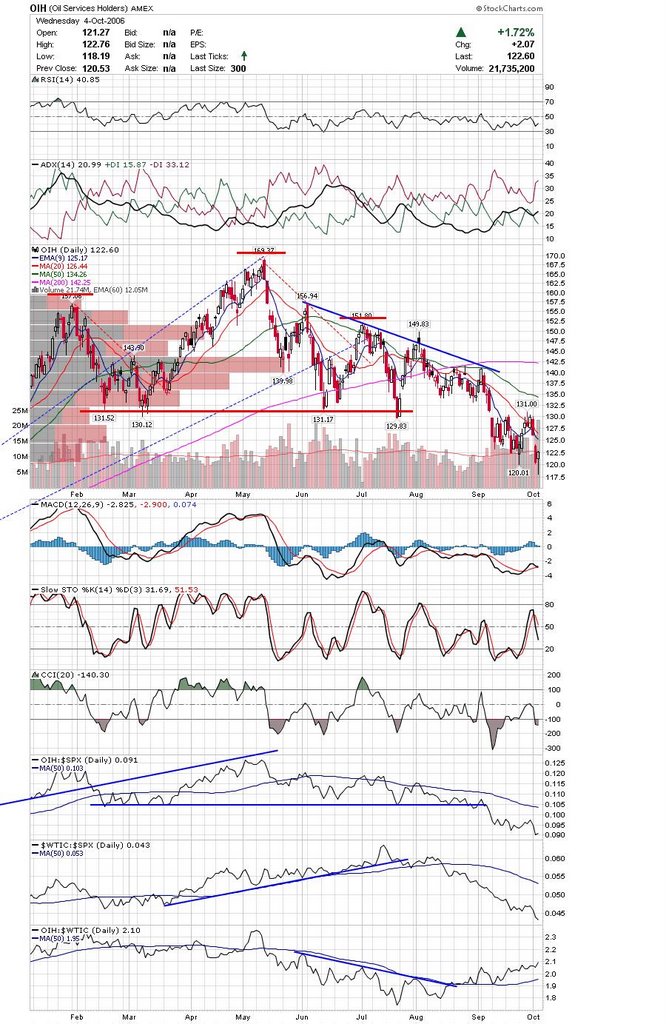
Here is an updated look at the OIH etf. It clearly has broken down, but may retrace back to the breakdown area or the down trendline.

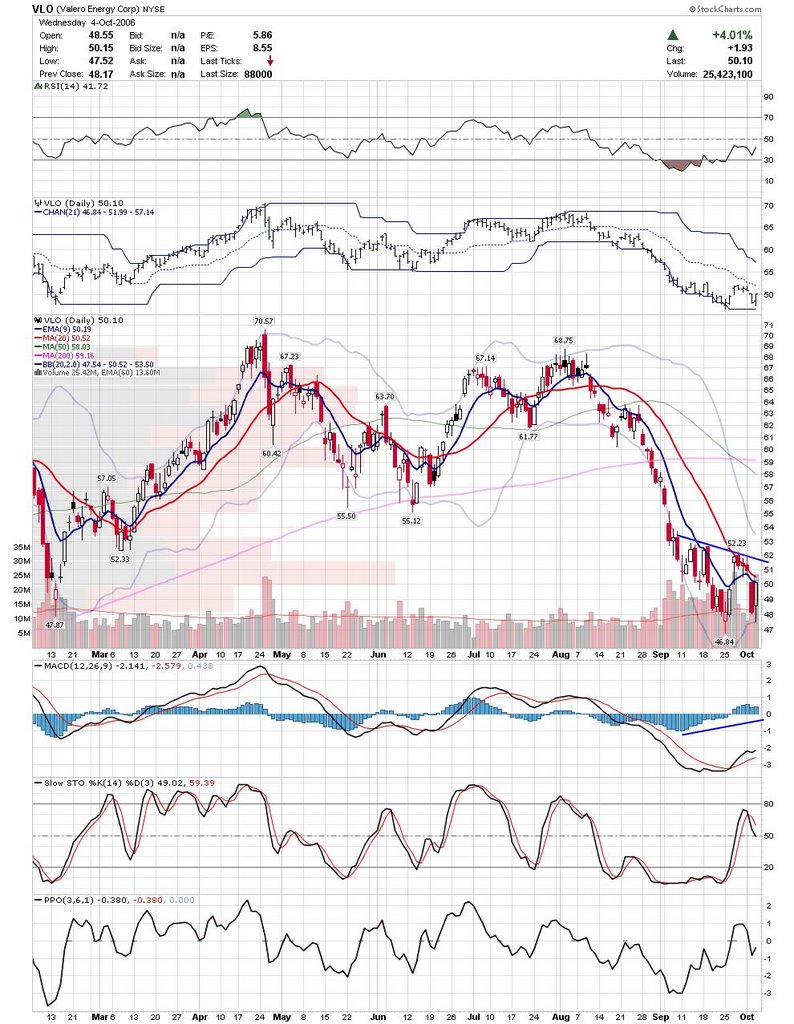
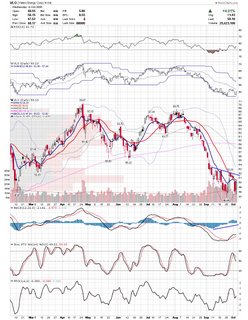
There couldn't be more bad news coming out on VLO and the stock refused to go down today. Todays move reversed all of yesterdays move and this may be a small reverse head and shoulders here. The blue line is the neckline.

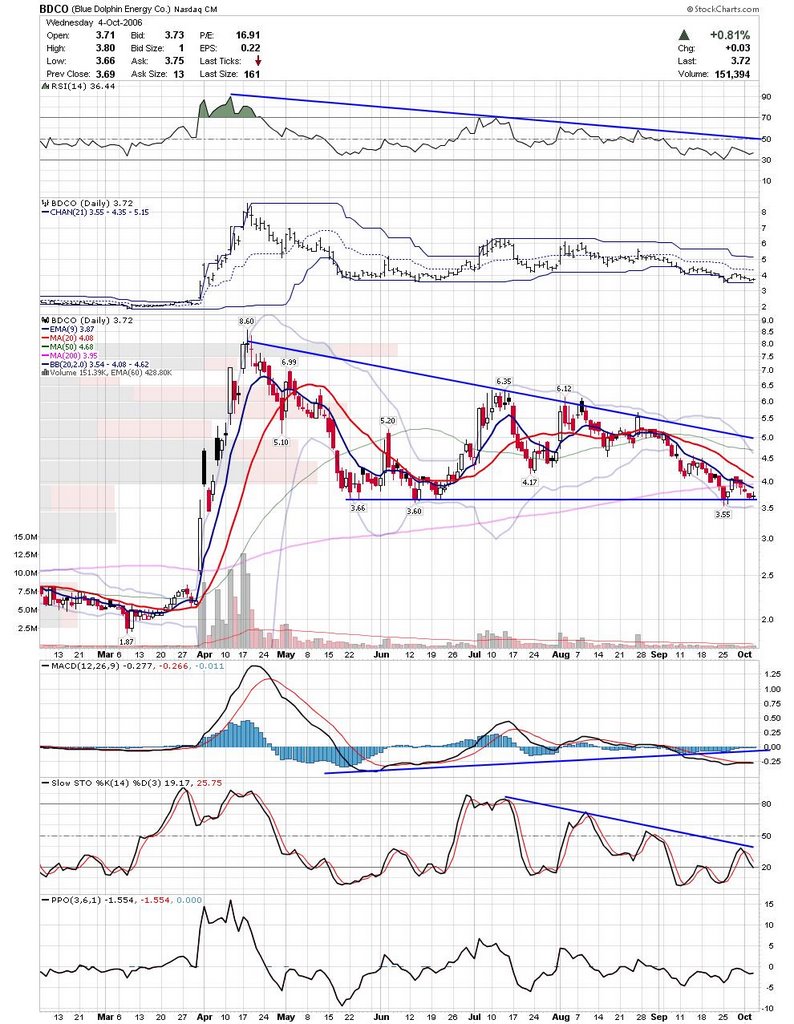
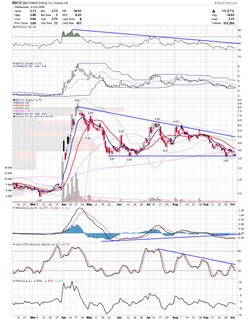
BDCO always seems to catch a bid when Oil rises. If oil the commodity makes a move then I think BDCO may take off. It is very close to support here.

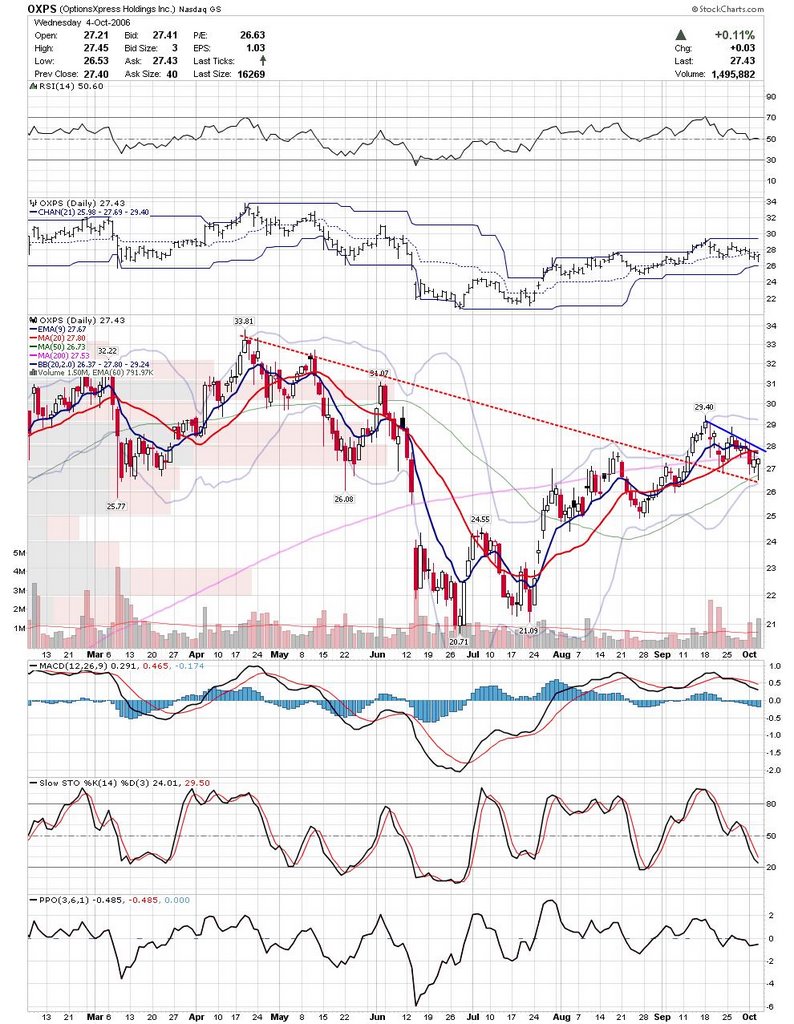
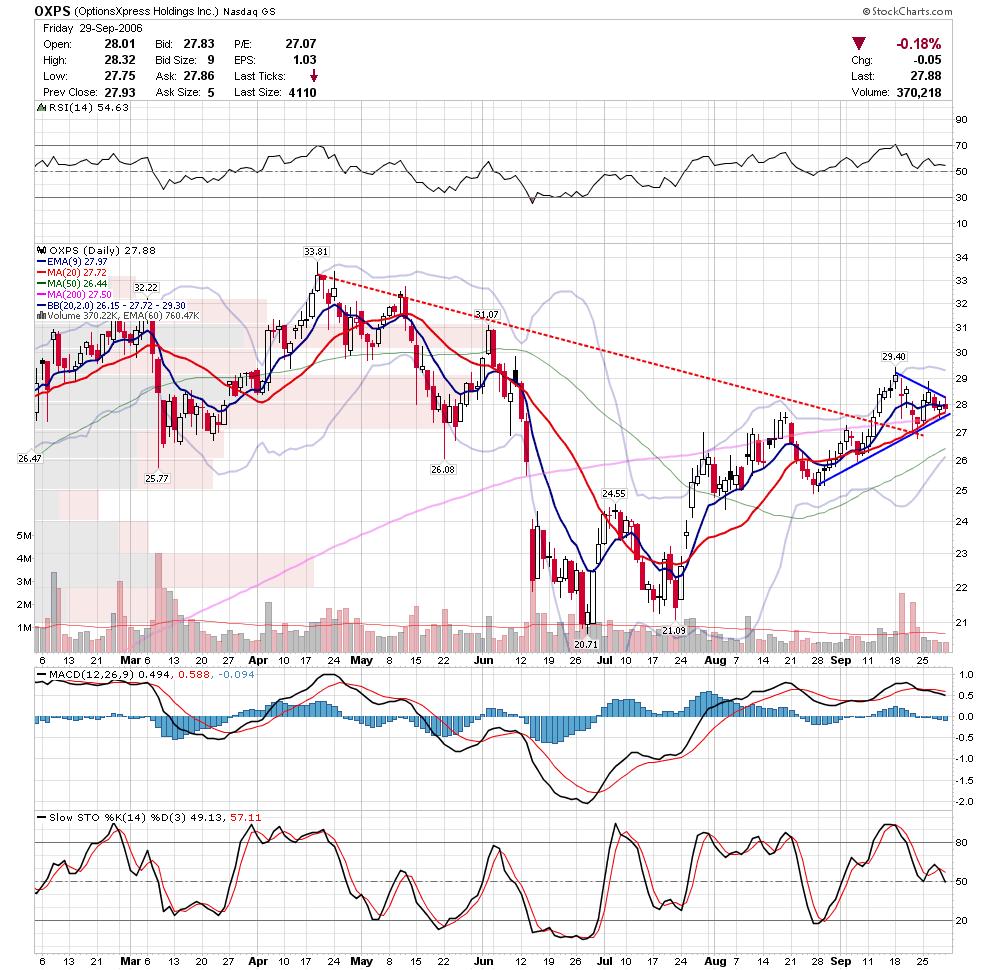
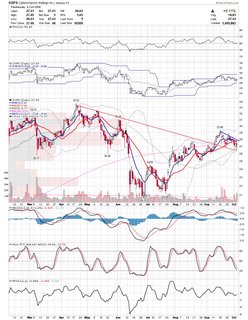
OXPS is trading a flag and formed a hammer on support.

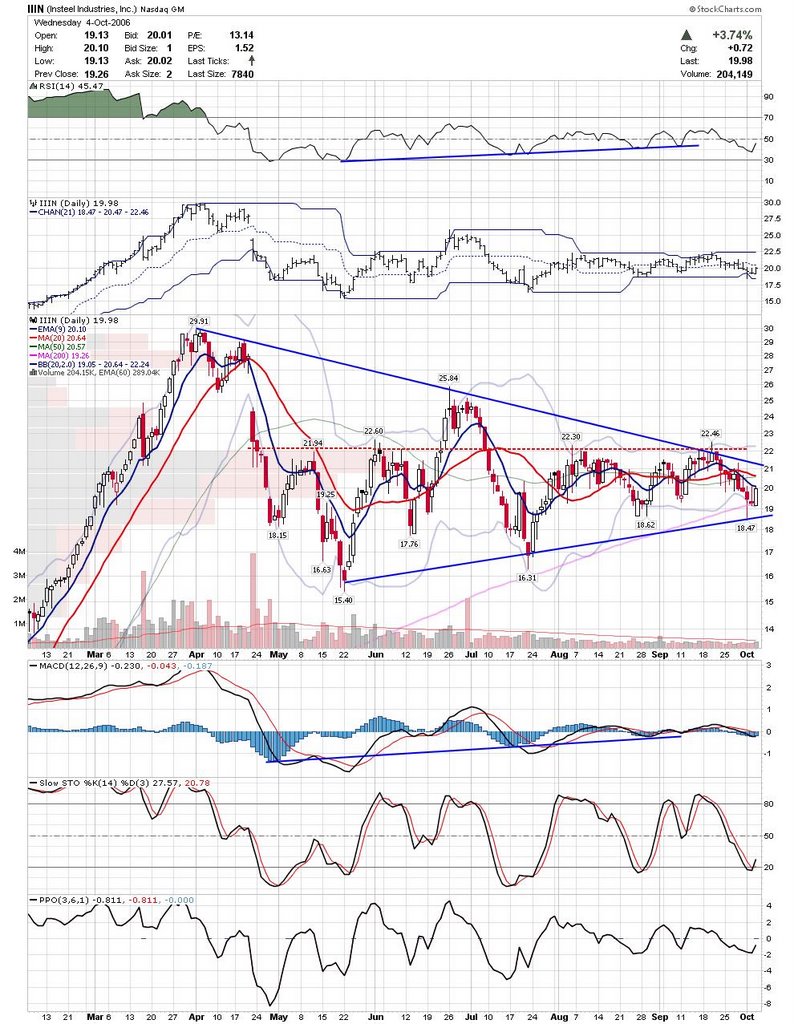
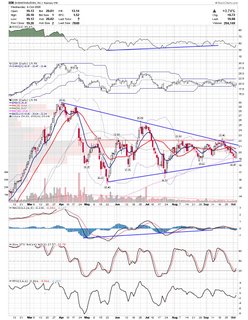
IIIN may be bouncing off the bottom of this huge triangle.
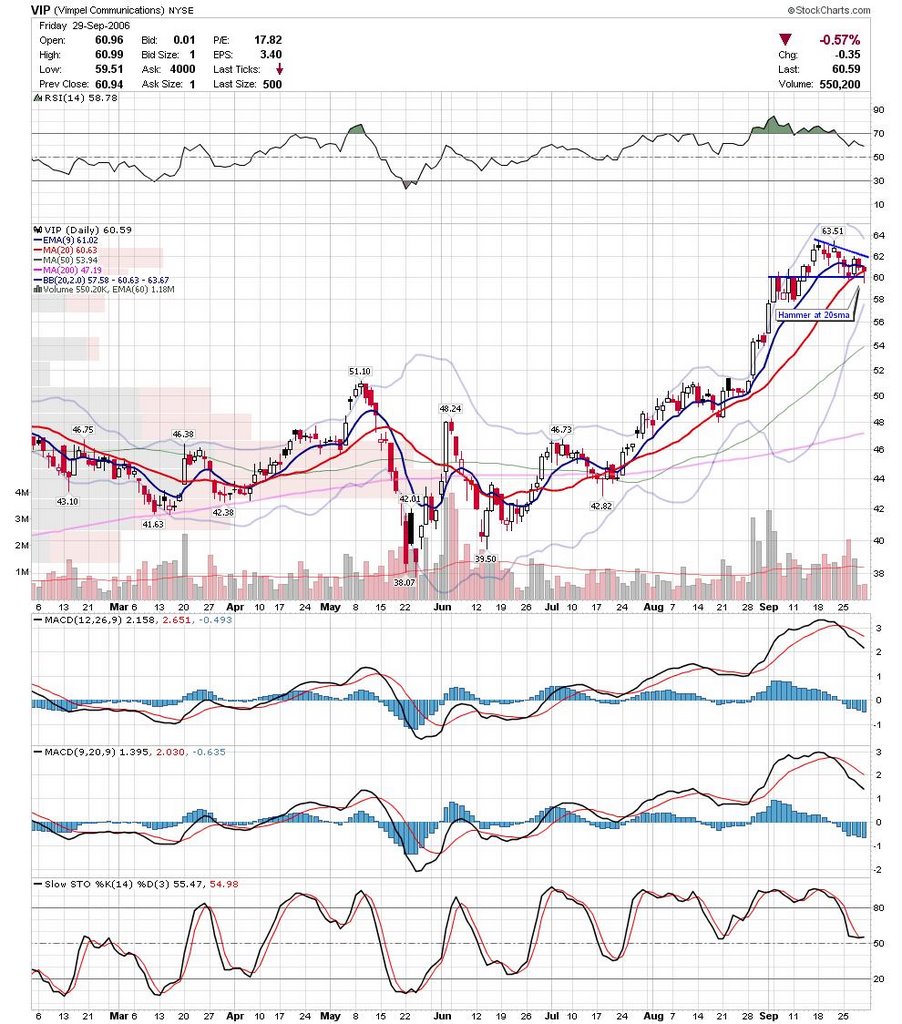
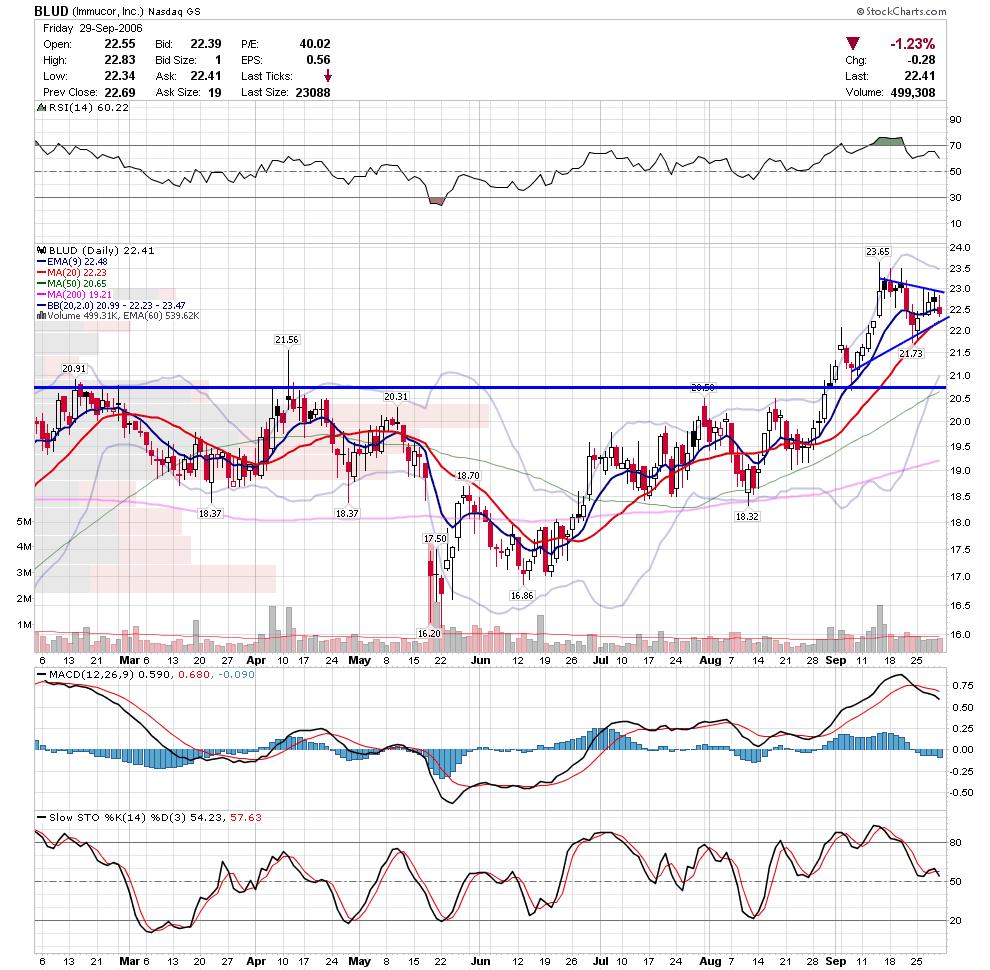
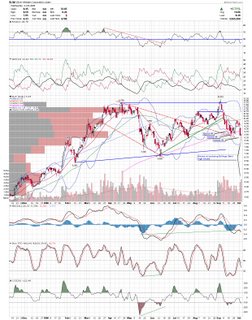
I've noticed an interesting phenomenom with how efficient the markets are at weeding out weak holders. The typical move after a hammer is to buy on the next high. But I've noticed that lately, a few bars later, there is a new lower low under the hammer. Then a few bars later, there is another hammer, but with volume. This is usually the hammer to trade off. Here are a couple of charts with examples.

SLW actually had three hammers on support and may be bottoming here at the lower bollinger band.


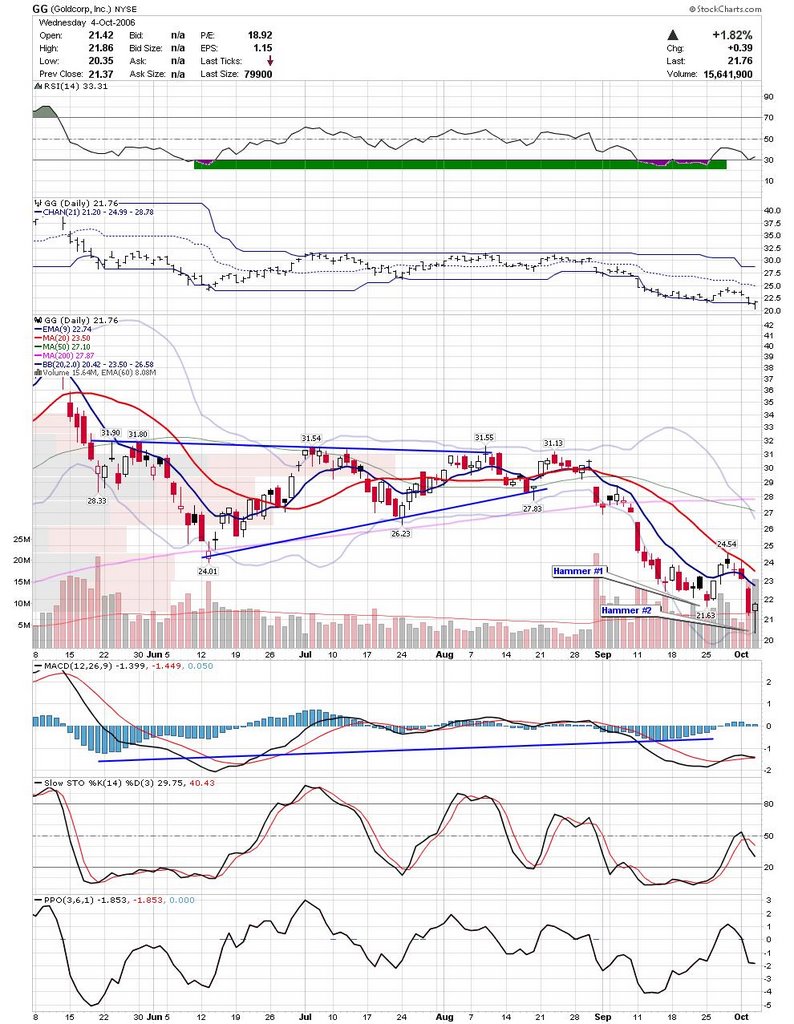
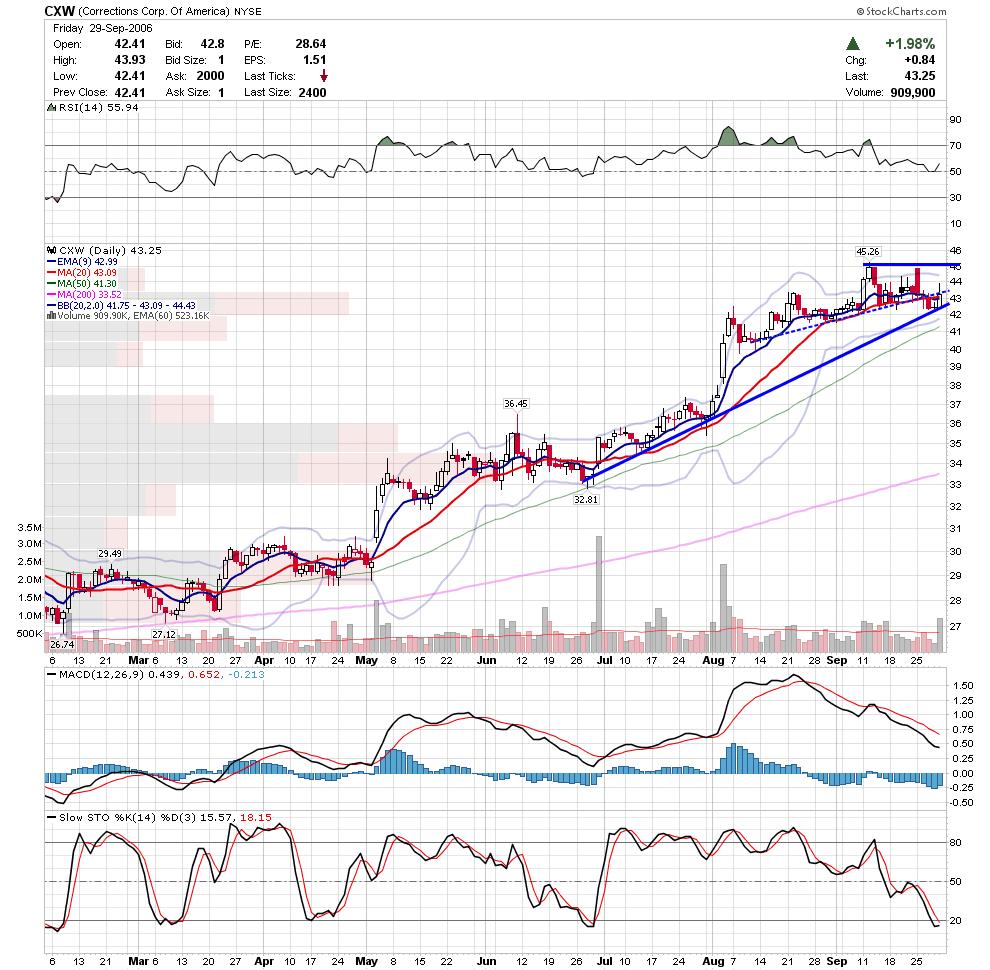
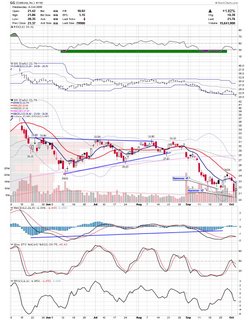
Here is GG. Although the first hammer is questionable, the connotations are similar. GG may also be forming a near term bottom here.

All of the commodity plays above are very risky in terms of failure rate, but the risk to reward ratio makes them viable to my tading style. Keep your own trading style and objectives in mind when considering these.

Good Luck,

DT

Dow all time high!

Posted by downtowntrader | 10/03/2006 09:37:00 PM | 0 comments »

You would of never known the Dow hit an all time high today by looking at the other indices today. The Russell actually finished red. The strength may spill over into the rest of the indices the next few days, but I am suspect until the Nasdaq resumes a leadership role.

Here is a 60 minute chart of the Q's . It bounced off the lower bollinger band, but stopped right at the mid band / 20sma. It needs to clear this flag for a shot at the upper band, but it looks like the band is starting to turn lower.

GME is one I've been watching for a couple of weeks now. It bounced off the trendline today near the 20sma and may have a shot at making a run over the handle pivot.
PNRA is trading a flag consolidation here after clearing a down trendline. Keep an eye on that flag.
RWC may be taking off here.
SHLD has been trading a tight flag which may also be classified as a handle for a 4 month cup and handle.
IHS touched the 20sma again and found support.


Good Luck,

DT

Small Caps Breaking down

Posted by downtowntrader | 10/02/2006 09:16:00 PM | 0 comments »

Small and Mid caps have continued to underperform even as the market rallies, so the question is, will they lead to the downside. While the recent pullback in the major indices has remained quite tame, the chart of the IWM (tracking ETF for the Russell) is showing a possible breakdown. It looks like a trip to 70 is almost guaranteed before any sort of consolidation happens.

Martin Pring highlighted KKD today on his monthly newsletter and this chart looks pretty bullish to me on an intermediate to long term basis. I would probably wait for a retest of the recent breakout, but it's worth adding to the watchlist already.
It's tough to try and pick tops but AMX looks like it may be topping here for the near and possibly intermediate term. Note the MACD divergence as it tries to make a new high. Also had a bearish engulfing candle today which usually signals a few bars of weakness.
WWY has been under distribution all year and may be on it's way to retesting the 52 week low.

MRVL announced that it would need to "restate" past earnings and guided lower for the 3rd quarter this evening and it was being punished after hours finishing down 18%. Other chip stocks were dropping with them, so tomorrow may see pressure on the semi's as a group. Keep an eye on how they close to see if bargain hunters come in, or if traders rush to lock in recent profits. That will give us a clue to the longevity of this rally.

Good Luck,

DT

Sunday night watch list

Posted by downtowntrader | 10/01/2006 10:13:00 PM | 0 comments »

The end of quarter effect usually lasts 2-3 days into the next month as funds invest monthly contributions, so it will be interesting to see what takes place the next few days. The daily charts are still overbought, but there are some interesting patterns developing on the hourly charts with the SPY looking pretty good to me, but Q's looking a littlw worse. Picking tops is difficult so I am sticking with long charts until we see some further breakdowns.

VIP may be finding support at the 20sma as the bollinger band tries to catch up.

SYKE tried to breakout friday and finished just under the trendline. MACD looks weak but if it can clear resistance on volume, then the indicators will take care of themselves.
OXPS is coiling tightly here as trendline converge.
NEU has been holding the 50sma as support and is testing the downsloping 20sma. Watch to see which way it breaks.
IHS has a nice narrow range candle that may offer a somewhat safe entry.
ICLR is starting to push the upper bollinger band as it breaks resistance.
DK has been trading a pretty volatile range and is up against a descending trendline.
Buying TAM at the 20sma has been working and has printed a nice narrow range candle on declining volume right smack dab on the 20. Keep an eye for the next higher high.
TRID is sitting on major support here with the 200sma meeting the ascending trendline.
BLUD is trading a nice Bull Pennant and may bounce off the 20sma.
CXW may be finding support at the ascending trendline but still has plenty of resistance to work it's way through.

A couple of links worth reading

Good Luck,

DT