Stock Chart Analysis ARGN
Amerigon Incorporated (Public, NASDAQ:ARGN)
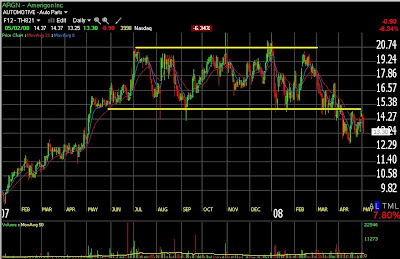
Often the best time to enter a trend is on the first retrace after the breakout or breakdown. In ARGN's case, it broke down from a lengthy base in early April, and then retraced to test out the break down area a few days ago. The test failed miserably and it looks like ARGN may follow through on another leg down. It's interesting to note that ARGN has been notably weak in a time where the majority of stocks have been moving higher. While I prefer to not jump in after a stock has dropped 6% in a day, it does look like the trend is resuming and I will look for any near term retraces as a possible shorting opportunity.
Good Trading,
Joey
for more analysis, check out downtowntrader.com
Subscribe to:
Post Comments (Atom)


Can you please revisit the chart as it looks like it's trying to break out of the downtrend.
I still don't like ARGN here. There is clear resistance near $15 and the recent move off the lows is leaving it overbought. I'm not saying it can't consolidate here for an attempt at breaking $15, but I would say the odds favor a retest of the recent lows.
Joey