Here are a couple of charts to look at. I am still on vacation, so I am not looking at entering anything new, however these are stocks I hold positions in.
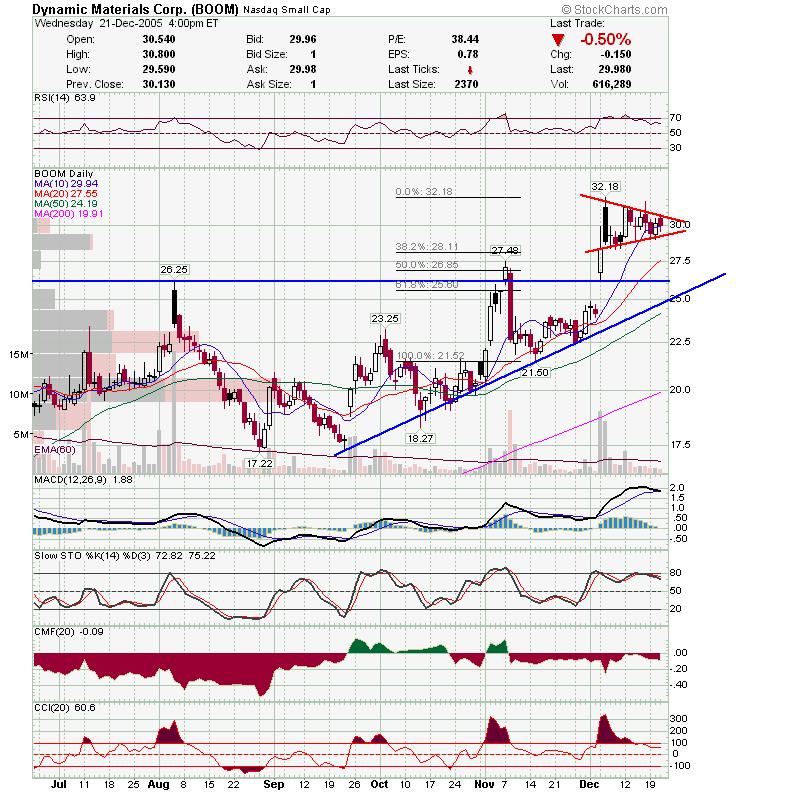
PETS: Pets debuted on the IBD 100 at #11 this weekend. BOOM is forming a nice pennant here.
 ANF closed above an ascending triangle which is bullish. However, I will be careful as there is resistance above.
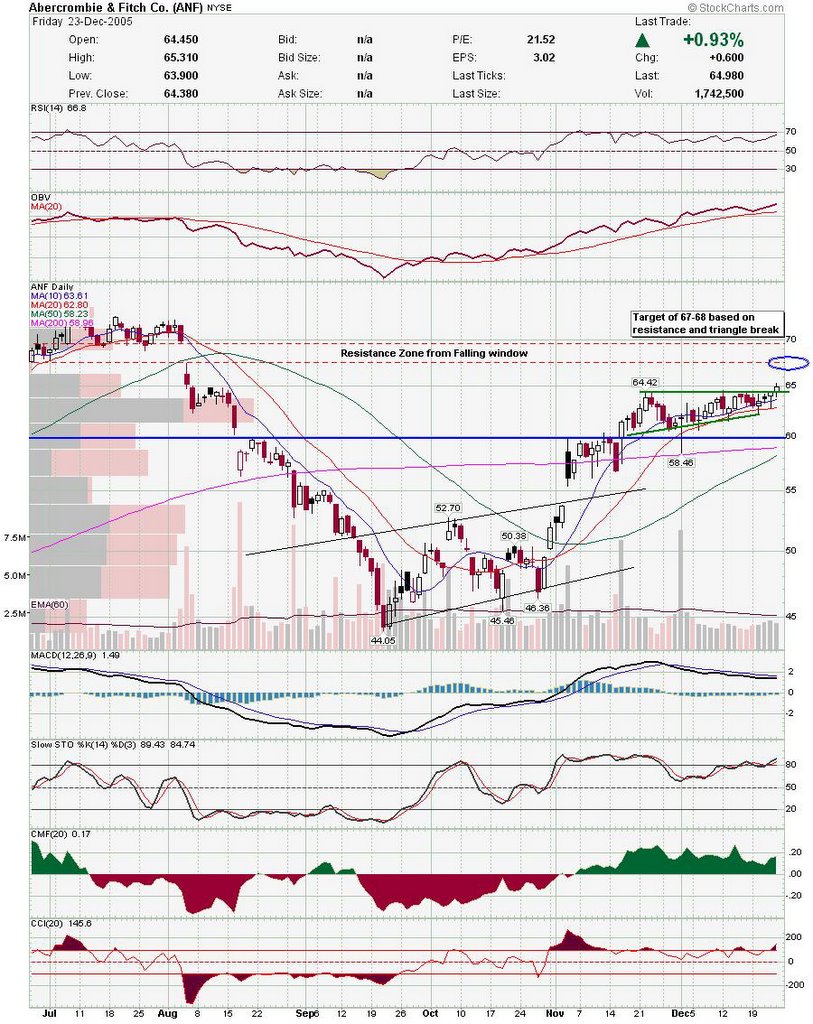 Good Luck,
DT
I will be on vacation tomorrow and most of next week, so I will not be posting much. There were some decent moves today but overall the market didn't seem as strong as you would think with the averages up. Here is an hourly chart of QDEL with fibonacci fans. Watch for a break of the 50% fib fan to go long.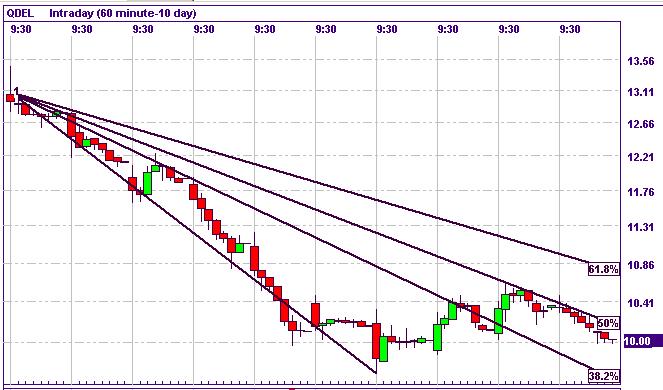
Good Luck and Happy Holidays,
DT
One of my favorite patterns in a market that has been consolidating is the triangle. It seems like there are a lot of triangles showing in charts so we may be getting ready to make a move here. If you see a bunch of triangles failing, in other words false breakouts, heed the warning and trim back on positions. That usually means the markets will turn sour and that is how it warns us. Failed breakouts are because too many people are anxious to lock in their profits. Here are a few triangles, some have already moved out of the base and others are still testing the trendline.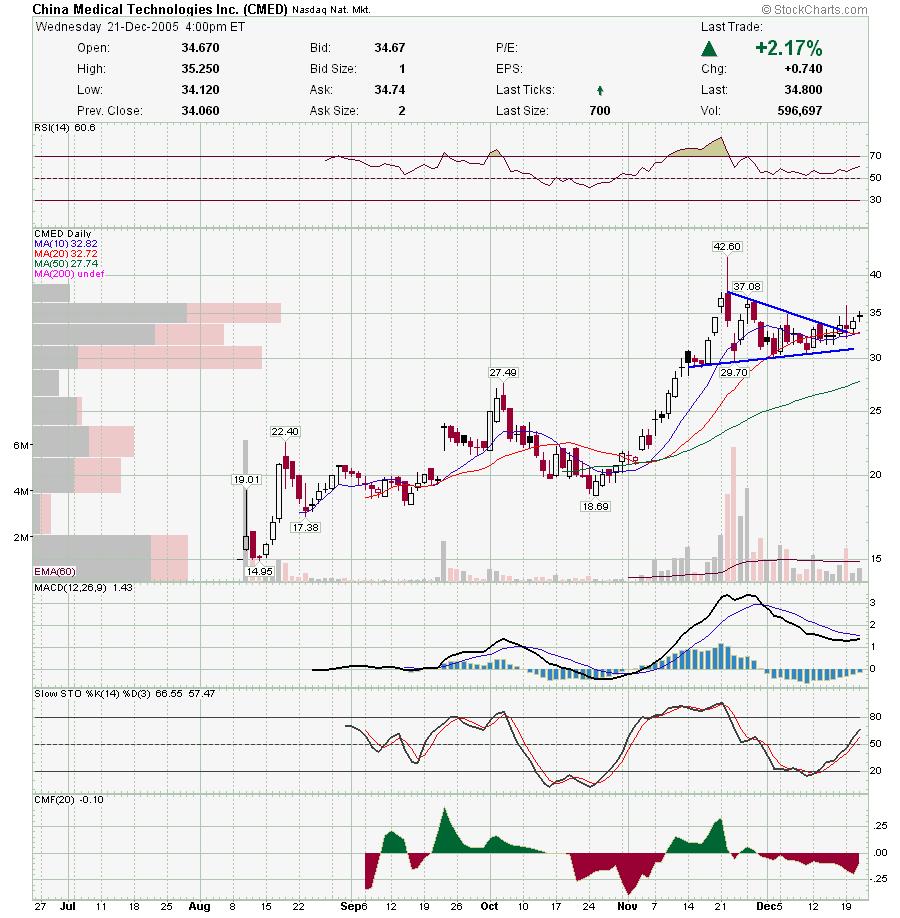


 Motorola is not in a triangle like base, but this may be classified as a pennant. Watch for a close out of the channel. Indicators are looking good as they were deeply oversold.
Good Luck
DT
Here are some interesting charts i'm watching.
PNRA may bounce off this trendline. 
The next two stocks are in deep corrections. Sometimes the last few days are panic induced so you may be able to get a bargain. The best thing is to not be greedy and try and get the exact bottom. Wait for it to settle down.
MCX selling may be getting out of hand here. I will watch this over the next few days, although I can't see many scenarios where I will buy this tomorrow. Maybe Thursday though. QDEL is an example of one that is playable. Made the hammer and then had a higher high today. There are still sellers which can be seen by the long upper shadow today.
NBIX:This has been consolidating and is forming a little triangle. There is a lot of resistance in the upper 63's so be careful. This may end up being a short if the next attack on 64 fails.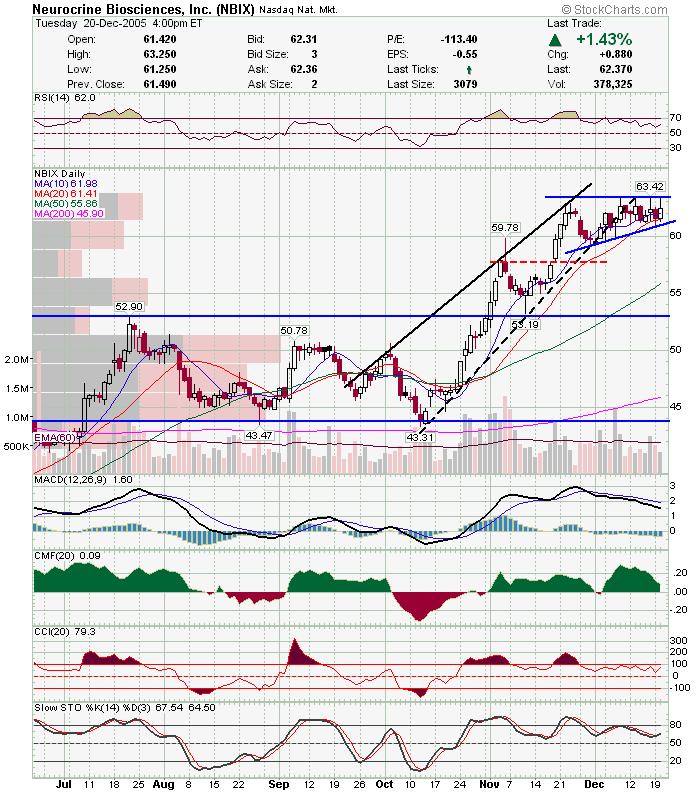 GILD: Another one that could go either way. Looks like it bounced off the trendline but there is still plenty of overhead resistance. Worth watching though.
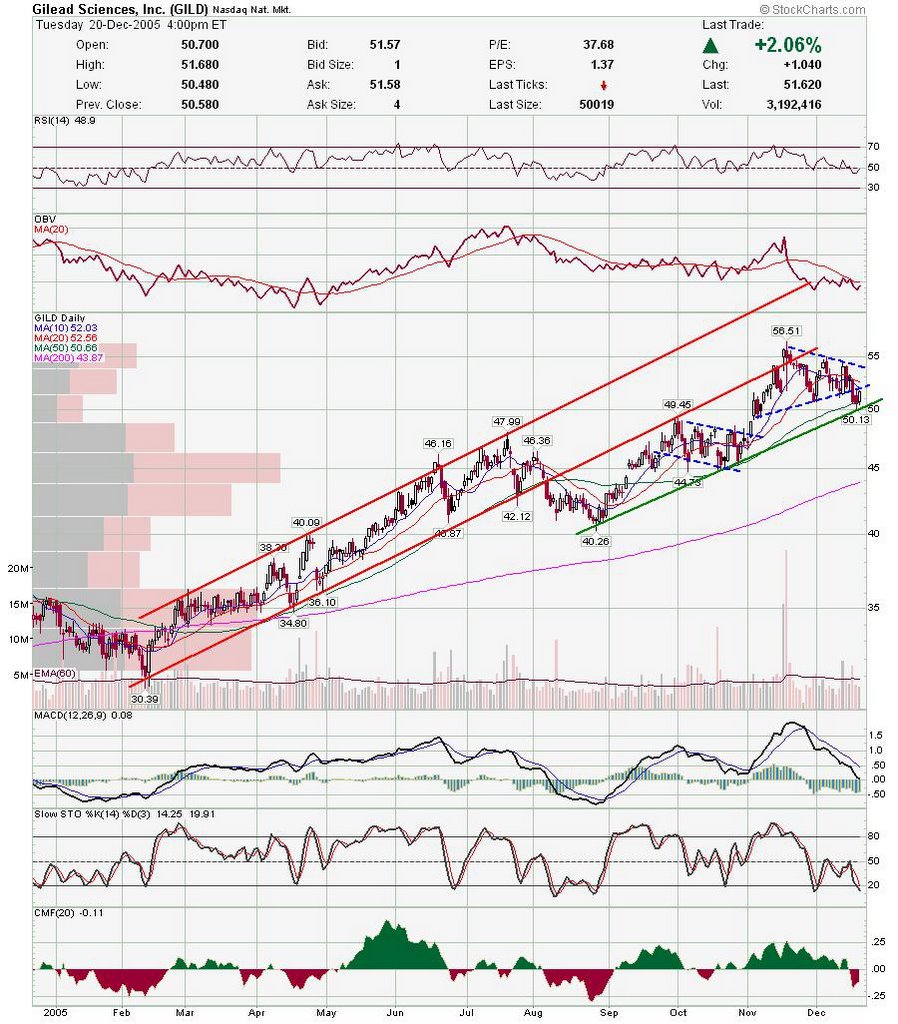 ANF could breakout soon. It is also forming a nice triangle and a larger cup and handle base.
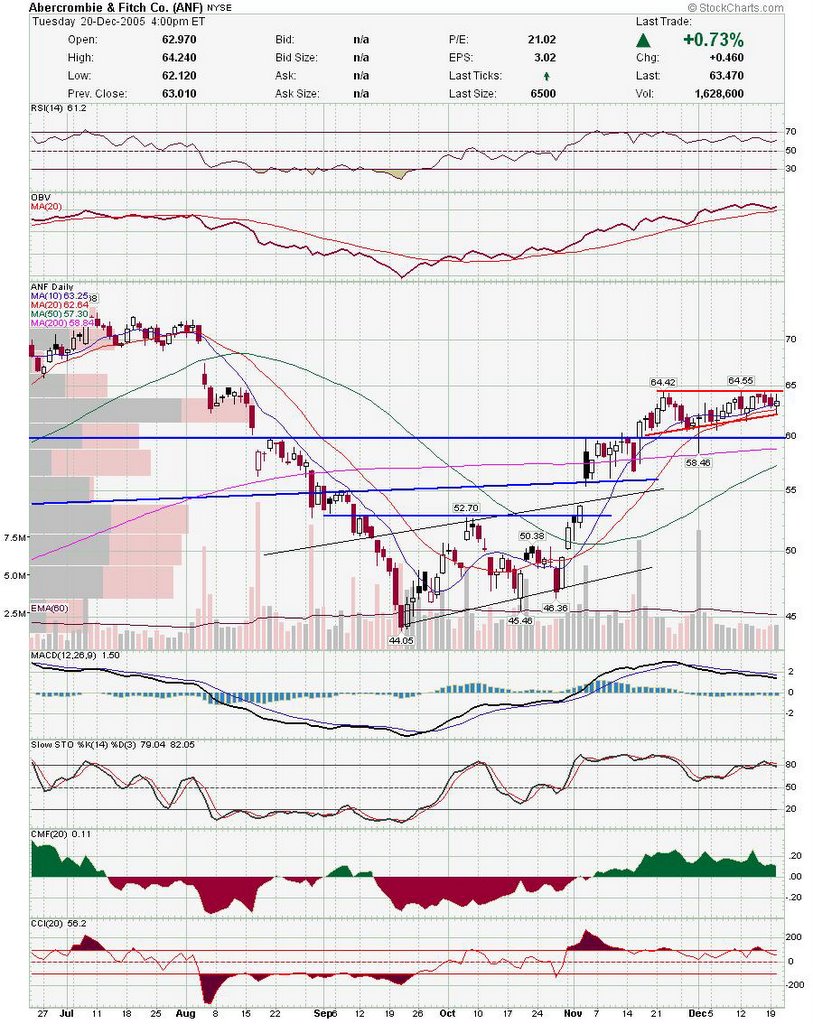
Good Luck,
DT
I think we will see a rebound in energy / oil service stocks here. Let's start with oih who had a bullish engulfing pattern after touching the trendline.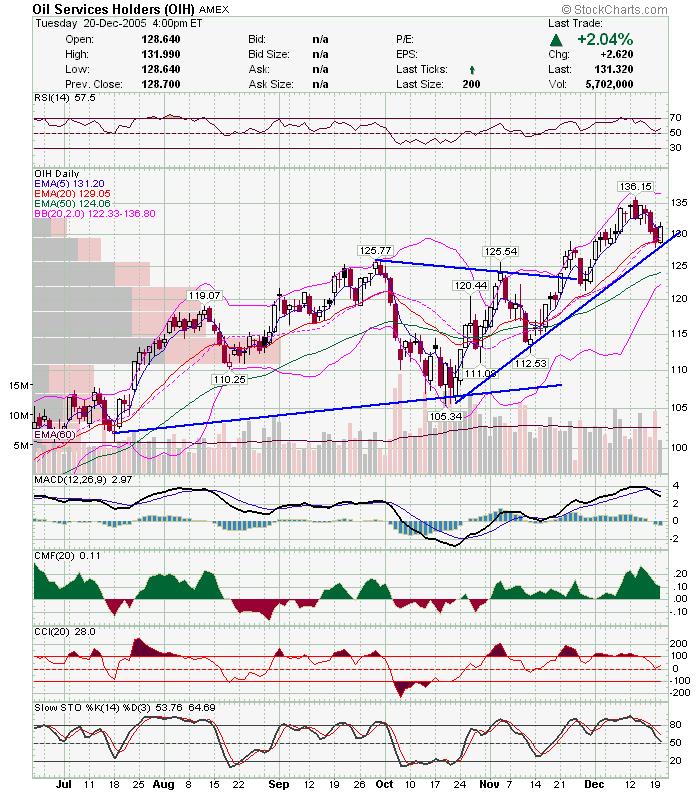 This is a former high flyer who has been consolidating. This is not a sure thing, but I will be watching it here as it is near support.
 This is a good looking chart. I like GRP and there is a logical stop area..
 INT also looks decent here. Right at support and with a sector that may turn up soon.
I've been early before, and may be early again, but I think these charts are worth watching the next few days.
DT
Lots of good shorts this morning, followed by some good longs in the afternoon. Hopefully some of you shorted IFO, NTAP and VPHM this morning for decent profits. I will post some charts later tonight.
DT
Is it time to short goog? I'm sure some piled on early today, but i would wait for a break of the trendline. Lots of negative divergences.
I was watching NTAP as a long recently, but it failed pretty badly at resistance, so it may follow through and come down to close window. Wacthing IFO for a break of the trendline. Look at declining RSI and CMF as price is rising.
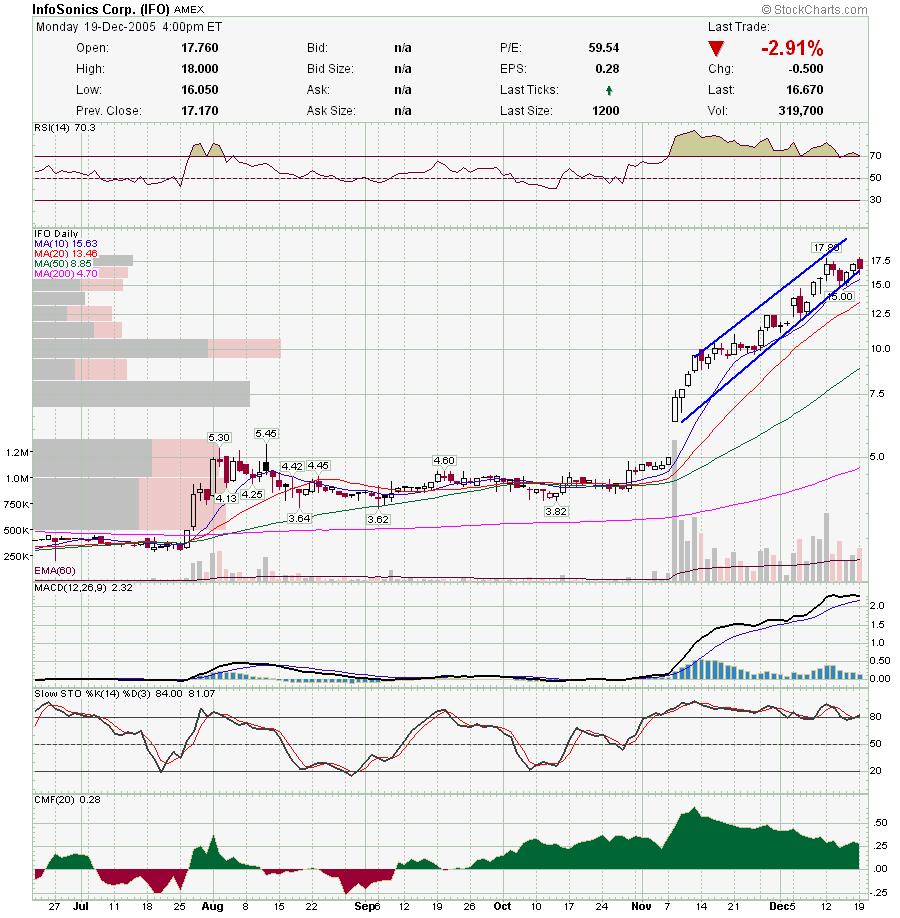 MNST is another long that failed, so it may be a short now. Has good support below but keep an eye on it.
Also still watching VPHM to the short side as well. There is still a chance that we still get a rally here as the market tends to take the side of the minority, but in the real near term, we probably still need to bloody the street a little more. Be careful as volatility will surely increase in the next few days.
Good Luck,
DT
I posted this on a private board i'm on, but i thought i would post it here since it is updating some of the stocks recently on my watchlist. Basically the question was how i feel on cmed, cmt, redf, and ndaq. The links are broken but you can just cut and paste it to you address bar.
not sure what to tell you as market action trumps everything. the
nasdaq and smallcaps got hammered today and this may be the start of a
downtrend. also, i'm not sure if you own any of them or if you are
looking to get in. also, i don't know what your trading style is short
term, intermediate, etc. i'll start by saying i own cmt, cmed, and
ndaq. i was looking for redf to pullback, but this was a little steep.
i don't think i will initiate many long positions until the markets
show some strength.
cmed: had a really good move this morning and it all fell apart. i'm a
little upset that i didn't take some off the table here cause it
dropped below my buy point for a little while. It dropped from over
35-32.12 in one hour. At least it closed over the trendline. I would
hold this depending on your shares until it breaks the lower
trendline. Also, if you can watch it, i recommend mental stops on
cmed. they are one of the more volatile stocks i've traded.
http://stockcharts.com/def/servlet/SC.web?c=cmed,uu[r,a]daclyyay[dc][pb10!b20!b50!b200!i!f][vc60][iut!ub14!la12,26,9!lh14,3!lc20][j64802581,y]&listNum=13
rdef: this has been a strong little stock, but it fell apart today. i
am waiting to see what happens here. it could bounce off the 20, but i
think the general markets would have to be strong for this to happen.
it may be headed back to the trendline and or 50 sma. if you own this
i would either lighten up and look to buy back at the 50 (depending on
confirmation), or hold as long as it maintains the trendline.
http://stockcharts.com/def/servlet/SC.web?c=REDF,uu[w,a]daclyyay[dc][pb10!b20!b50!b200!i!f][vc60][iut!ub14!la12,26,9!lc20!ld20!lh14,3][J59882709,Y]&listNum=4
ndaq: this was one of the stocks that held it's own when the markets
started tanking. it is still below resistance, so at this point i
don't know that i would be a buyer, but this was pretty oversold and
may still move a little higher. i am hoping for a decent pop to sell
half my position, and I plan to hold half a few more days to see what
develops.
http://stockcharts.com/def/servlet/SC.web?c=ndaq,uu[w,a]daclyyay[dc][pb10!b20!b50!b200!i!f][vc60][iut!ub14!la12,26,9!lh14,3!lc20!ld20!lv25][J64142740,Y]&pref=G
cmt: this is another stock that just didn't move when everything
around it was coming down. they also closed at high of day so that is
pretty decent. the negative is that they barely closed higher then the
close from 2 days ago, but i guess it wasn't a bad candle taking into
account the negative bias today.
http://stockcharts.com/def/servlet/SC.web?c=CMT,uu[w,a]daclyyay[dc][pb10!b20!b50!b200!i!f][vc60][iut!ub14!la12,26,9!lc20!ld20!lh14,3][J63629567,Y]&listNum=4
some others that held up today.
lmia, nwre, and ntri.
hope this helps.
good luck,
dt
Here are a few interesting charts.
LMIA: Doji at the 38.2% retrace and previous resistance. Wait for confirmation, but this has been a very strong stock.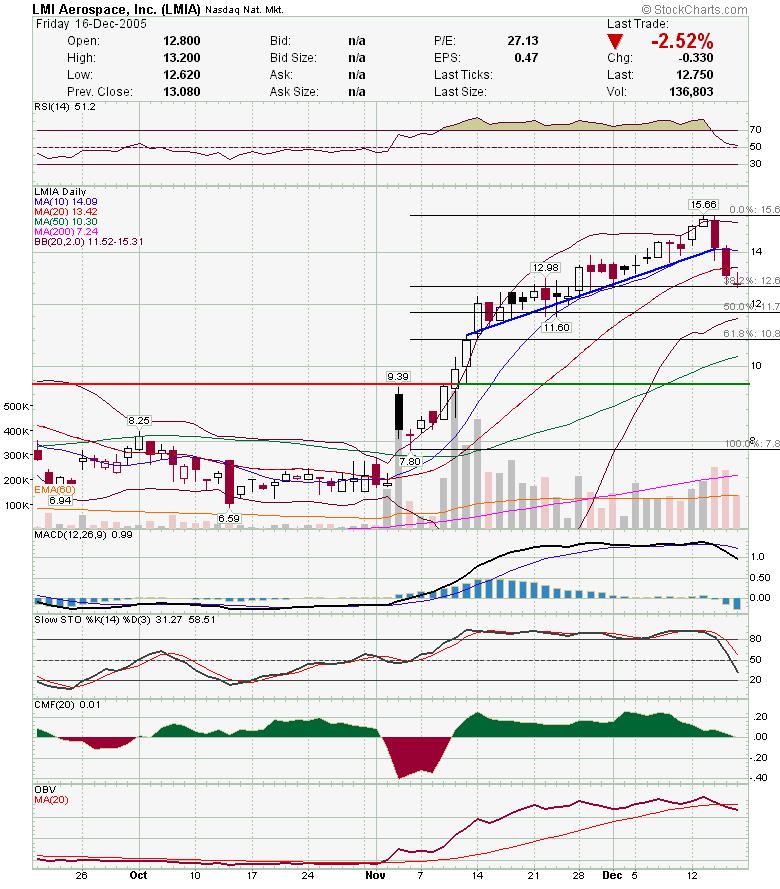 CTHR:Nice move Friday off the trendline. Nice support below.
 REDF: Careful with this one as it may be in b of an Elliot Wave abc correction. I would love for this to fall near the 20 sma, but will be watching for a breakout.
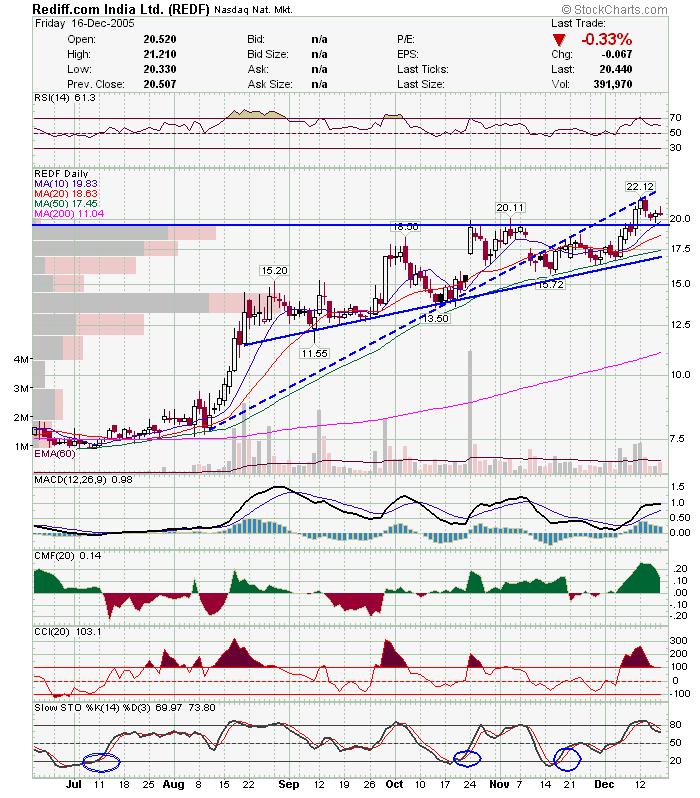 CMT: Read comments on chart.
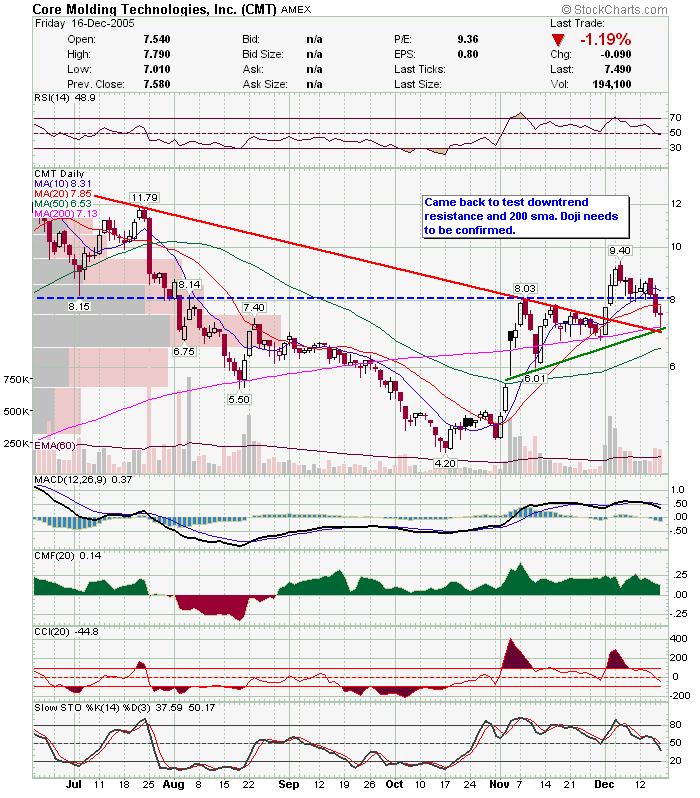
VPHM has been steadily climbing but has been quietly struggling with a trendline that was previous support. I am watching this for an attempt to close the window (gap) above. If it falters, may be a decent short. NDAQ: Read chart notes. This could make a decent daytrade as well as a swing, as volume is ok and there is a decent target near the red downtrend line.
 ANTP: Retested support and held. I will enter if it makes a higher high tomorrow.
 CMED: CMED looks like it broke the triangle Friday, but pulled back slowly on decreasing intraday volume. I am showing a fib fan of the most recent leg up. Cmed is currently on the 61.8% retrace and could follow this fan line up.
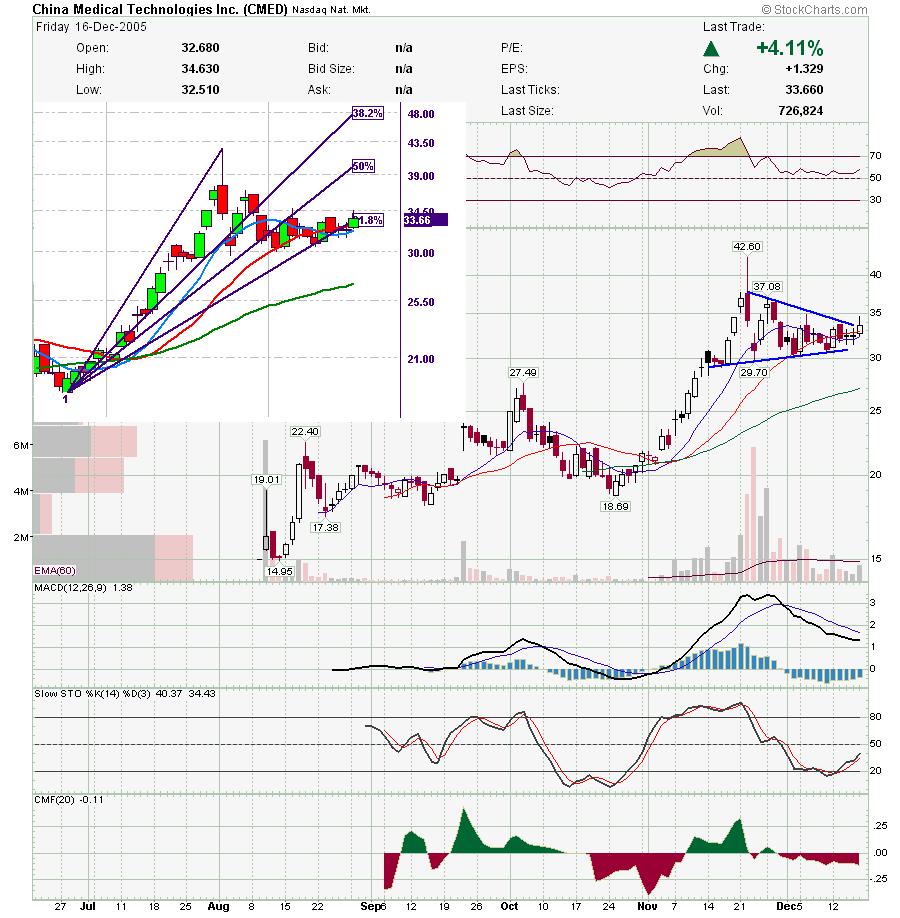 Also on my list
BCON: Very weird close friday with a huge buy at 4:00pm. (no options on them)
MNST: Looks like the may have succesfully tested support
SNTO
AOB
SVA
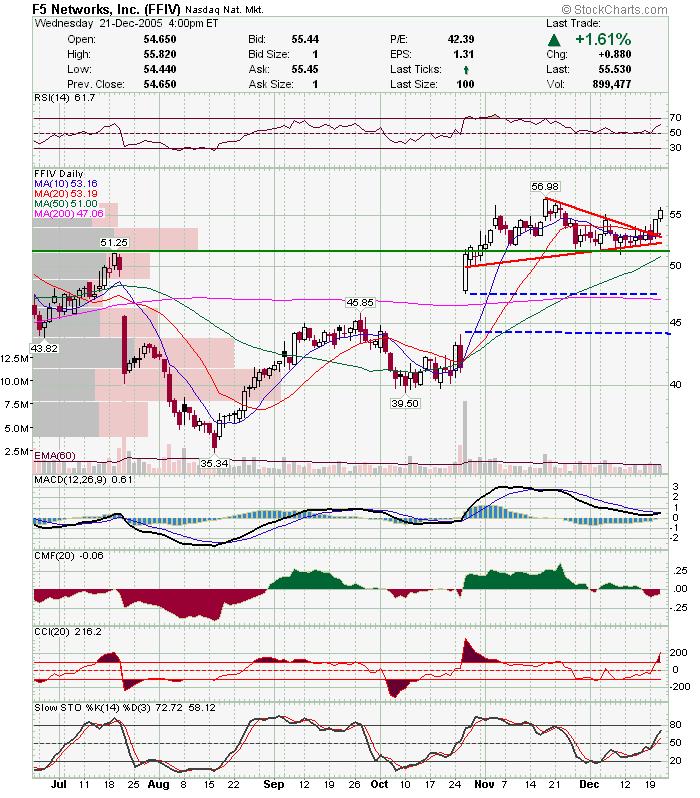
FFIV
MRVL
RNWK
QDEL: I think bottom is in. Should pop up a little and come back and retest.
Good Luck,
DT
Fibonacci Fans are one of the tools I use to try and find areas of support and resistance to either go long or take profits. I try to find areas where support or resistance would normally be found, as well as look for a convergence of signals from my indicators. Here is an example of a trade I took where almost everything lined up very nicely. HAL had closed while forming a double bottom. The next day it built the right side of a cup and handle (shown in yellow) on the intraday 5 minute chart. I started watching it as it was pulling back and forming the handle. Since the low and high were defined at that point, I drew a line connecting the two, and looked at the fibonacci fans it formed. If your platform doesn't support fibonacci tools, I recommend looking at medved quotetracker. It has a free version as well. It looked like HAL was respecting the fib fans on the pullbacks so I watched as it pulled back after lunch. Everything came together where I drew the red square. First HAL started finding support at the 200 period ema. Second, the Slow Stochastics crossed back into normal territory from oversold. There was an ADX crossover and HAL reclaimed the 20 period ema at the same time it was breaking the resistance line from the pullback (shown in orange). The fib fan confirmed everything as it was a 61.8% retrace. The fib fan also accurately showed resistance at the 50% and then the 38.2%. The other factor which is often overlooked is what time all this happened. I have much more faith in a breakout starting at 2:00pm then sometime between 11:30 and 1:00. One could of taken partial profits once HAL started to fight with the 50% retrace but it never seriously threatened the 20 period ema after it broke out. The trade was closed after it pulled over the 32.8% fan line and then formed an evening star like pattern. It was also near 4:00pm, so it was a convenient exit. I use fib. fans almost exclusively on intraday charts but once in a while check it on daily charts. Here is an example of the Nasdaq composite showing a fib. fan. There is some subjectivity as to where the high and low of the trend are, and I chose the first high here, before it started trading sideways. The composite has been trading sideways for about 17 days now and should start a move to either direction soon. The bollinger bands are tight and the 10 and 20 period sma's have converged with an ascending trendline. I am looking to the fib fans as potential support if it breaks down.
 Now an important observation I haev made, is that fib fans don't act as classic trendlines do. They are more like magnets and the stock tends to trade around them. So if it breaks one it will either trade a few days hugging the opposite side of the line, or it will fall back (or up) near the next line. I never rely on just fib fans, but they are useful if you are looking to confirm your own trendlines or indicator analysis. Good Luck out there,
DT.
I will post an update on what I'm watching later tonight.
Sorry for the lack of an update last night.. I'm having DSL problems. Check out CMED from my earlier post this week, as I think they are poised to break out of the triangle today. Also, NDAQ may be ready to move from the recent touch of the 50 day sma, NILE broke out, and QDEL looks like it is bottoming out.
Good Luck,
DT
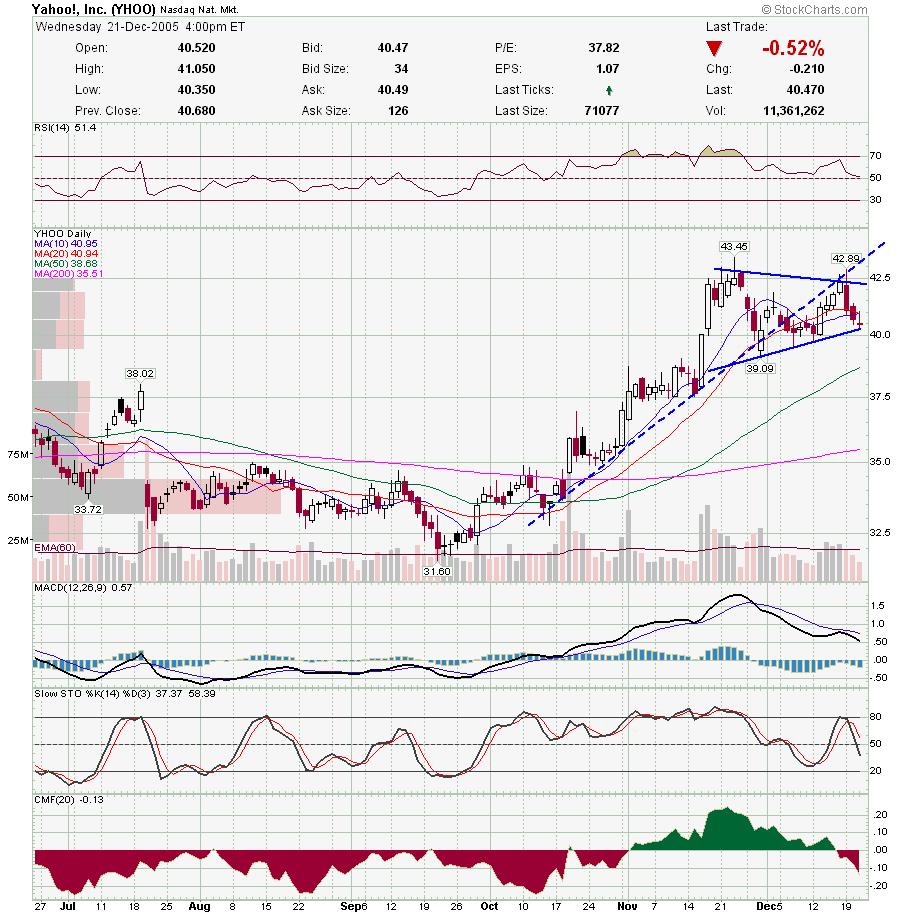
I had a few good ones on my list from last night including ENG, CKCM and YHOO. Too bad RHAT was upgraded overnight as I didn't get a chance to enter. Here are a few on my list for tomorrow. Other's on my list not listed below include DLB, PWR, SNTO, VLO, ANF, and NTAP.
CMED: This is probably tops on my list.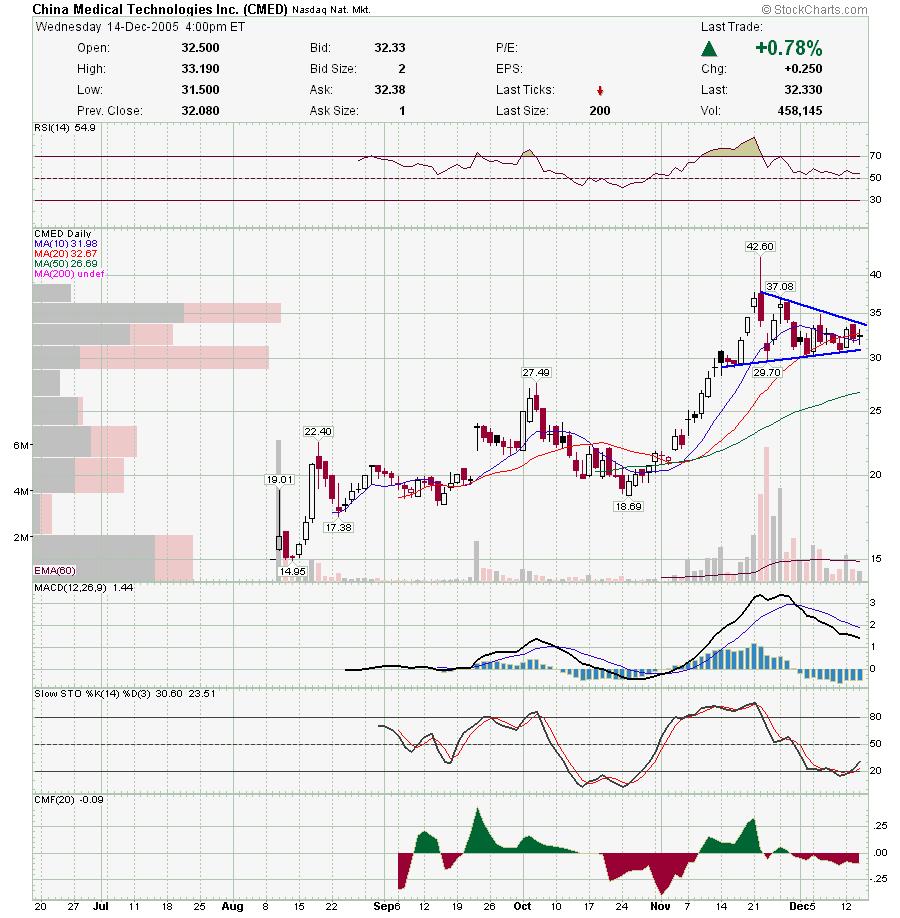 IFO: May hold the trendline.
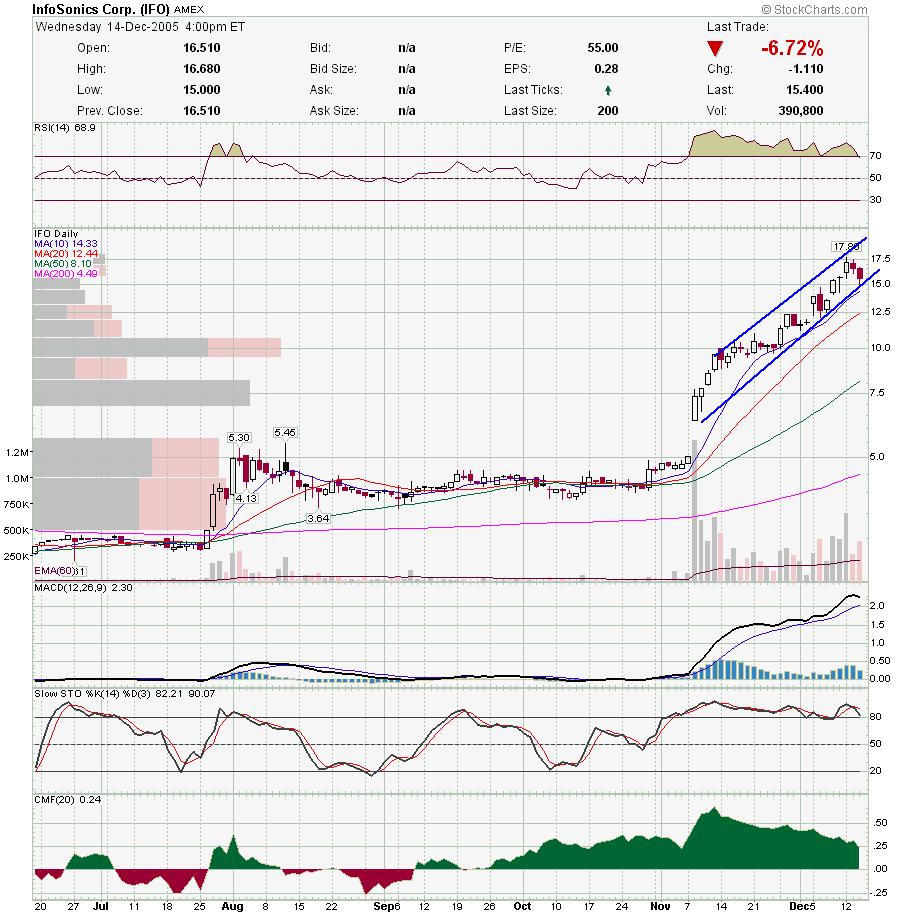 TRAD: looking for a bounce off the trendline here.
 NILE: Finding support on the blue line. Should try and close the window in between the dotted blue lines.
 NDAQ: May of sold off too hard, and may be ripe for a bounce off the 50.
These are on my watchlist today, although I probably won't trade much today if the markets don't pick a direction.
boom
swings
rhat
ffiv
eng
ckcm
slw
dna
gild
nbix
sva
cmt
haup
snto
daytrades
amzn
yhoo
grmn
sbux
pnra
vphm
This is a tricky week to trade as there is a Fed statement tomorrow, options expiration later this week, and this is probably the last week of healthy volume this year (due to year end vacations). That being said here are a few charts that are interesting.
BCON: This is what I posted in early November. "I may be a little early here, but I believe the "Smart money" has begun to accumulate here. Look at volume the past few days quietly coming in. I picked up a few shares, and will add as it pulls back. I will sell if it breaks down below 1.60-1.65 ish, but my guess is that it won't get there. I bet that there will be an announcement or some sort of news that will propel this higher once the smart money finishes what they are doing. Just me speculating, but this one has some good backing." Spiked pretty good today, then pulled back. I don't think it's too late to join the party here but it needs to close over the 50sma soon.
SNDK:Watch the downtrend line carefully here if you are long.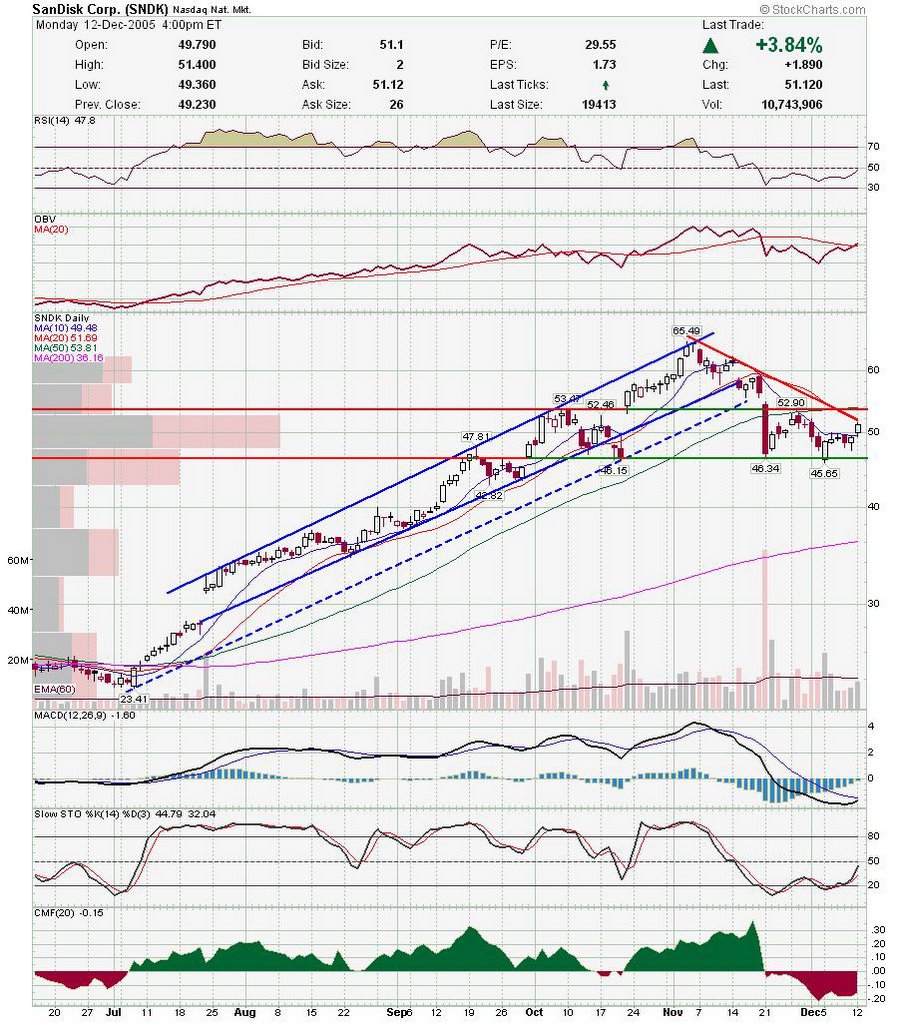 BOOM: Nice move today after a few days of sideways action. Although that black candle looked pretty nasty, BOOM never penetrated the body of the white candle that started this move. This is also the first candle to close at HOD on this six month chart, at an all time closing high by the way. Sounds pretty bullish to me.
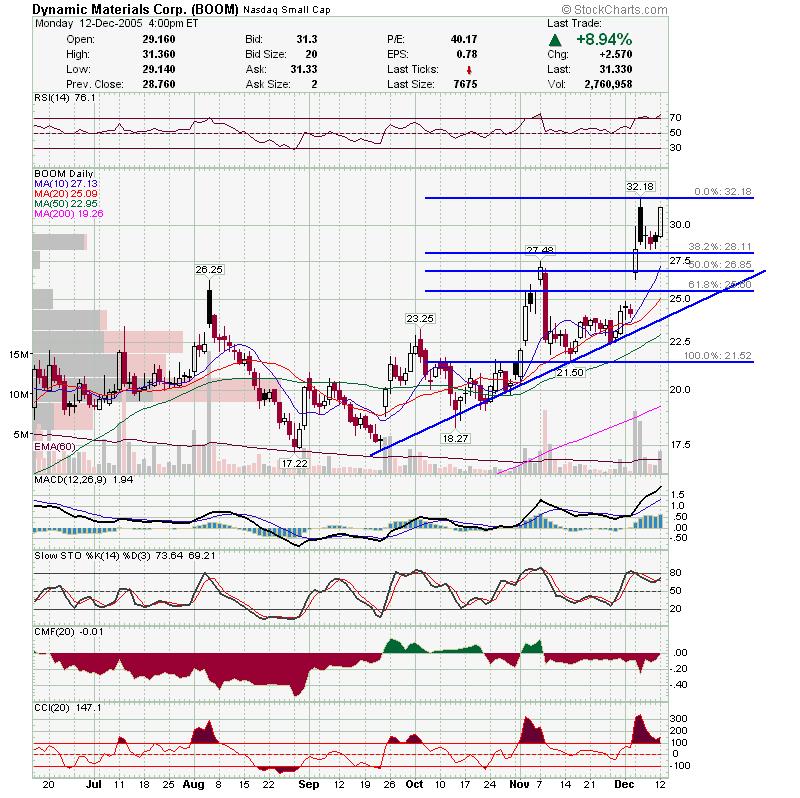
ANTP: I've been waiting for this break for some time. I will probably enter this tomorrow as a swing as I don't expect ANTP to swim with the markets per se. NVDA:I've been watching chip stocks and NVDA looks like it will try and fill the downside gap. Hopefully some of you took advantage of my post thursday night on chips reversing the opening weakness to close strong on friday. I went long on nvda and mrvl, and both are up a little. Hopefully the fed doesn't screw anything up tomorrow.
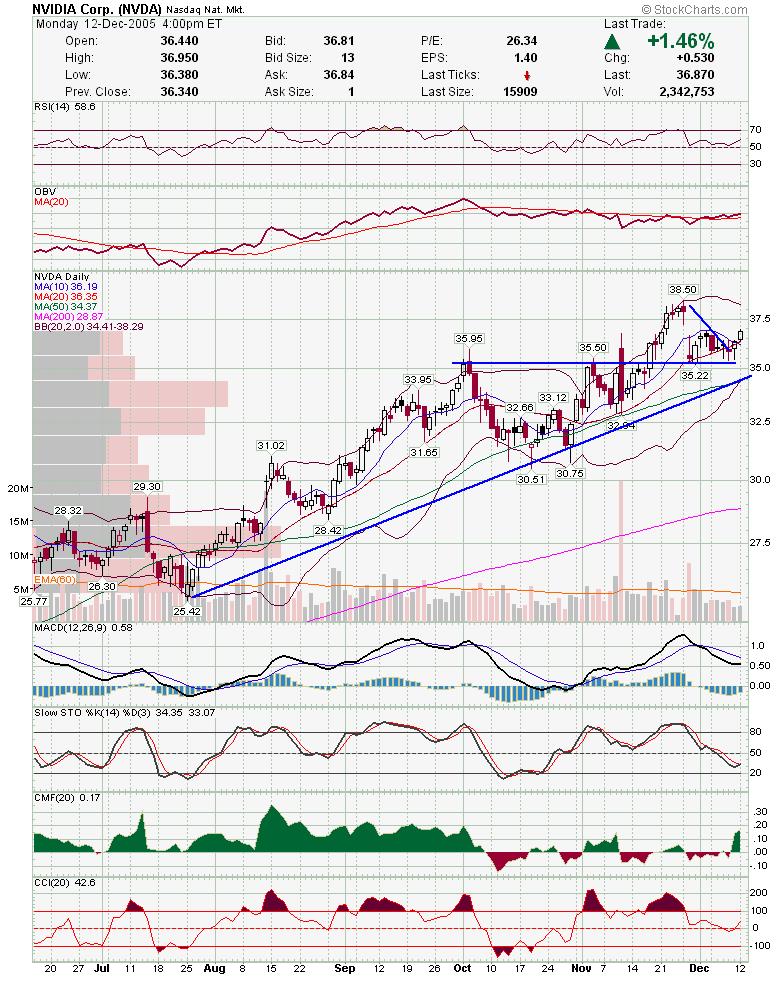 MNST: This is one of my favorite plays. I scan for stocks in an uptrend and try to find stocks pulling back to support. I wait for a hammer, doji, bullish engulfing, etc at support. Then if next day is higher high, I enter, and set stop below the hammer, doji, candle. The trick is where to take profits.
We are in a state of indecision right now. It seems like big players want it to go up, as they try and lock in profits at the same time. How else can you explain target increases all over the place and then the stocks start spinning their wheels (ie, aapl and goog)? Last two days have had attempted rallies at the end of the day, so we may not be in for a correction just yet. If you are shorting these markets lock in at least partial profits sooner then normal, as bulls haven't thrown in the towel just yet, and that leads to a choppy environment.
Here is a quick chart on PWR. With the markets pulling back the past few days, I am looking for stocks that are close to support and where sellers may be done. PWR has a few support areas here, so I will keep an eye on it.
Others that turned up on my list:
mrvl: keep an eye on semi's tomorrow afternoon. They will open weak on intc guidance, but may turn around later.
osur
hal: see previous post.
int: see previous post
rbak
mnst
smtc
vclk
intu
rmbs
sbac
Good Luck,
DT
Sorry for the lack of updates. Blogspot was down a couple nights ago and I was out last night. I'm working through a new system for my nightly scans so the updates will be a little lean until I work out the kinks in my new system.
We will start off with a chart of boom that most probably don't look at. The daily looks pretty messy, specially with the last two volatile days, but take a look at the weekly on boom. It sure is a pretty chart. Notice that boom has held above the triangle breakout.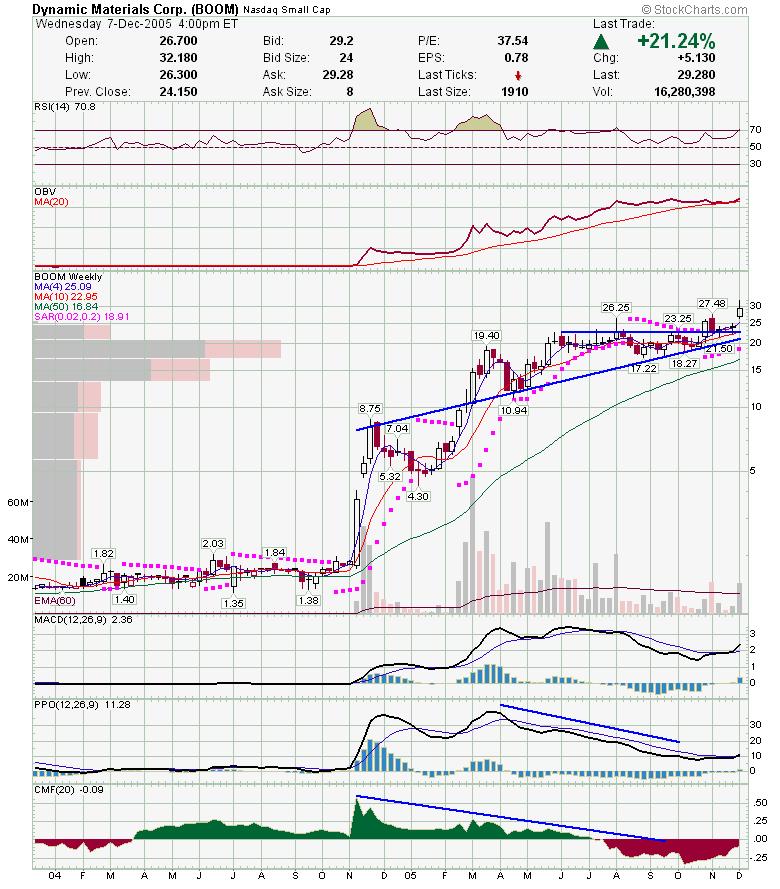 Next up is BCON. If you're a regular reader, then you know I've been looking for BCON to bottom out around here. Volume is ticking up again and it just needs a little kick in the pants to get over the 50sma. Formed a doji today which could be a warning, but keep in mind that we are bottom fishing here, and patience is required. It won't run to 5 in one day.
 I happened to pull up the SIRI chart last night, and noticed an almost perfect inverse head and shoulders. Check it out in light blue. I want to buy near the lower trendline, but may not get the chance. With XMAS around the corner and Stern right after, there may enough catalyst to kick start SIRI soon.
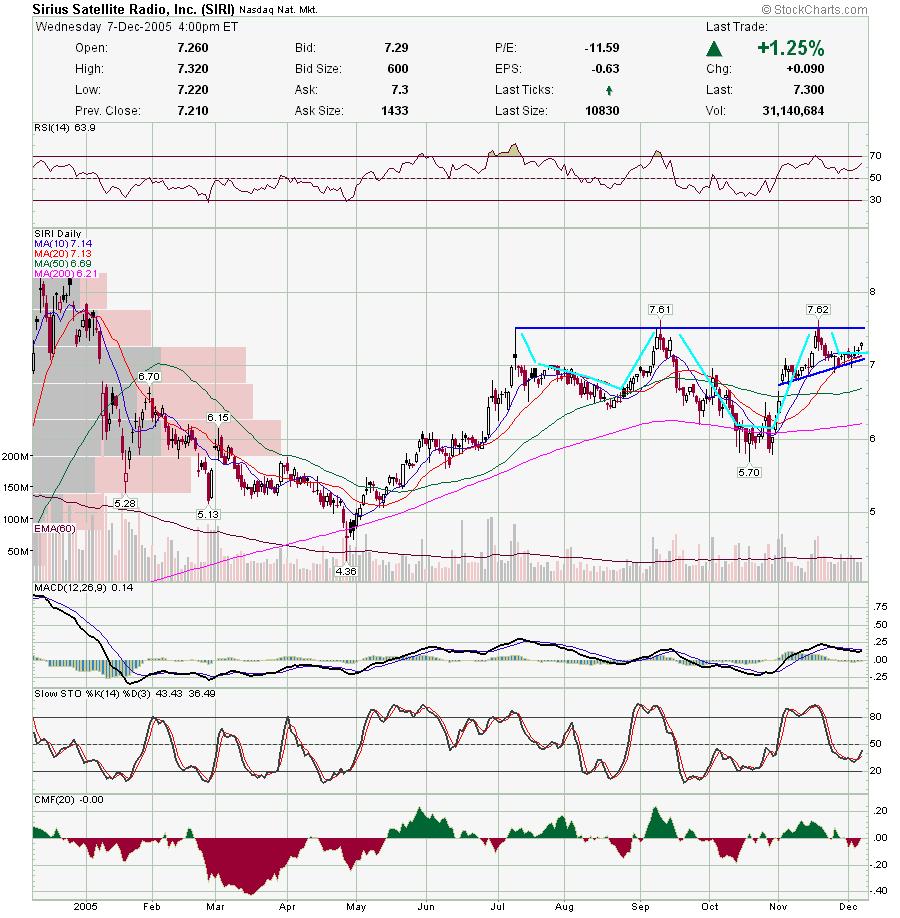
Subscribe to:
Posts (Atom)


