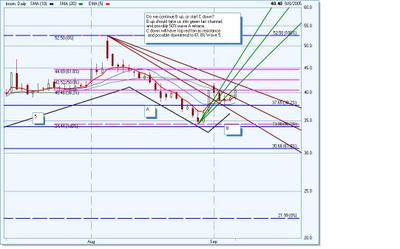
OK, I know this chart is messy, but all the lines are important. The pink lines are the fib retrace of Wave A down. The Blue lines are the Fib retrace of Wave 5 up. Red Fans are for Wave A down, and Green Fans are Wave B up. Black lines are to outline waves. If Boom makes a higher high tomorrow, then we can be in 3 of B and still see the 50% or 61.8% pink retrace lines of Wave A. If Boom makes a lower low, then I think Wave C may have started and Boom could see the blue 50% or 61.8% retrace of Wave 5. Just my 2 cents.
Subscribe to:
Post Comments (Atom)


0 comments
Post a Comment