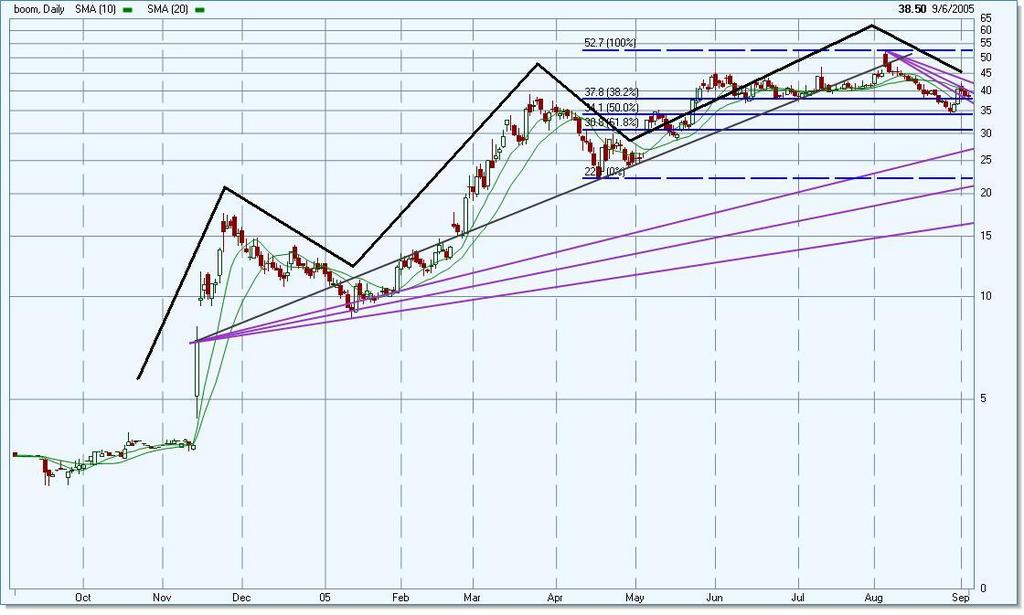
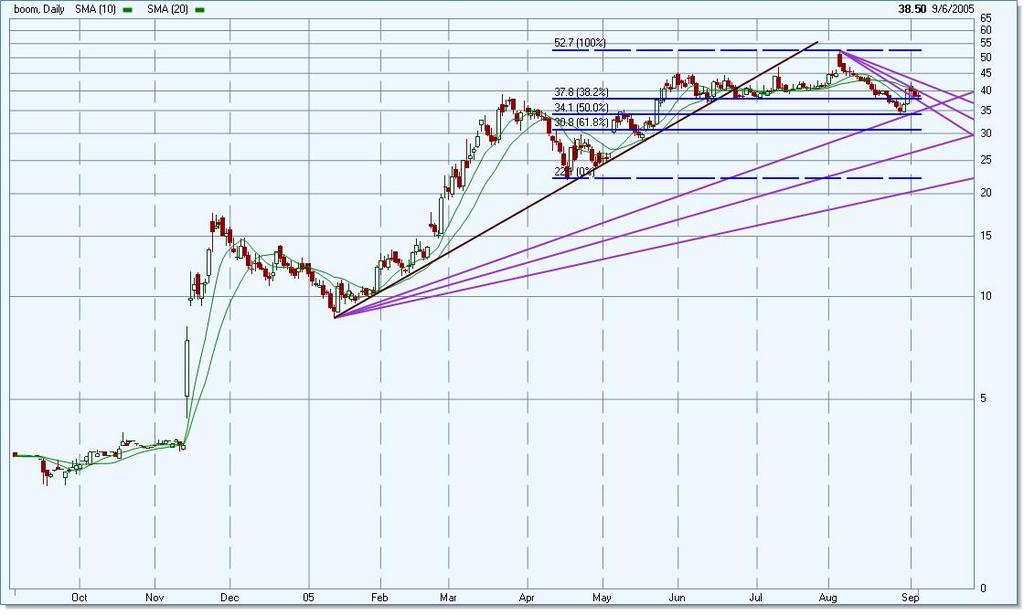
I drew a chart with an internal trendline boom has been using long term. It has acted as support and resistance at different times in BOOM's life ultimately reclaimed and broken on the most recent earnings day. Typically stocks end up coming back to an internal trendline. I tried a fib fan of the trendline to see if it lined up. I'm not sure if this type of fan retrace is common, but it has held up for me before on intraday charts. If so, the 38.2% retrace of the trendline will take it to approximately 29-31. I have drawn what i think may be the current wave count, which was 5 up with a 5th extension and we are now in either A down or B up. My wave knowledge is very basic, so my count may be off. More recently, BOOM looks like it held the 50% retrace of my wave 5, and is currently testing the 38.2% as support. I am neither bullish or bearish BOOM, as I don't have any position in it yet. If indeed we are in B up, then I may swing it, if not, then I will just stand aside. I also posted an option 2 scenario, using a different trendline. This is a newer trendline, and therefore may be more valid, but it wasn't in play for last earnings date. Option 2 certainly paints a nicer retrace picture, but still could end up near 30. Ultimately chart reading is an art, not a science, and I could be way off but I think this is a very interesting scenario.
Please do your own DD. Good Luck.
DT
Subscribe to:
Post Comments (Atom)


Asian Wireless Market Booms
Asia leads other parts of the world in wireless adoption, and growth will continue.
Nichesite College BoardtrainingNichesite College Board and training items
I like your news clips. Visit anytime, And Im always looking for new reads.
loan