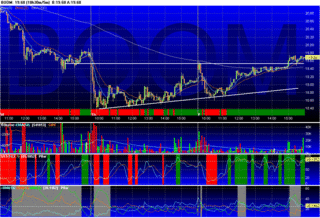
Boom's last two daily candles have had long lower shadows, and the intraday chart shows a possible reversal. This is a 5 minute chart showing consistently higher lows and boom never closed a 5 minute bar below the 20 period ema after 11:15am on Friday. Volume has been very light though.
DT
Subscribe to:
Post Comments (Atom)


0 comments
Post a Comment