Santa didn't come this year (or you can say he was early) and everyone is expecting a January slide. I think it is possible we get a technical bounce at the least in the coming days. Indices (nasdaq in this case) usually don't leave gaps for too long and indicators are starting to be oversold. While this is probably not the time to be initiating any intermediate trades, I am focusing on weekly charts for most of this post. It is important to keep the longer term trend in mind when initiating a position in any stock. Also, sometime the weekly chart gives a more clear picture on some of the more volatile stocks and also shows volume increases better.
SUF: Look at the volume increase on the triangle break on the weekly chart. This may be coming into the radar screens of more institutions as the share price increases. What I like about this stock is the ascending triangle on the weekly......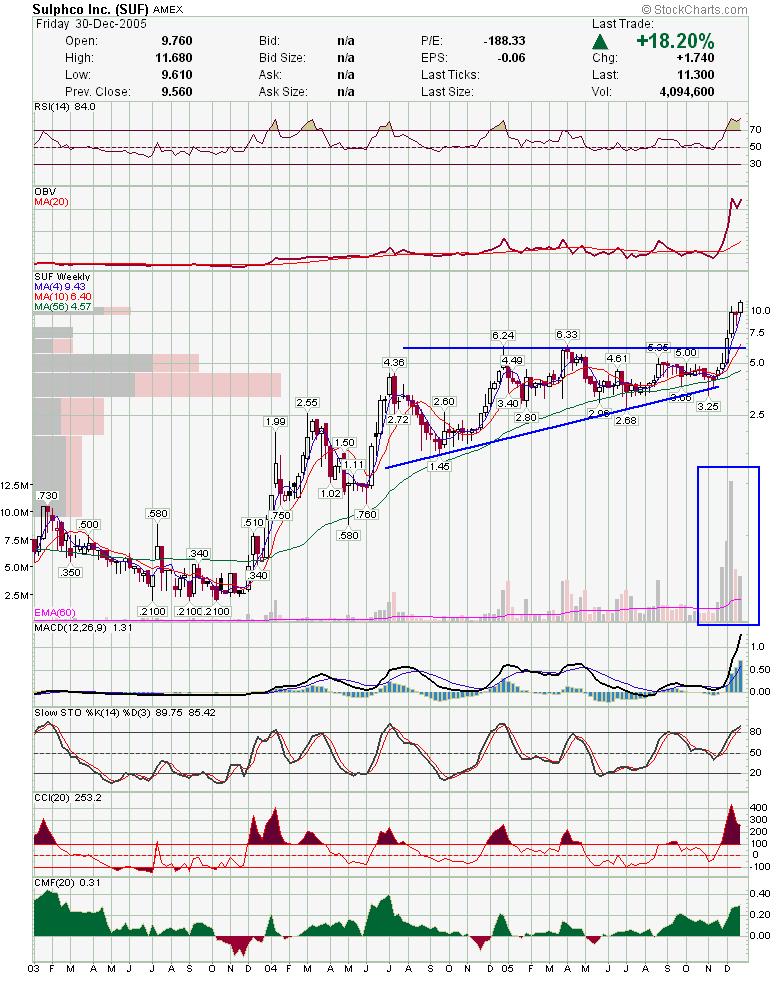 and bull flag on the daily.
 MMUS: Look at the volume here. Also, last candle is pretty bullish.
 SLW: This a recent IPO in a pretty hot sector. Volume is building here as well, as the name becomes more well known. This tends to be lumped in with all ores, but the are a silver stock. Weekly shows a nice uptrend....
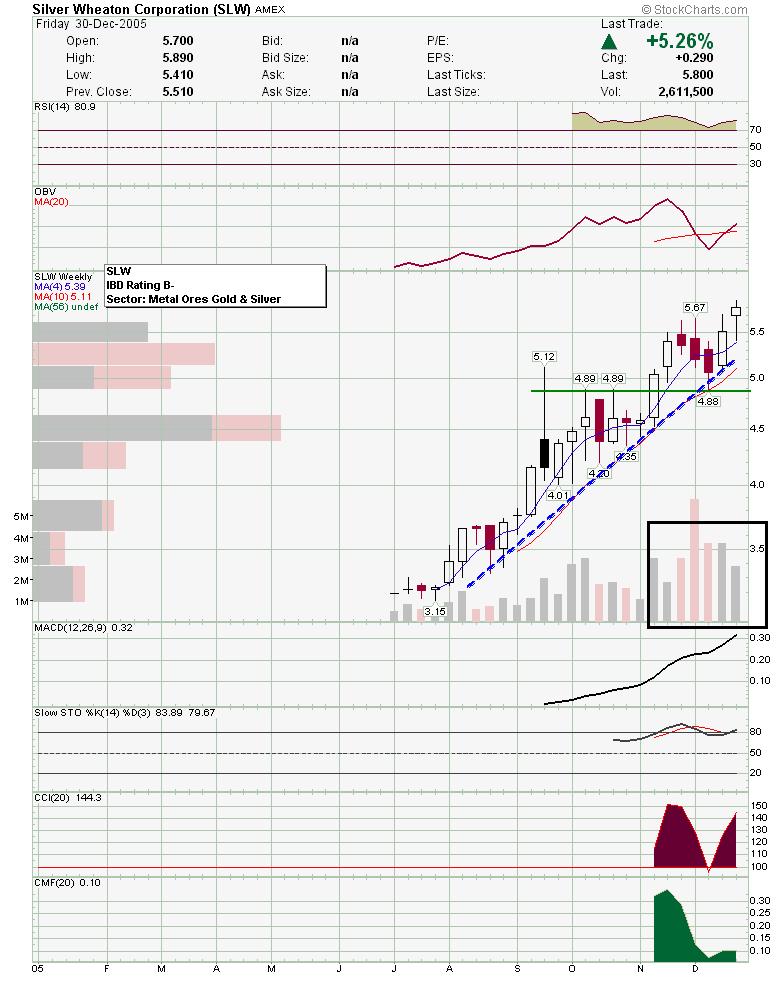 and daily show consolidation over 5.50. Volume looks good here too.
 TALX: Made number 1 on IBD 100 which helped it break the triangle. Now it is pulling back to the breakout area and could take off from there.
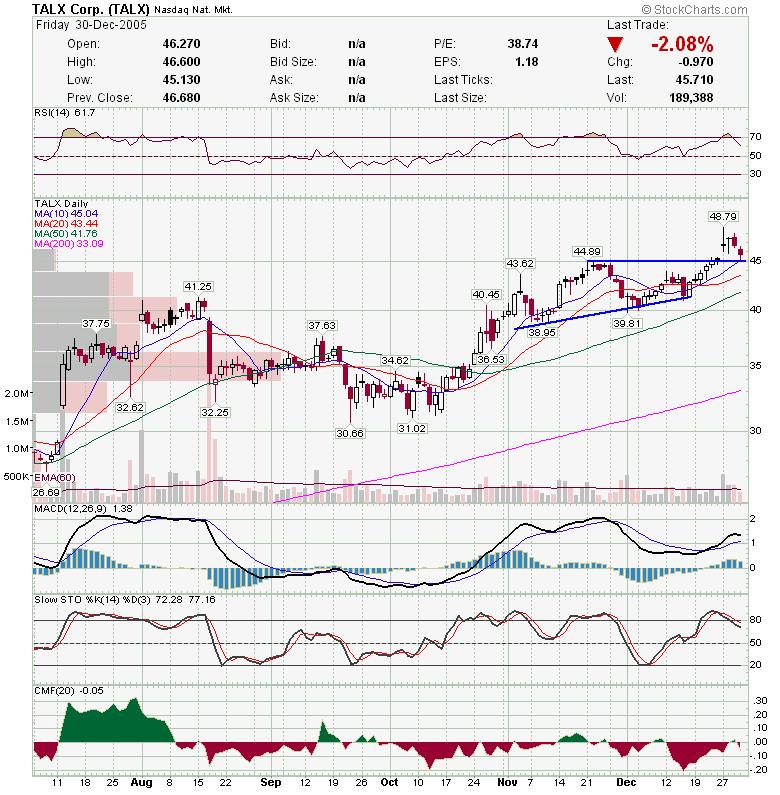 LIFC: Candle pattern wise, this is an interesting setup. piercing patter on trendline confirming several previous candles on same trendline. This may head to red dotted lines which should serve as resistance.
 NWRE: Pulling back to breakout area.
 CMED: May be trading in a bull flag on the weekly chart. Volume decreasing in Flag and daily chart show stock near support.
 GG:I like gold stocks but not sure if this is them time to go long. I am watching GG though cause they are the closest to a base. This chart looks downright bullish and the daily doesn't look to shabby. My concern is with market being oversold and Gold maybe being a little extended. I would love a pullback in the sector.
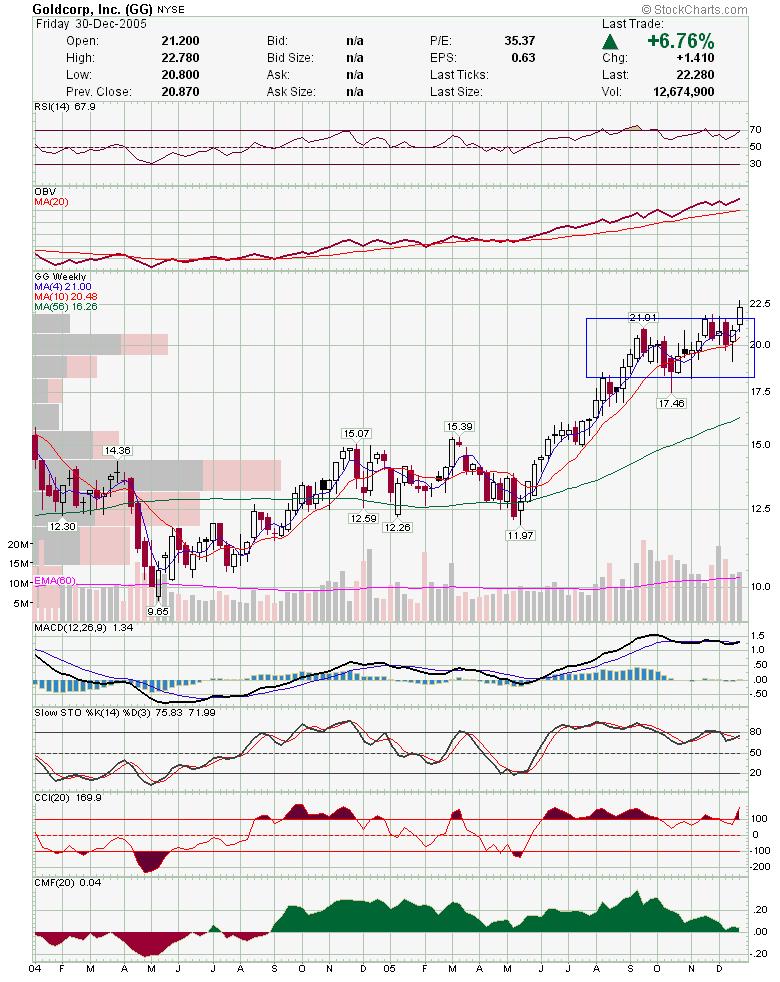 CKCM: While the daily chart looks like a mess, I like this weekly chart. Could bounce here as daily is showing 200 sma as support.
I have several other I am looking at, but I have too many stocks to watch right now. I will be taking a closer look at the following names soon:
holx
CBG
chs
bbd
cib
ubb
cpa
mrvl
vlcm
wthn
pets
Good Luck and may 2006 bring health and prosperity.
DT
Subscribe to:
Post Comments (Atom)


0 comments
Post a Comment