Looks like we started to get a technical bounce after more weakness today. In reviewing charts tonight, I am seeing a ton of damaged charts. By damaged, I mean stocks that have made lower pivot points after double tops, failed breakouts, etc. It looks like a lot of people will be selling this rally, and with all the lower lows, there may be some good shorts coming up.
Here are updated weekly charts offering a better perspective on some of the indices.
Here is the Russell which actually has held above the previous channel.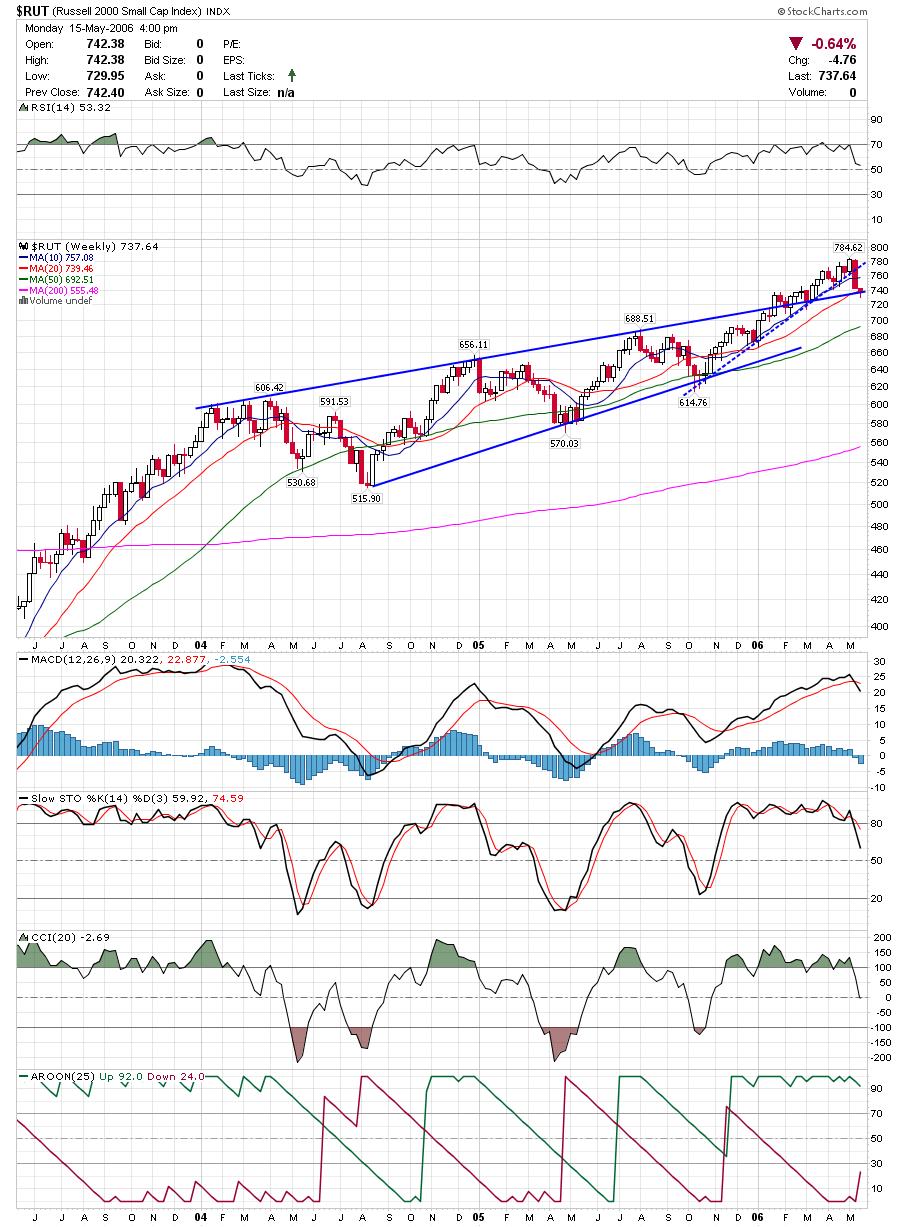 The SP500 rode the upper trendline for several weeks, but CCI, Slow Stochastics, and MACD are all on short term sell signals.
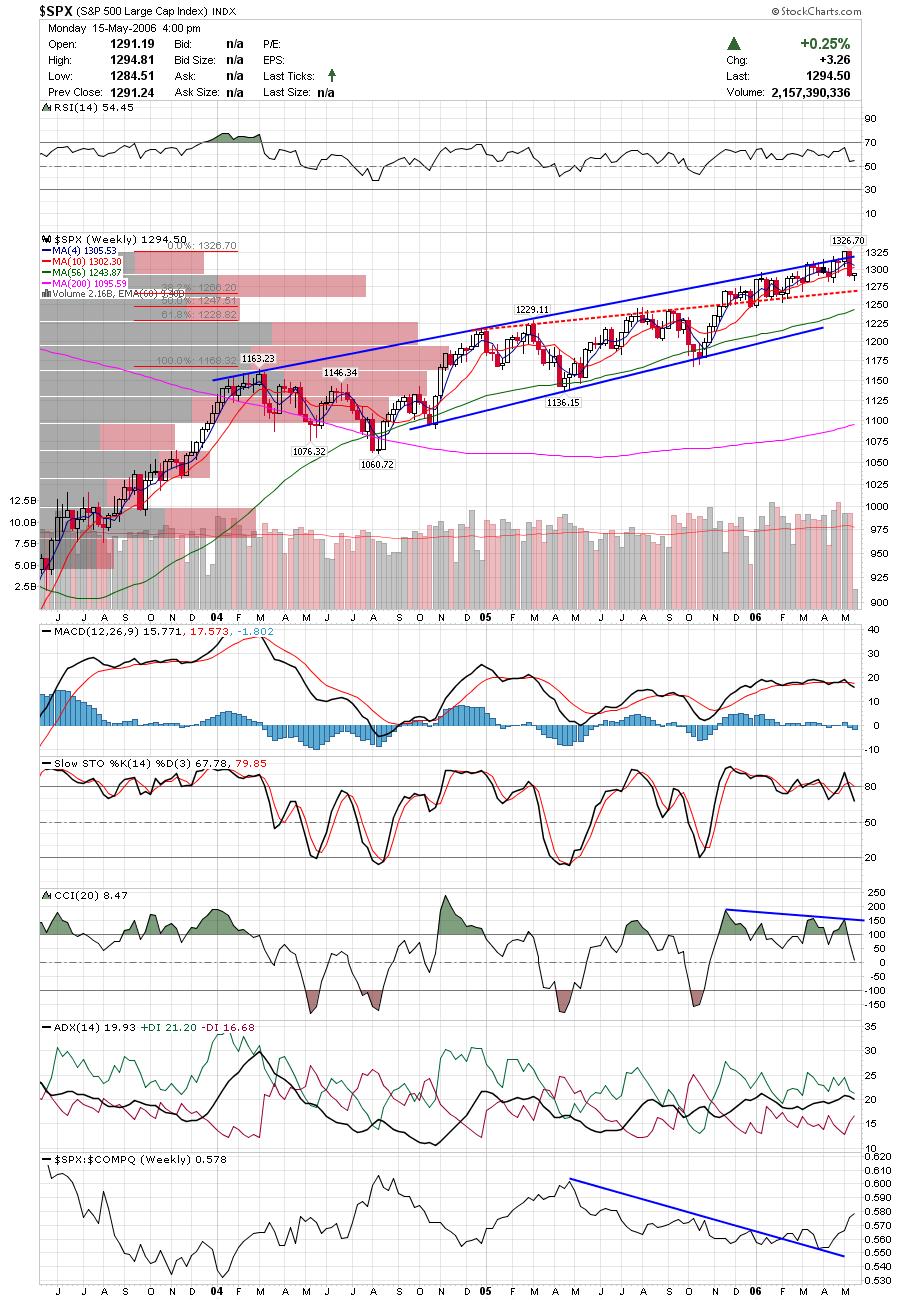 DRIV has held above the red lines I have as previous resistance. If it clears this triangle, it could be a great move.
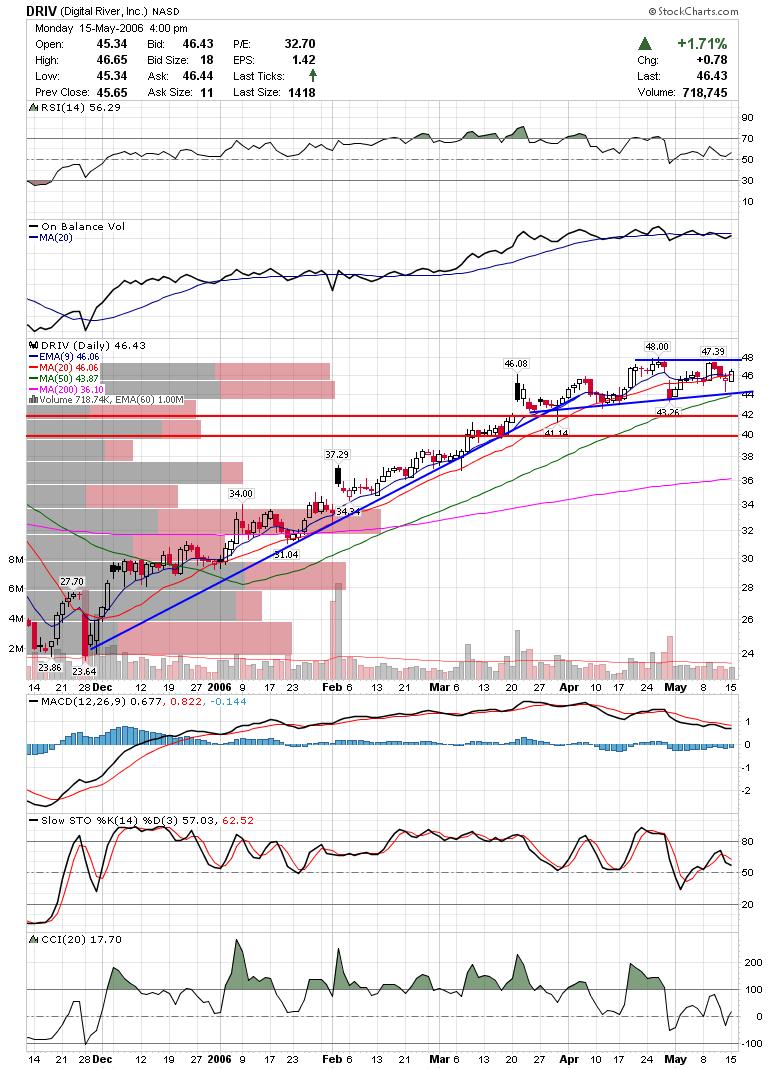 ICE has also held above the triangle breakout without too much chart damage.
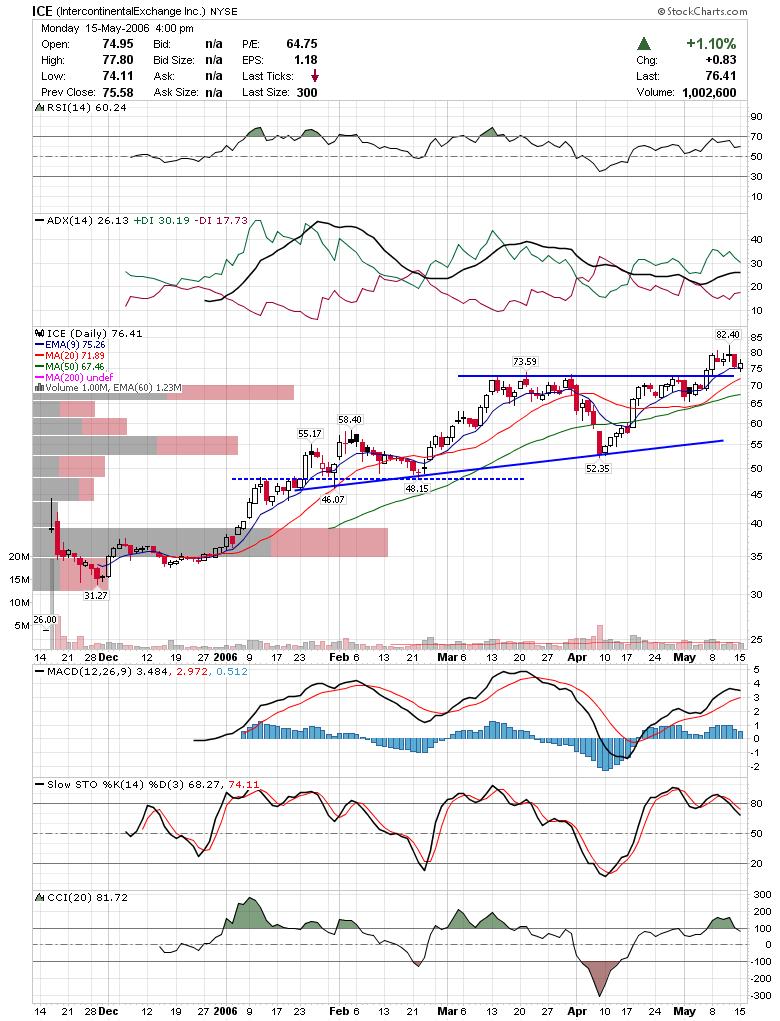 TWGP looks like it may challenge recent highs.
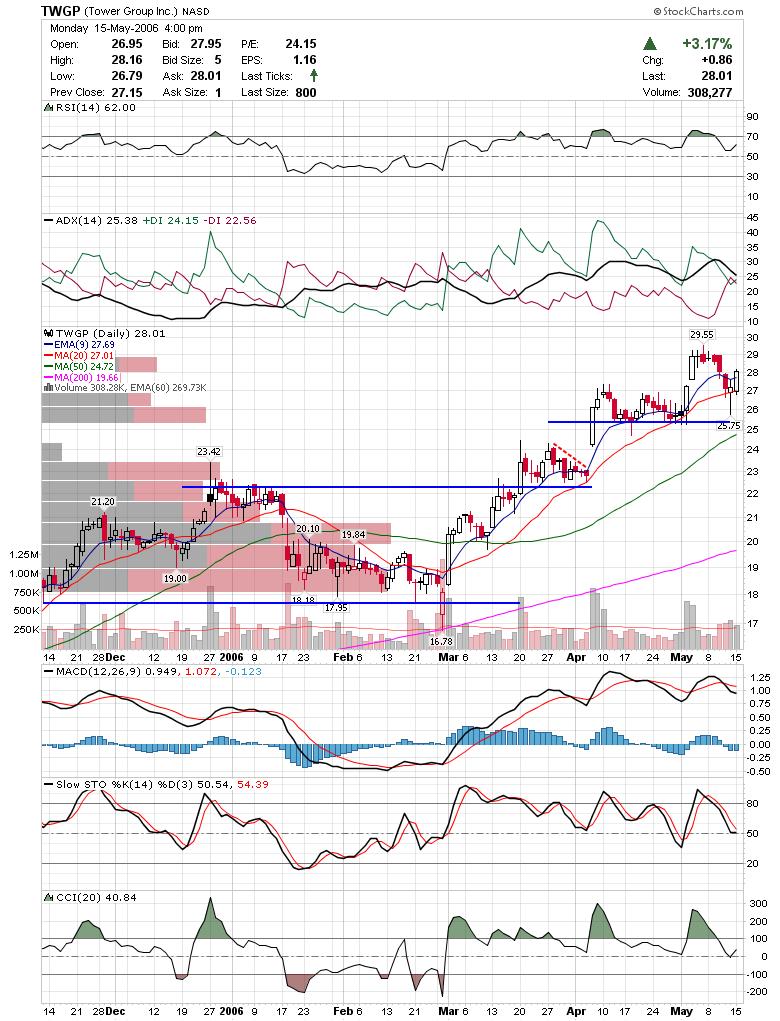 OMC didn't pull back with the indices the past couple days and made a new 52 week high today.
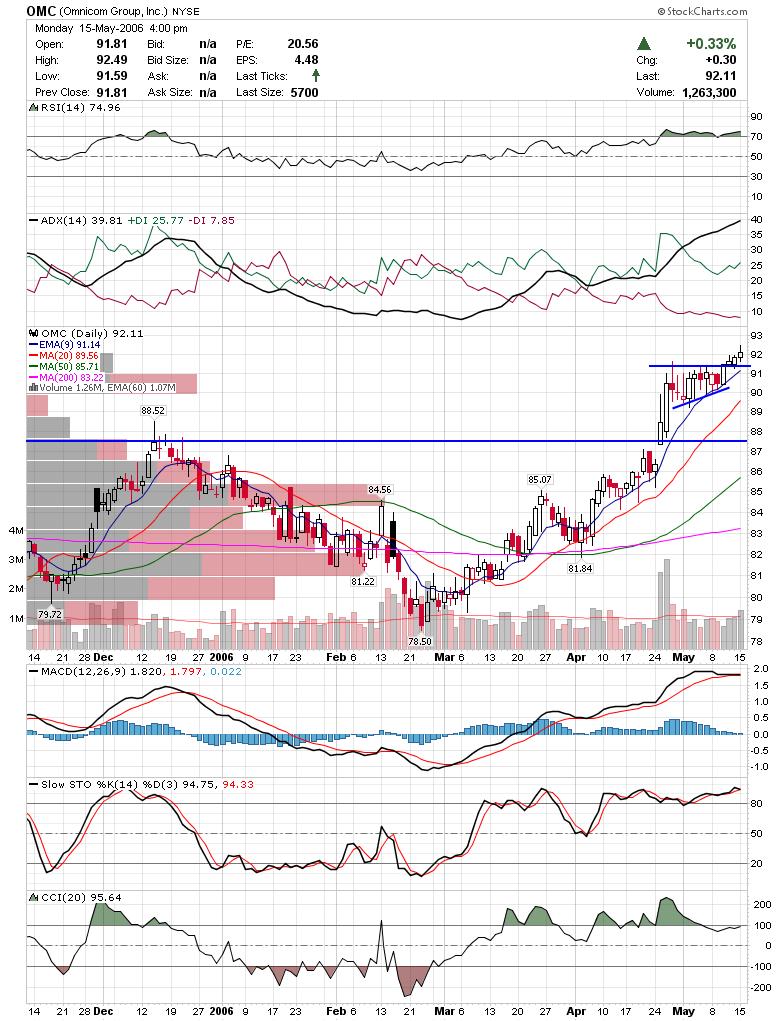
Thats all for tonight.
Good Luck,
DT
Subscribe to:
Post Comments (Atom)


Greetings,
Could you look over SMSI and its possible reversal today? Thank you.
Scott K
Scott,
Clearly 11.20 is an important number for SMSI. I don't have time to post the chart today, but my thought is that it needs to hold this area. I don't like that it breached support intraday yesterday, but it did close above it which is positive. I think it's ok to initiate a position with a stop under yesterdays low, or a short position if it breaks under that number.
DT