There has been some serious chart damage the past few sessions on all the indices. While I still maintain that we are near a bounce, it really looks like we still have lots more downside before the year is up. I think it's a dangerous to initiate new shorts here and there is not much to be had on the long side. I am posting my weekly charts of the major indices for a little perspective on where we stand.
Here is the Nasdaq Composite breaking all kinds of support.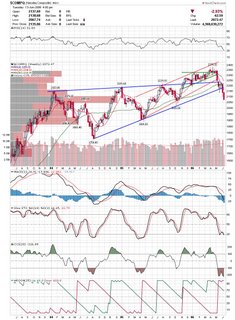
Here is the Dow Industrial Average which has broken some support levels but remains well within the long term channel. Here is the Russell who still has a decent shot of closing the week within the channel.
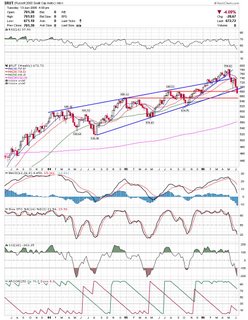 The smallcap SP600 is trying to hold a horizontal trendline but there are clear signals that there is major distribution occuring.
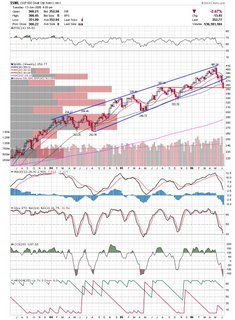 The SP500 is trying to cling to the channel.
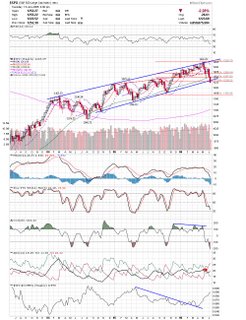 Has Gold capitulated? Today's move in GLD seemed like a panic move and may signal the short term bottom. Looking at the chart I see all sorts of gaps down followed by this large gap on the largest volume since inception. I will be watching the gold stocks here.
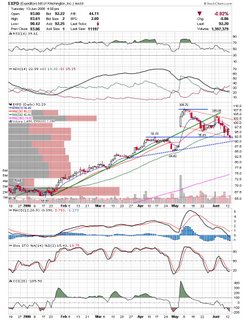
 EXPD has held gap support and may get a bounce here near previous resistance.
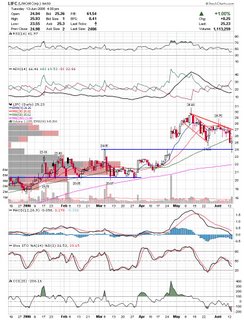
 LIFC came back and filled the gap and quickly reversed. Watch to see if this was the bottom for now.
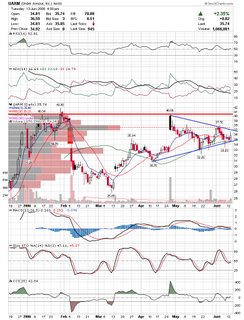
 UARM could have an explosive move to either side of this triangle with the odds being higher right now.
Good Luck,
DT
Subscribe to:
Post Comments (Atom)


0 comments
Post a Comment