One of the things I do each Sunday night is to review the updated Investors Business Daily 100 list. I keep a chart list on my stockcharts account of the 100 and keep it current to the list on IBD. The list is generated electronically and takes their propietary fundamental ratings and technical ratings into account. They have certain criteria such as where in the yearly range the stock is. One clue that the market has been deteriorating is that there are some pretty weak stocks making the list each week. SNDK for example was off the list and made it back despite falling further from their 200 sma last week. I still think we are oversold and due a bounce, so I am not looking to short right now. I am looking strictly at stocks that are hovering near support and showing good one or two day candle patterns.
ADM is still holding the trendline and showing some indecision at falling lower. CELG has been consolidating and looks like it wants to test resistance.
 SAFT may be bouncing off a previous breakout point after failing to hold gap support.
 CL is a nice consumer staple stock that can be added to a portfolio for nice steady move higher.
 ETP has a nice trend going here and may be getting a bounce off the 20sma.
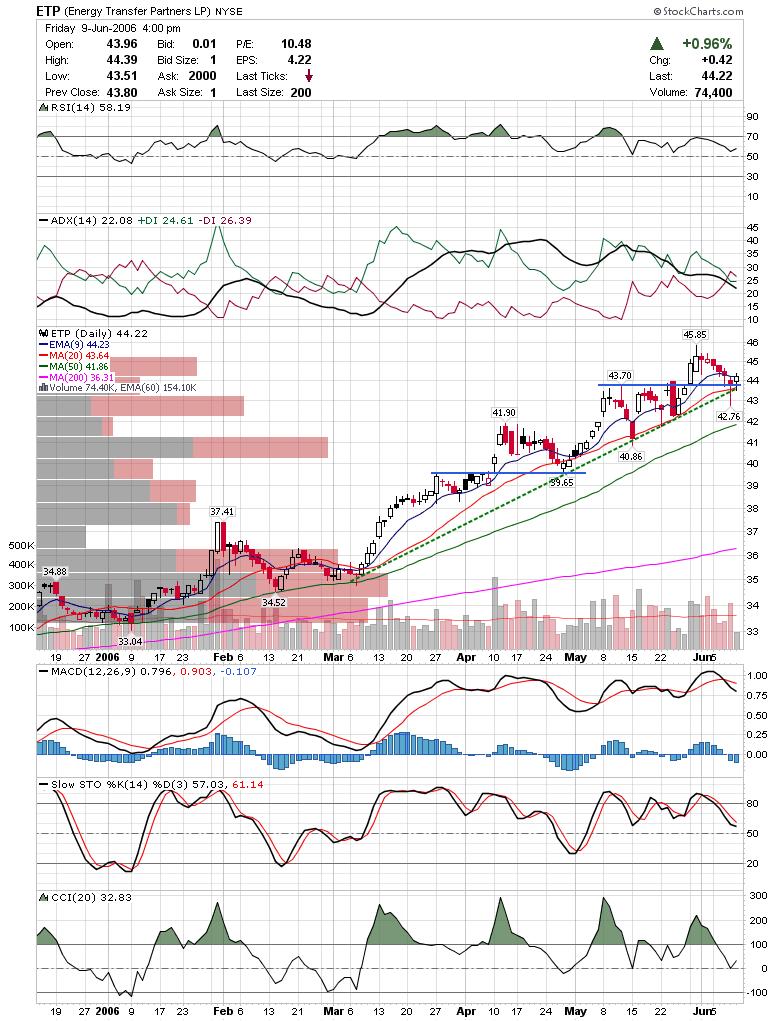 I mentioned a couple weeks ago that FMD looked like it would head to top of triangle and now that it is there it looks like it is struggling near long time resistance. If it gaps lower tomorrow it may be done.
 GYMB looks like it may be forming a second base here.
 IFO has had a wild ride recently and may be forming a little bear flag here.
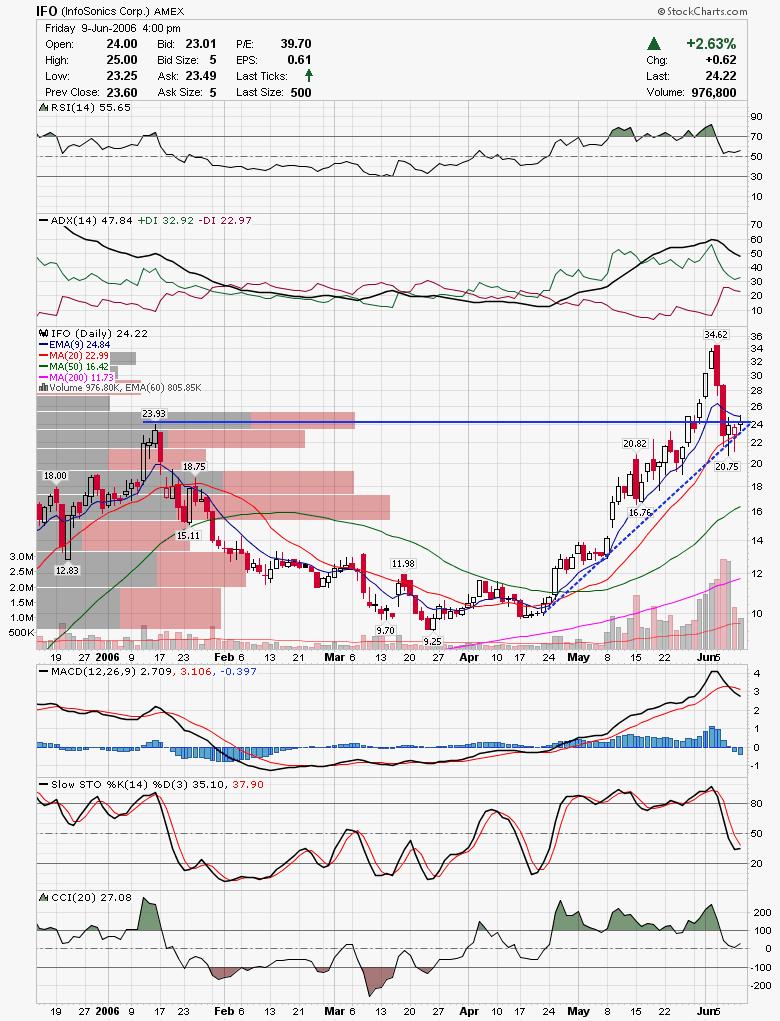 MED may get a nice bounce off the 20sma.
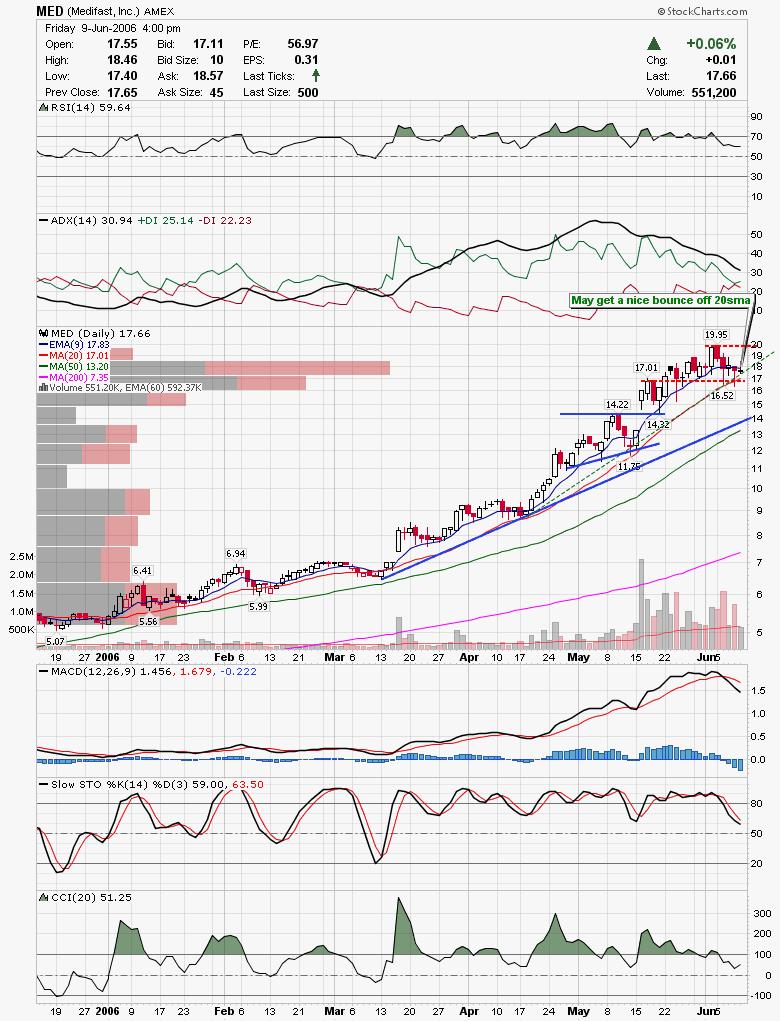 XPRSA may be breaking out of a triangle here.
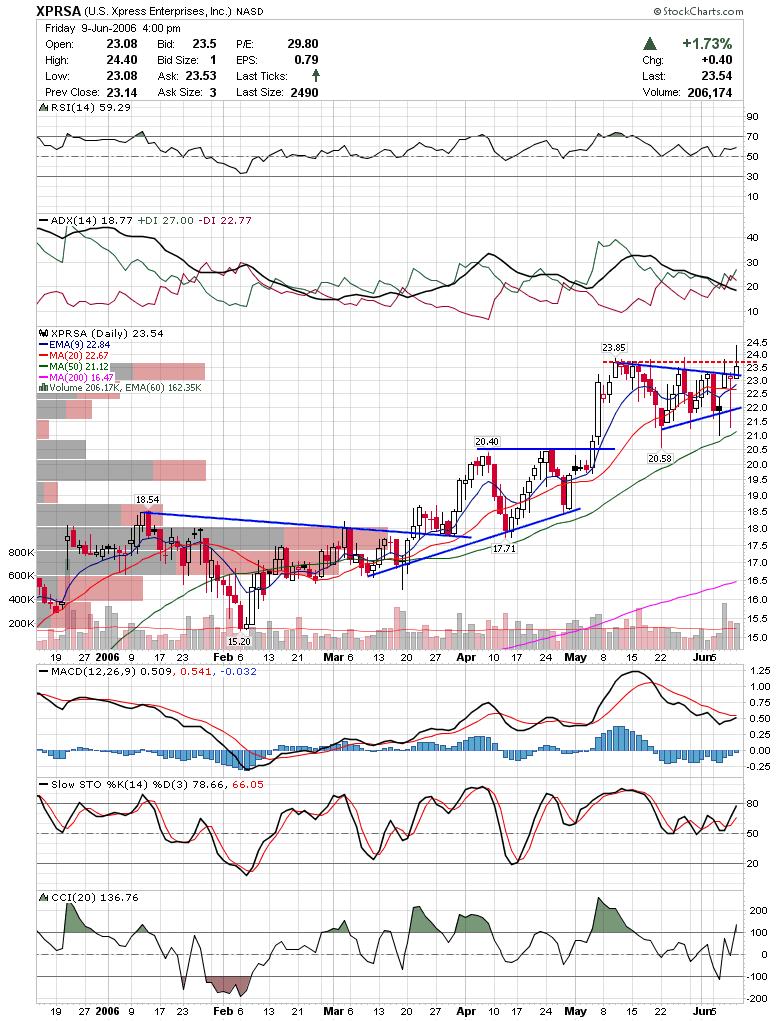
I think Market participants are pretty confused right now so it's best to be overly cautious now. Good Luck,
DT
Subscribe to:
Post Comments (Atom)


0 comments
Post a Comment