Since the markets aren't doing anything I decided to show why I use weekly charts even though I am a short term trader. A lot of beginners assume that they only need to look at the time frame they are trading however, it is very important to check out several different timeframes to try and determine possible support and resistance areas. I like to use the daily and weekly charts to determine what stock to play and then use the 5,15, and 60 minute charts for fine tuning my entries and exits.
Here is XPRSA which I took near 24. This still looks pretty good on the daily chart with volume expanding as it moves higher. However, it is sitting pretty much at my target which isn't apparent anywhere on this chart, unless you measure the triangle breakout (which also yields a target near 27).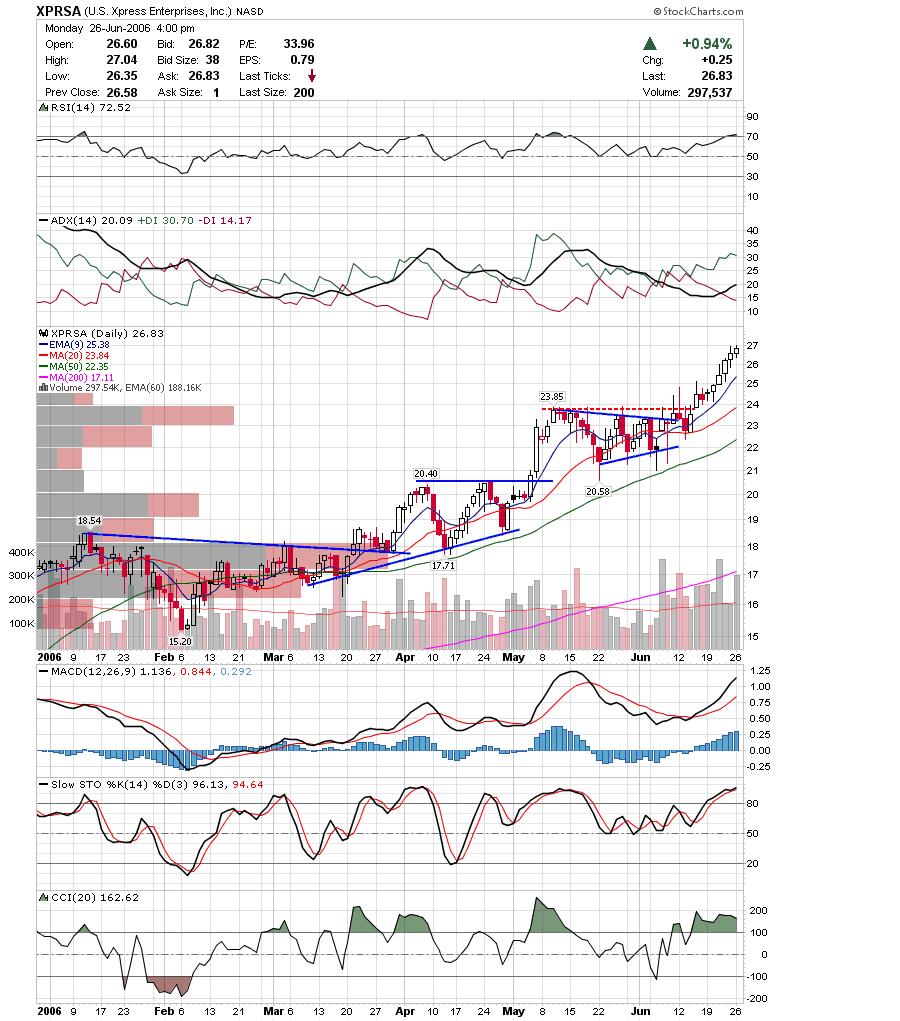 Taking a look at the weekly chart you can notice a resistance area that begins at 27. There is no guarantee that it will stop at 27 on the dot, but this is a logical place to tighten up on my stop. It is very doubtful that it will zoom past the resistance area altogether, so the risk /reward diminishes each move higher.
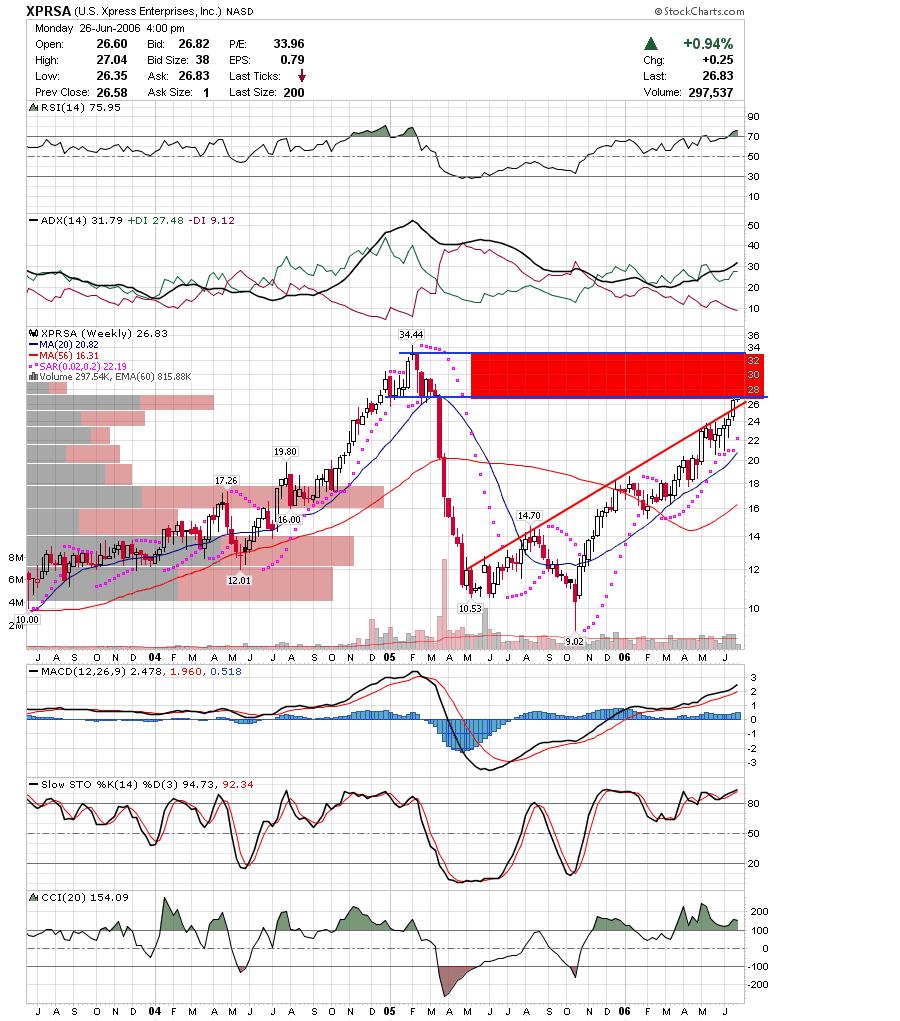 Here is another example. I added to OMNI today on a test of the breakout area. While this is a risky move in the sense that the stock was falling, I felt comfortable with the risk I was taking vs the potential reward. Flag breakouts offer some of the best moves and OMNI has already cleared substantial resistance.
 Here is the weekly chart which shows OMNI trading over significant resistance. OMNI looks to be accelerating the trend since it moved over the ascending trendline. Most of the time these accelerated moves can't be sustained, but I could care less since I am trading this for a short move.
I monitor 15 min, 60 min, daily, weekly and monthly of the major indices as well. I think that anyone trading short term should be aware of what trend is persistent in all of those time frames.
Good Luck and trade carefully as we are in a dangerous place yet again,
DT
Weekly Charts and Short term trading
Posted by downtowntrader | 6/26/2006 09:32:00 PM | 4 comments »
Subscribe to:
Post Comments (Atom)


Maybe it's just a semantic thing, but the difference really isn't whether you look at a weekly candlechart and a daily one. It's more about looking at a six-month chart for recent action, and backing up to a three-year chart for the big picture. Whether the candles are daily or weekly doesn't seem to matter too much, except for the odd instance when a significant candle pattern gets printed on the week.
I have started using daily candlecharts in both timeframes for a very convenient reason. If you use a daily candlechart for a three-year period in Stockcharts.com, you can then keep all your annotations when you change the timeframe to six-months and daily! That way my resistance and trendlines carry over.
Just a thought.
noDoodahs,
Thanks for your thoughts. I agree to a certain extent, but I like to use different MA's and indicators on my monthly charts. I also think weekly charts clear up the noise a little better then a long daily chart. It's definitely more of personal preference thing. I setup several different views in the toolbar on the left side of stockcharts.com and toggle between my daily, weekly, 60 minute, and misc other indicator charts.
DT
downtowntrader:
When you said you are a short-term trader, how short is it? Days , a few weeks, or just day-trading?
Ken
Ken,
My typical swing trade is from 3 days to about two weeks. I do also daytrade.
DT