The indices are in a precarious situation right now with most looking like they are stalling on the weekly charts. I have lots of charts tonight so I will get right to it.
Gold continues to drop and it will be interesting to see how the cease fire in Lebanon will impact Gold and Oil.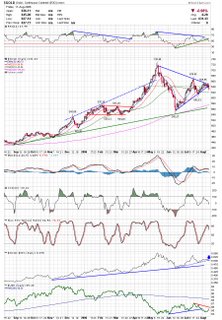 Here is a weekly chart of the Russell showing a doji followed by a reversal candle. Keep an eye on the trendline.
 Here is the OIH etf. The head and shoulder top remains a threat and if oil pulls back on the Middle East news then OIH may complete the pattern.
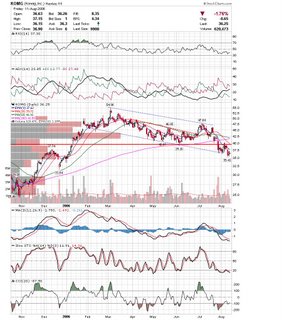
 KOMG may resume the downtrend after two inside days.
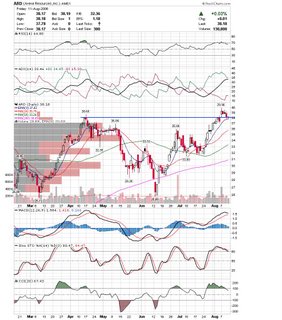
 ARD may get a pop on moving higher in IBD 100 rankings.
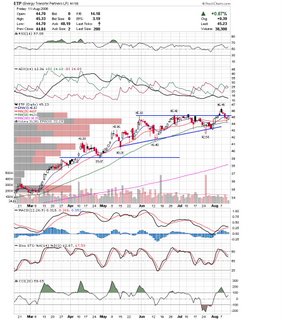
 ETP printed a bullish candle pattern on support so watch to see if it can clear resistance.
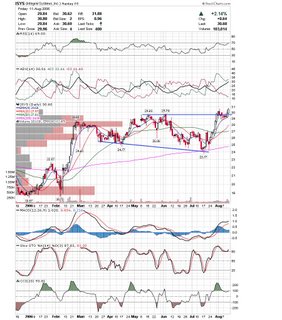
 ISYS is above resisitance and has been holding up on weak days.
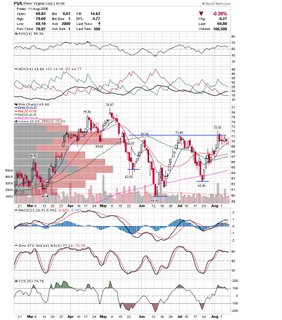
 PVA is close to completing a reverse head and shoulders pattern. Keep an eye on the neckline.
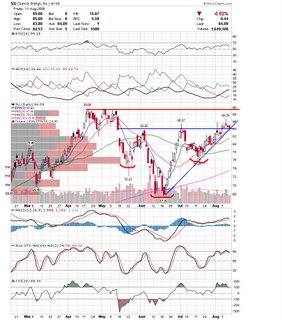
 Here is another reverse head and shoulders pattern that was completed in SU. It could be a whipsaw though as a shooting star at 86.78 is giving a warning.
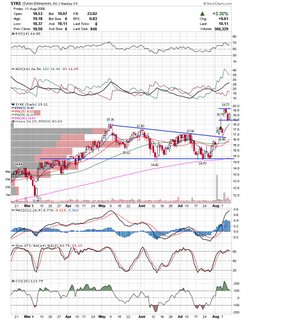
 SYKE may be in the process of forming a bull flag.
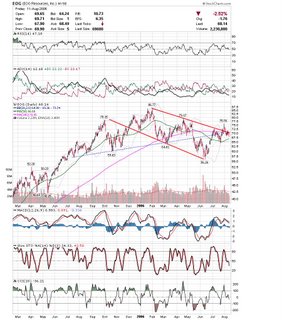
 EOG looks to have failed a breakout. It still has room to the downside after completing a head and shoulders top.
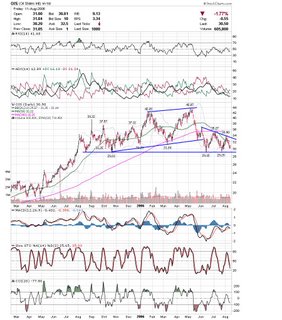
 OIS is up against longtime support. If it breaks down it should fall a long way.
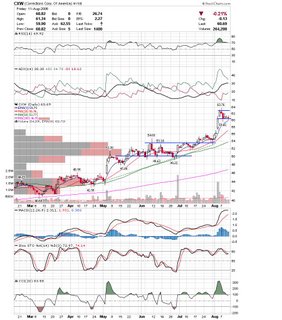
 CXW has been holding up well and could move higher if the markets get a bounce.
 HAL has been holding up in this area, but momentum is slowing and the trend is still down.
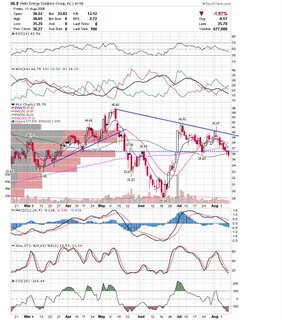
 HLX is another energy stock that looks weak.
I highlighted BBBY last week and it continues to stay under the trendline. It looks like it will head much lower.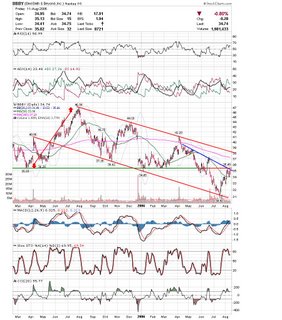
Thats it for tonight. Good Luck,
DT
Subscribe to:
Post Comments (Atom)


0 comments
Post a Comment