It was tough to prepare tonight as the markets look like they could easily do anything at this point. The indices are overbought and could easily consolidate sideways. They could continue to push higher as excitement builds, or they could fall apart abruptly due to various pressures not limited to seasonal weakness, inflation concerns, etc. In looking at the indices the charts are certainly looking bullish and although there are several signs pointing to a weakening market we can't fight the tape. If the market is going up in the near term, then we go long.
Here is a chart of the Nasdaq composite. The most interesting thing to point out is near the bottom. If you look at the Nasdaq / SP500 ratio you will notice a trendline break. This is bullish as it shows market participants taking bigger risks.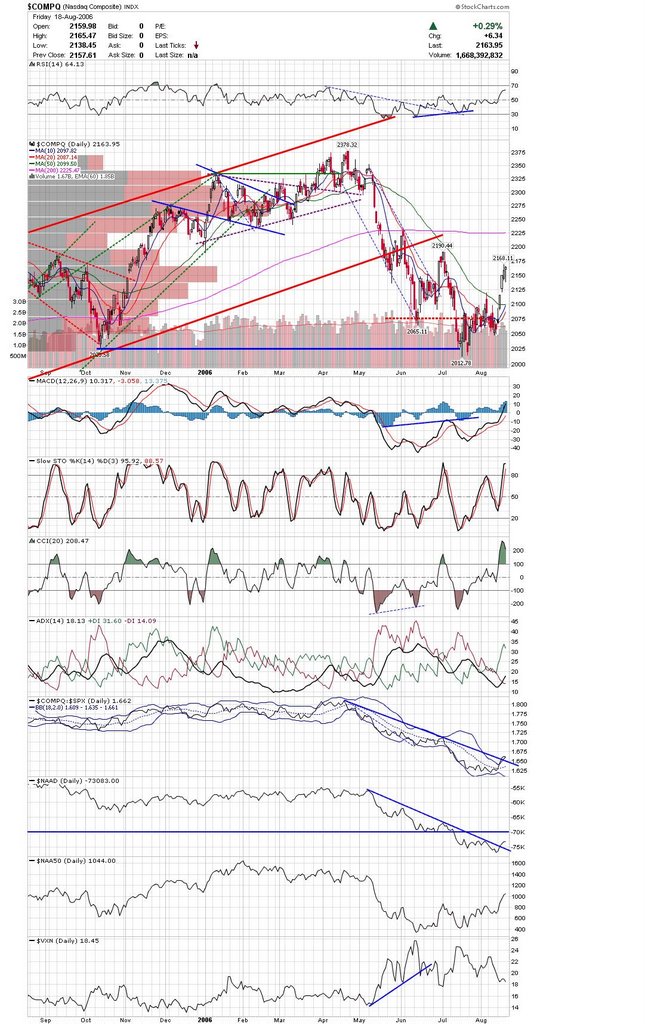
Here is the Dow Industrials clearing a double bottom with a target that takes it to new high territory.
Here is a monthly chart of the DJIA showing a cup and handle type base. It will be interesting to see if it attempts to clear the pivot point.
ADM is looking interesting as this base matures. It failed to reach the lower area twice now and looks like it is headed to the upper trendline.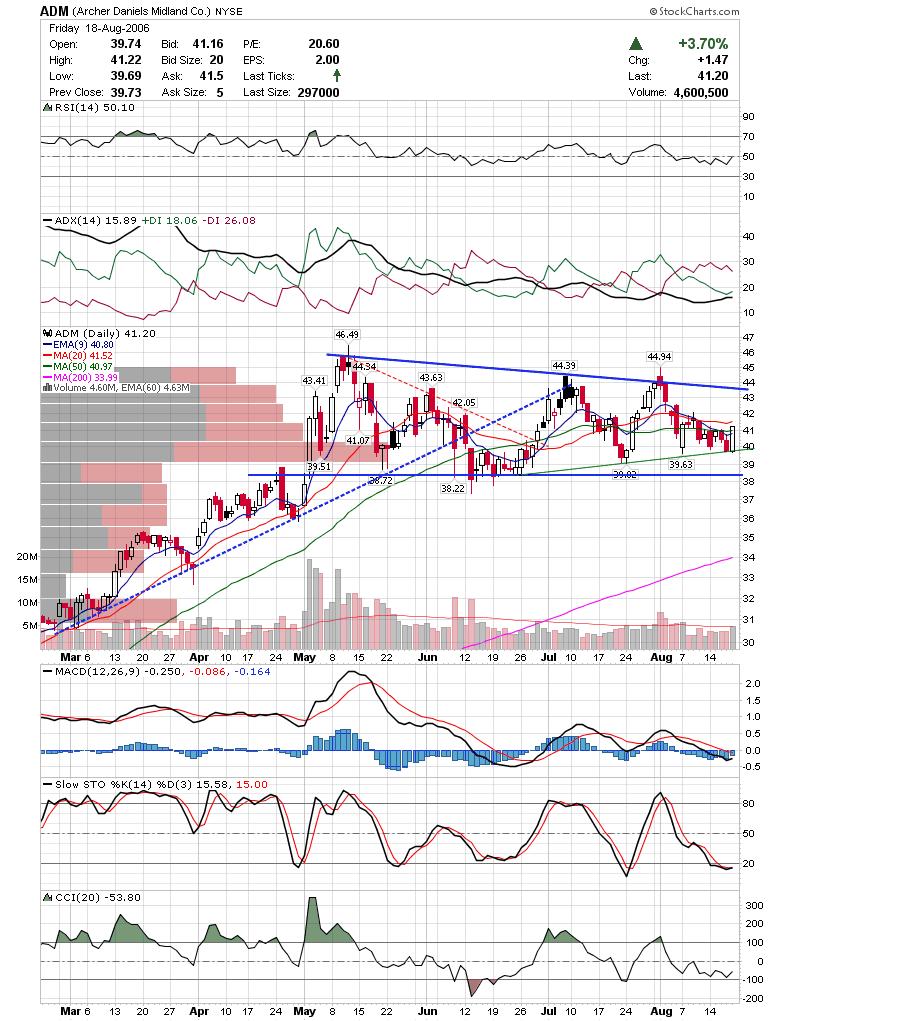
ARD has been holding up well with weakness in it's sector. It may get a bounce on this ascending trendline. EZPW looks like it is finding support and may be headed higher.
Lots of gold charts look oversold and may get a bounce this week. Here is GG near the bottom of a triangle.
The GLG chart looks very similar to the GG chart showing a hammer at a support line.
ICE looks like it will follow through on the triangle breakout.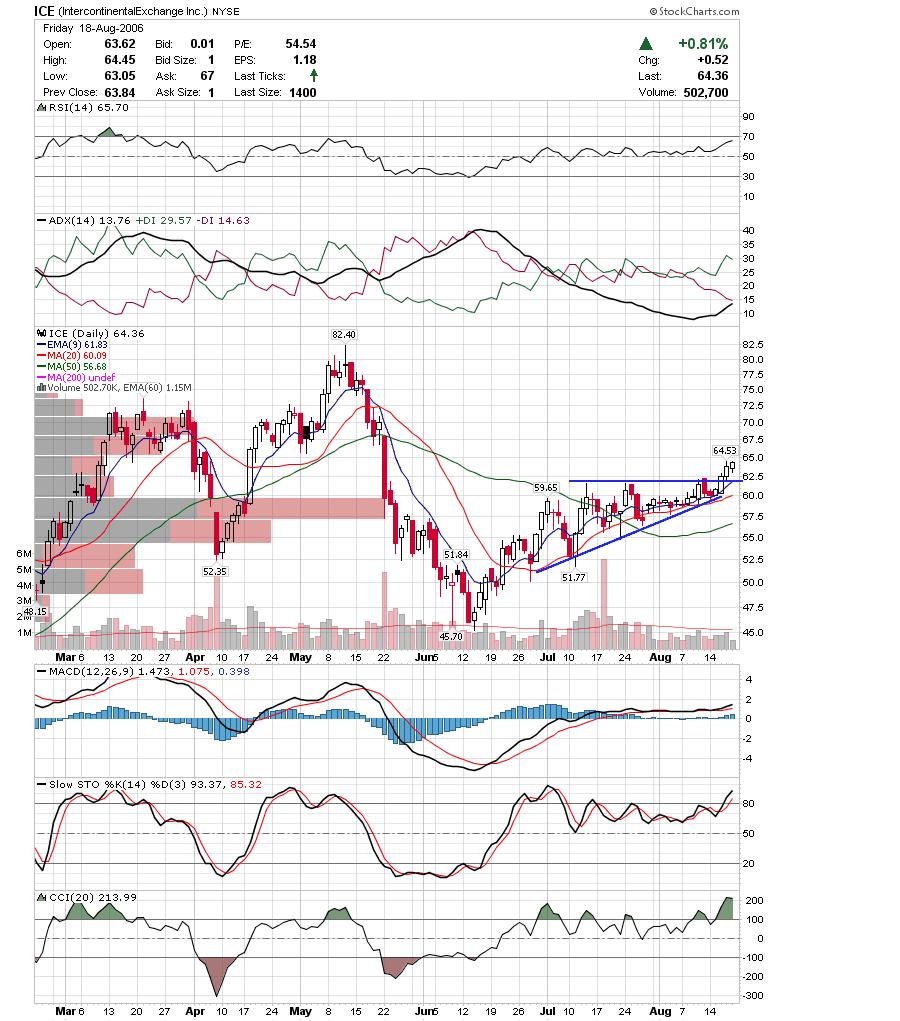
NEU cleared the downtrend and now is consolidating in a bull flag. If it clears the flag it should head to a new high.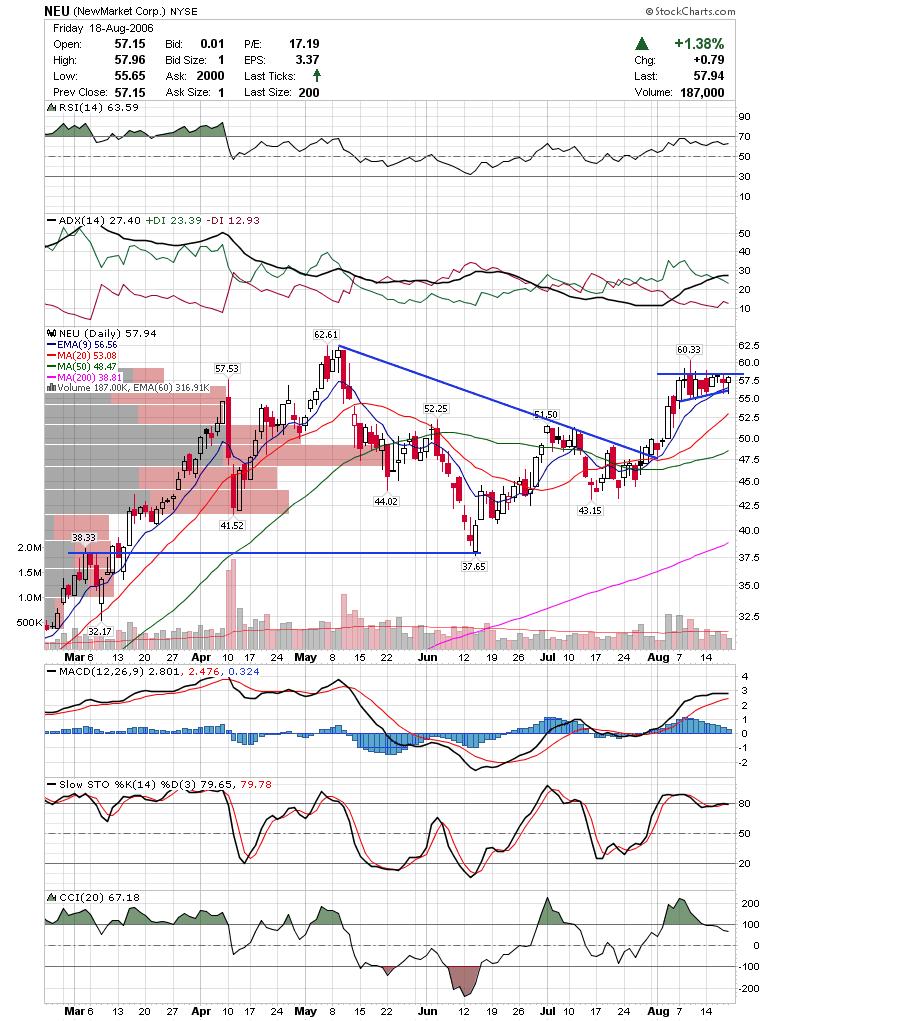
TXU came back to test the breakout area and had a nice bullish morning star candle pattern on support.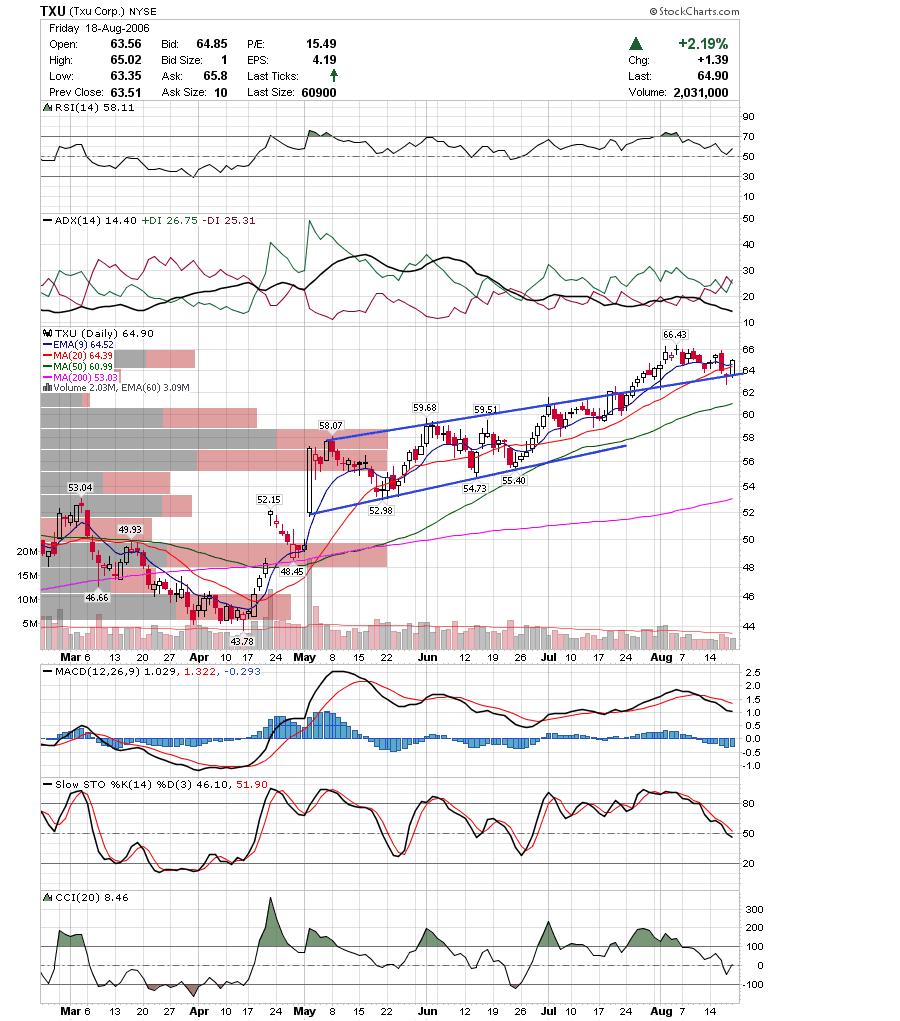
WCC looks to be breaking down here as it was rejected on the descending trendline.
ANDE looks like it may hold up at the bottom of the ascending triangle. I would be careful if I was short as it could break the downtrendline on this attempt.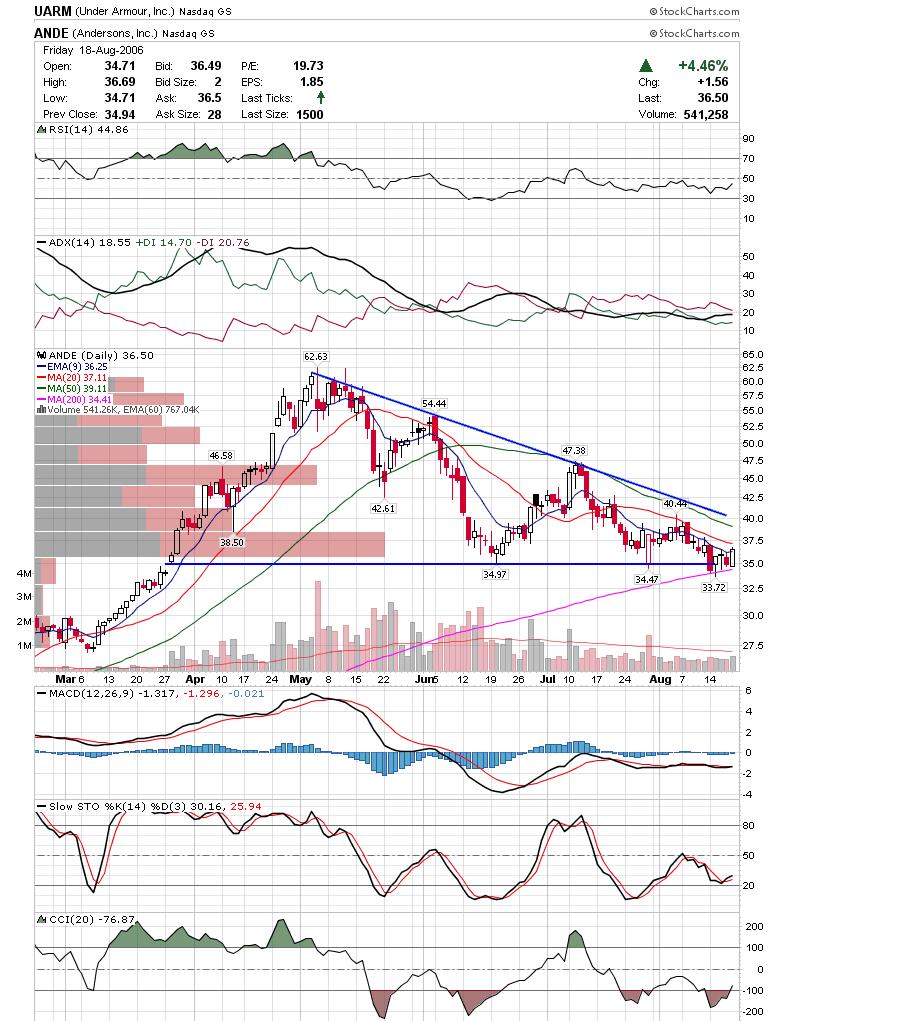
FILE is looking quite bullish with this bull pennant forming.
As pointed out last week VIVO indeed touched the downtrendline. At this point, we wait for a reversal pattern for confirmation.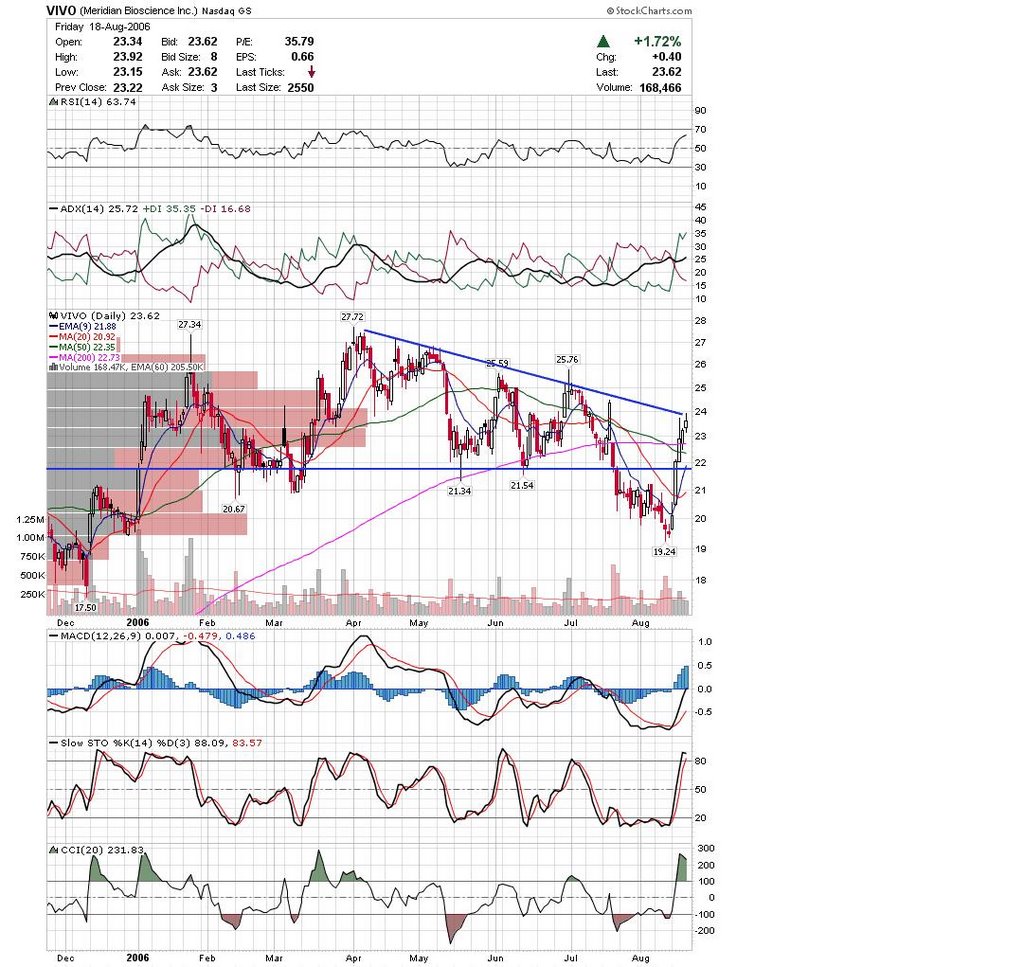
TIE is headed back up to the descending trendline and may be a short again.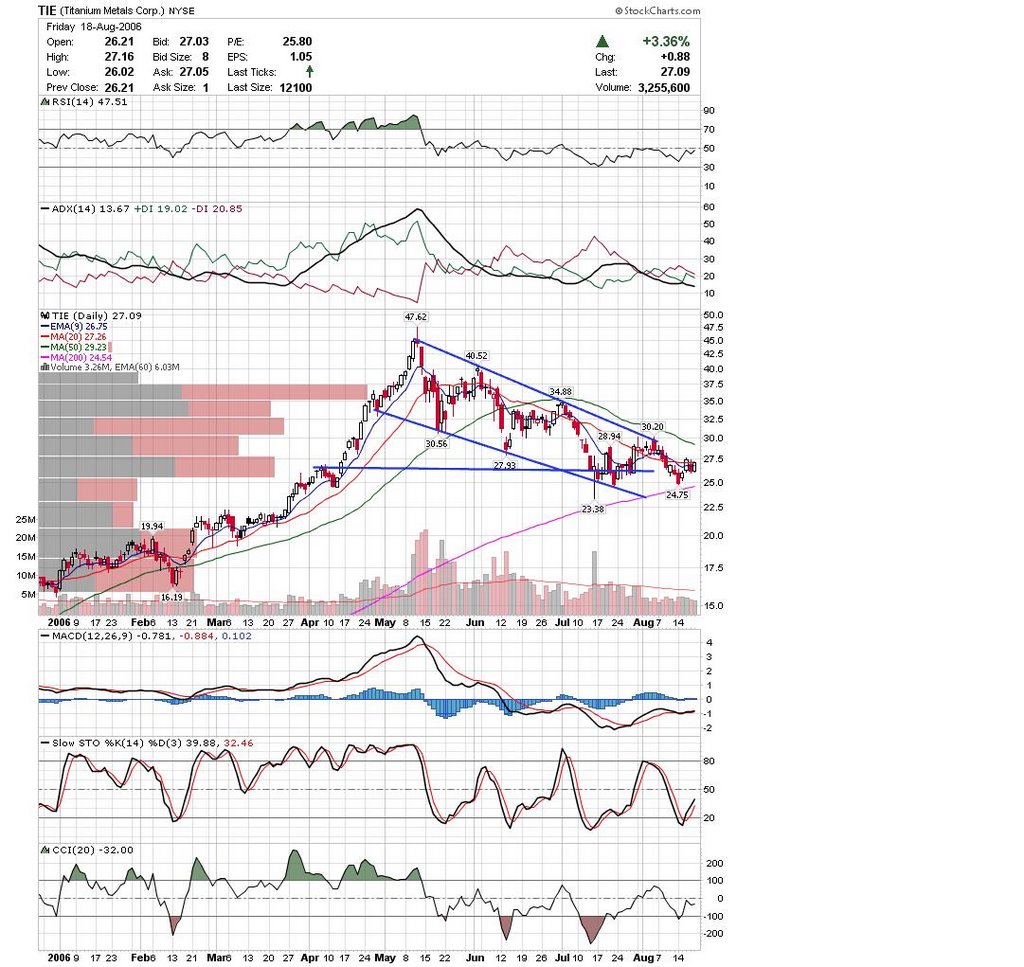
NTRI is quickly running out of room and should make a move anyday now.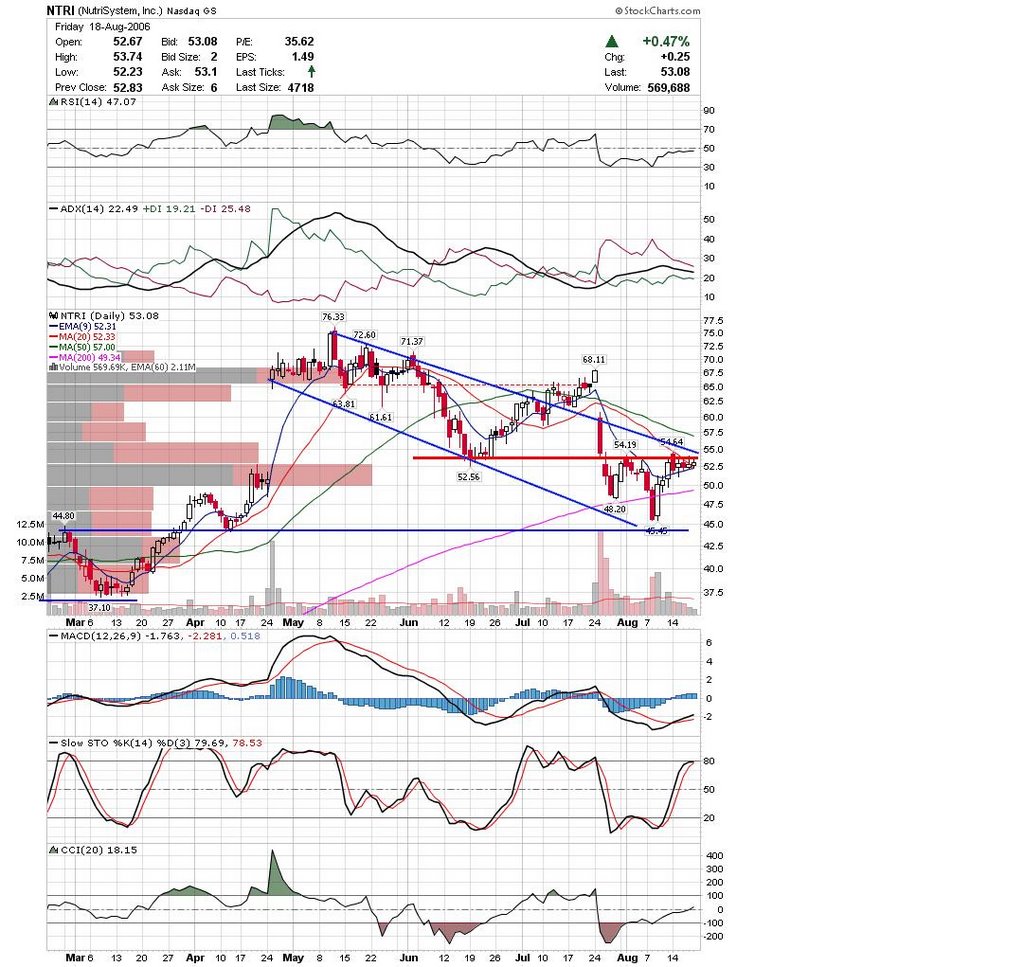 WNR looks like it is trying to find support here at the ascending trendline.
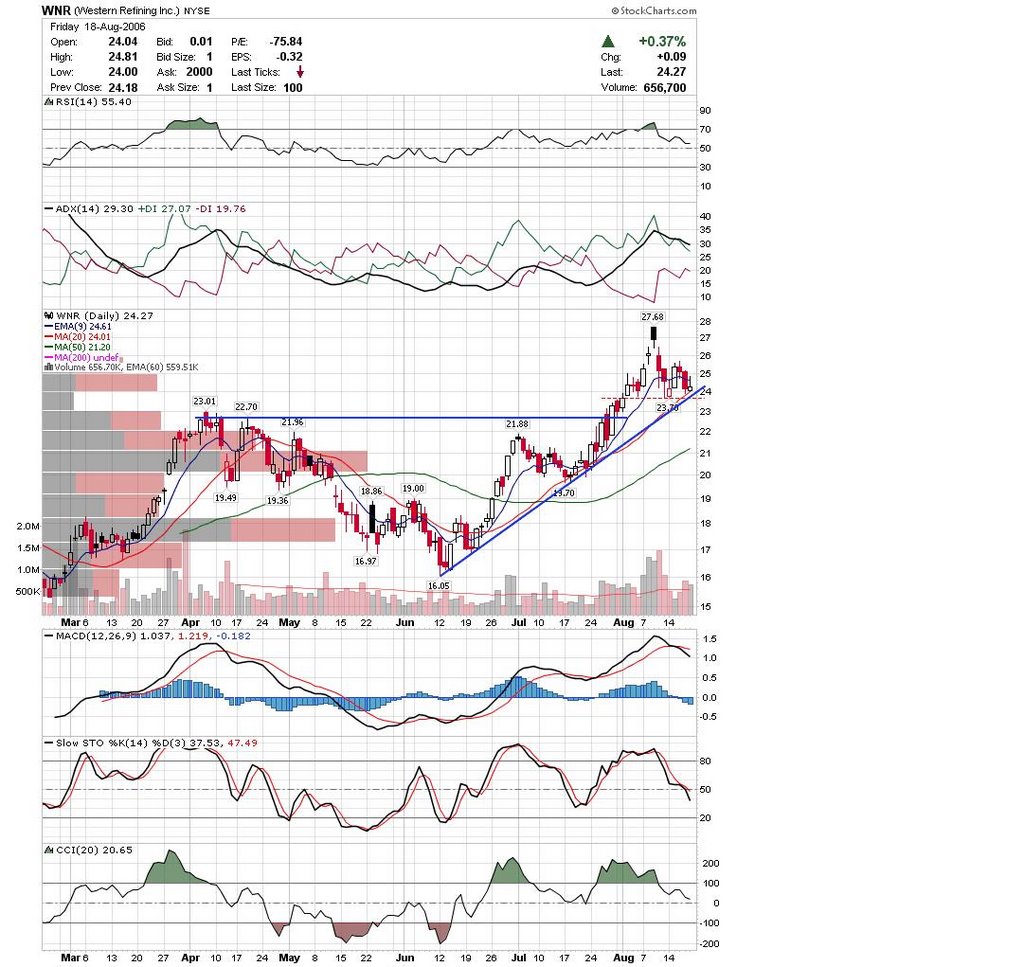
CKFR fell out of this little triangle on Friday and may be headed for a retest of 34.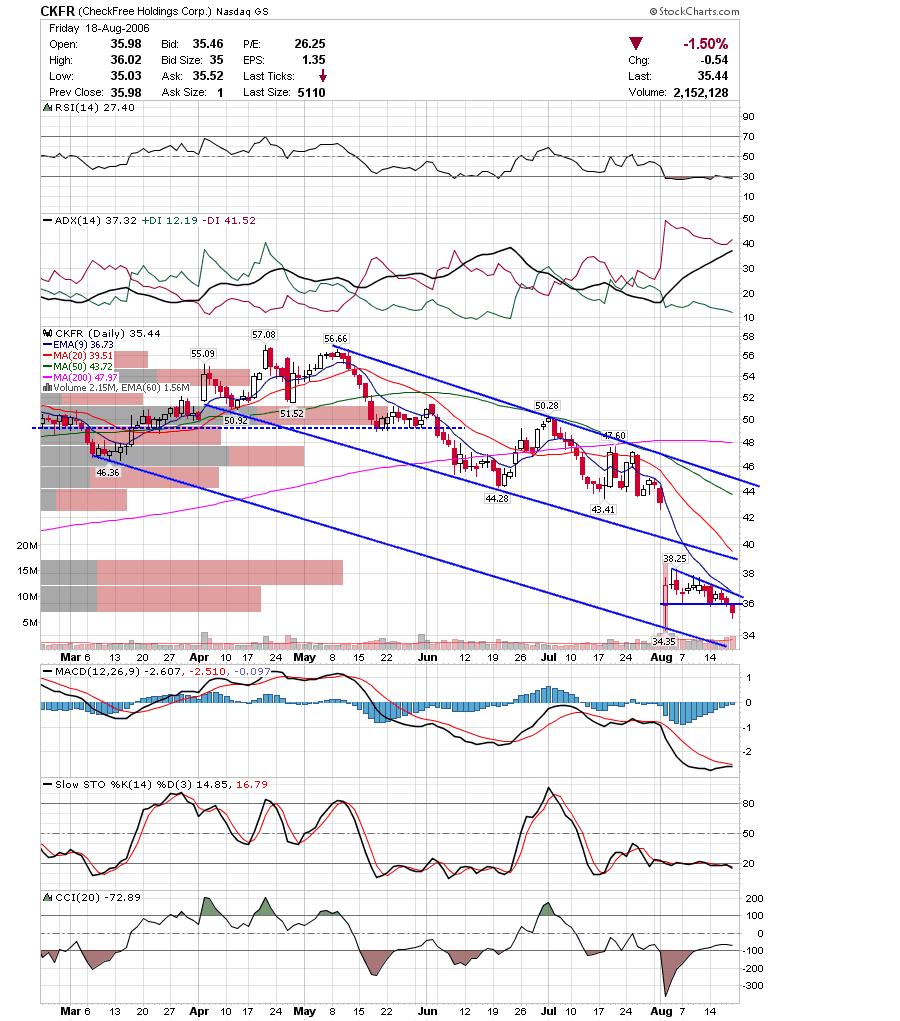 Keep in mind that sometimes on the monday following options expiration there is a counter move to the preceding action which would mean lower prices the next few days. Also, Traderfeed had some interesting data on the days following 5 day highs on the SP500.
Good Luck,
DT
Subscribe to:
Post Comments (Atom)


0 comments
Post a Comment