Tonights update is a little different then the usual Sunday night watchlist. I don't think it makes much sense to enter any swing trades until after the fed announces their decision in a couple days. A lot of people are looking for the much anticipated pause and hoping a rally will occur. I am a little suspect of any substantial rally at this point, although I would be more then happy to participate if thats what occurs. I think the next substantial move will be down although I am open to the possibility of some more life in the summer rally. What I decided to post tonight was some of my sector charts, some of which are still under development. There is a good chance that commodities are topping and there may be some good money to be had on the short side.
Here is a chart that shows three of the four markets. Bonds, Stocks, and Commodities (Currencies are ommitted). The normal market cycle is for Bonds to rise first, then stocks, then commodities. Bonds are then the first to peak, followed by stocks, and then commodities. The purpose of this chart is to show the three markets together to see which is outperforming and to identify the rotation. I highlighted with arrows the previous market tops and then the current possible tops. I think it's clear that bonds peaked already. The question is whether stocks peaked already and if commodities are then following. Here is a chart of the $crb and the dollar index. While the $crb is still comfortably in an uptrend, notice it failed to reach the upper Bollinger band after bouncing off the mid point and 39 week ema.
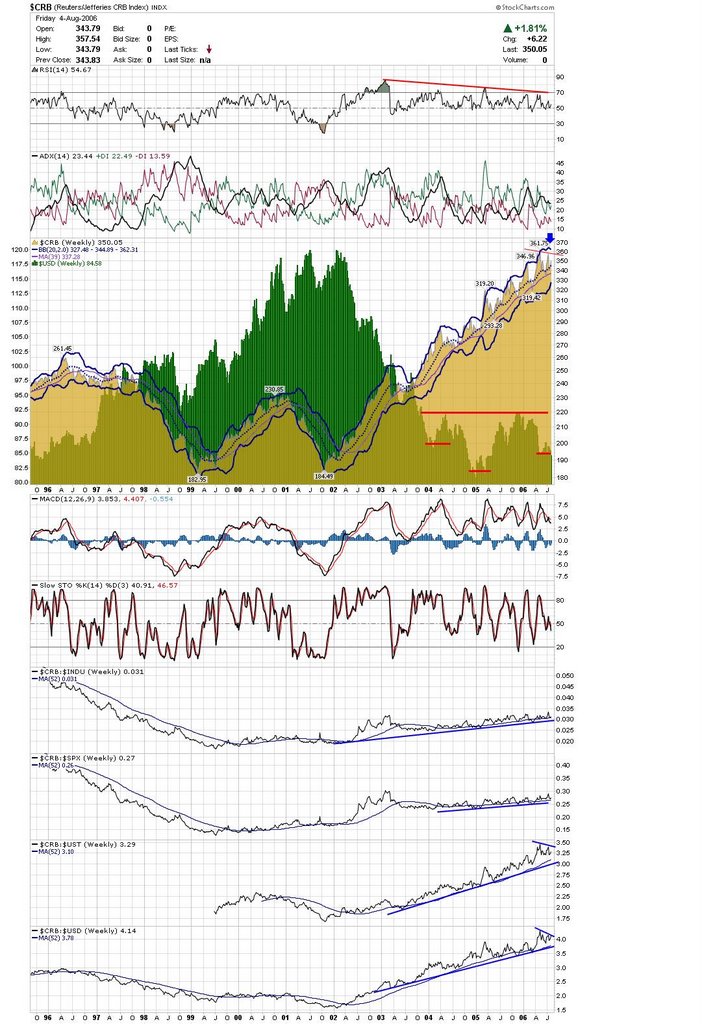 The following are some etf charts.
Here is the $osx which is looking pretty similar to the OIH. Oils stocks are still looking weak to me and are ripe for a correction after this last bounce higher. Retailers may have a "whipsaw" rally after breaking support and then bouncing back. I think ultimately this rally will fail.
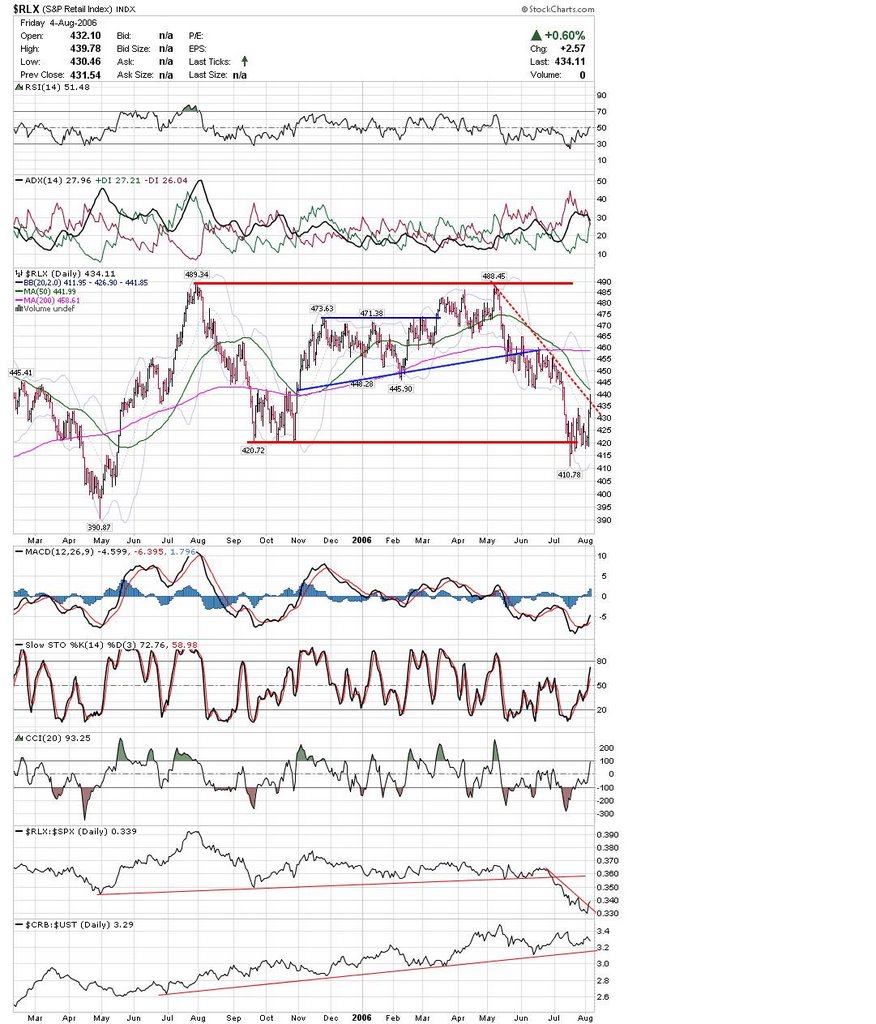 Natural Gas is one the only energy related areas that looks bullish to me. Here is the $XNG coming back to test support. While there is always the chance this is a failed breakout, the path of least resistance is still up.
 Here is OIH. The last leg up failed to make a higher high and the possible head and shoulders top is still in place. With the mess in the Middle East and hurricane season upon us, you would think the Oils stocks would be going crazy. Since they are not, you have to wonder if the big boys are selling into every rally?
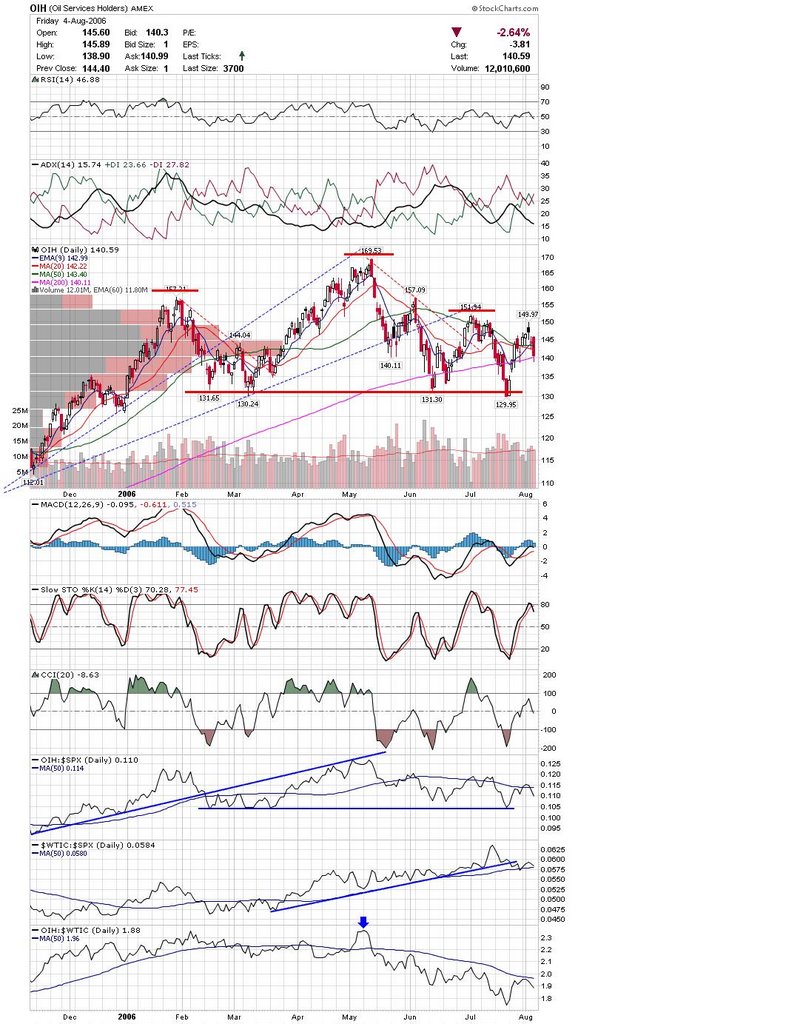 Here is the Brokers which are also looking good. They may pull back here if the market downtrend resumes, but they should hold up better then other sectors.
As I mentioned before, the Fed meeting should be a market moving event, therefore I am not entering any new trades, and as a matter of fact, I only have one trade open right now (Short HAL). The Fed pausing acknowledges that the economy is weakening and can't weather more rate increases. Eventually this will show up in corporate earnings and in turn impact the markets.
Good Luck and Good Trading,
DT
Weakening Commodities offer clues to Market direction
Posted by downtowntrader | 8/06/2006 09:24:00 PM | 0 comments »
Subscribe to:
Post Comments (Atom)


0 comments
Post a Comment