The Markets had a very strong move higher with volume surging today. We may be seeing a massive short covering move here, as bears may capitulate. One of the more interesting plots today was the reversal of commodity related stocks. This morning I saw oil and gold stocks tanking and my thoughts were that it may get ugly. I had a few short positions on oil stocks and I felt pretty comfortable around lunch time with them. Early in the afternoon I realized that they were at the high of the day and volume was coming in. I covered all of them early. This may of been a capitulation move as the last group threw in the towel. While I'm not calling a bottom, my guess is that we will see higher prices here the next few days and quite possibly much higher prices. If everyone is still bearish and waiting to short the next move up, then these stocks could "climb a wall of worry" much like the indices have the past few weeks.
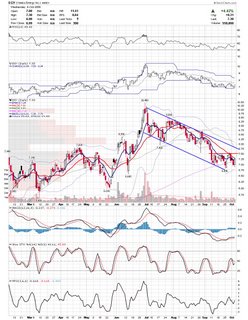
FTEK is trading a great cup and handle here breaking out of the handle today.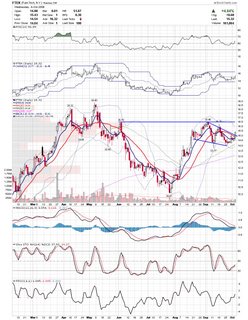 EGY is possibly bottoming here with a little triple bottom at support. It needs to clear this channel to get exciting though.
Here is an updated look at the OIH etf. It clearly has broken down, but may retrace back to the breakdown area or the down trendline.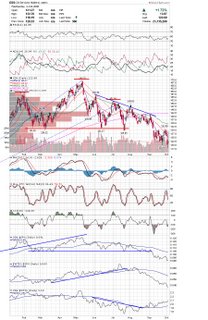
There couldn't be more bad news coming out on VLO and the stock refused to go down today. Todays move reversed all of yesterdays move and this may be a small reverse head and shoulders here. The blue line is the neckline.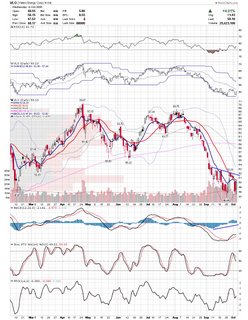
BDCO always seems to catch a bid when Oil rises. If oil the commodity makes a move then I think BDCO may take off. It is very close to support here.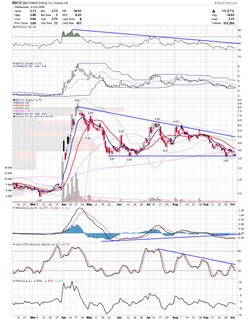
OXPS is trading a flag and formed a hammer on support.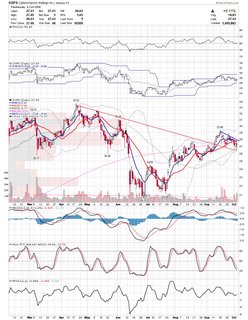
IIIN may be bouncing off the bottom of this huge triangle.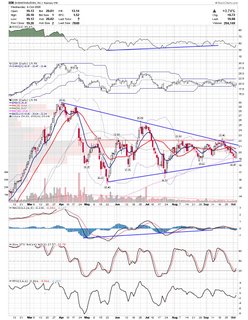 I've noticed an interesting phenomenom with how efficient the markets are at weeding out weak holders. The typical move after a hammer is to buy on the next high. But I've noticed that lately, a few bars later, there is a new lower low under the hammer. Then a few bars later, there is another hammer, but with volume. This is usually the hammer to trade off. Here are a couple of charts with examples.
SLW actually had three hammers on support and may be bottoming here at the lower bollinger band.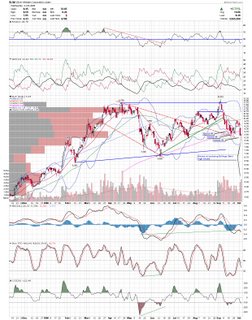
Here is GG. Although the first hammer is questionable, the connotations are similar. GG may also be forming a near term bottom here.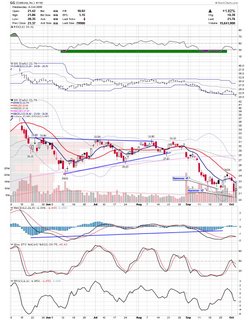
All of the commodity plays above are very risky in terms of failure rate, but the risk to reward ratio makes them viable to my tading style. Keep your own trading style and objectives in mind when considering these.
Good Luck,
DT
Subscribe to:
Post Comments (Atom)


DT, I really like your blog. I haven't gone through the entire blog but what's your preferred timeframe?
I have two styles I play primarily. I Swing Trade with average holding period of 2-5 days and I daytrade with average holding period of 4 hours. My preference is to swing trade, especially when the market is trending, and falling back on the daytrading when the markets are extended to either side. Most of what I post on this blog is geared towards swing trading. Thanks for the compliments.
DT
Hi,
Take a look at RNWK breakout today a key resistance level 11$.
AC
Very nice AC. That is a good looking chart.
DT