The markets had another low volume move higher today. This move up has been rather unimpressive, however, if it keeps inching up like this, then some bears may start covering adding fuel to the bulls cause. I still think the markets will at least retest the recent lows, before the true trend will present itself. Here are a few interesting charts I found.
ConAgra Foods, Inc. (Public, NYSE:CAG)
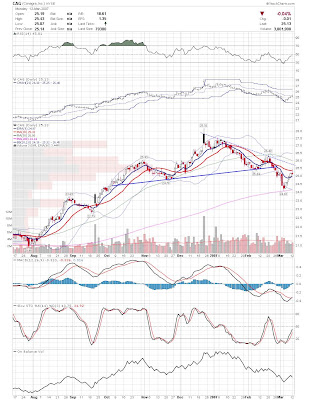
CAG broke down from a head and shoulders top and is now retracing to test the neckline as resistance. It's looking like it is stalling already and may be ready to begin the downtrend.
Continental Airlines, Inc. (Public, NYSE:CAL)
CAL is another head and shoulders top, however, I think it may retrace higher before resuming the downtrend. With oil dropping today, airlines started to get a little bounce, and if oil continues to retrace a little of the recent move higher then airlines are the direct beneficiaries. I am tracking CAL for a move to the 20sma and then possibly a failure to overcome it.
My buddy Tuff had another excellent post at his new blog, regulationFD. He posted a lot of information on ASEI and asked that I give a technical take. If you haven't checked out his blog, please do so. Tuff is one of the best at uncovering smallcap gems. He was the smart money getting in very early in several stocks such as BOOM, HURC, FTK, NGPS, DXPE, BTJ, IIIN, etc.
I'll start with the weekly chart and then move to the daily chart.
American Science & Engineering, Inc. (Public, NASDAQ:ASEI)
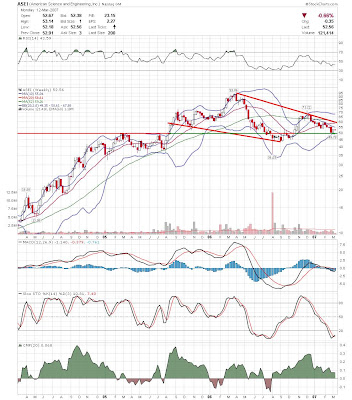
IT looks to me like ASEI is in the process of consolidating a move to all time highs. They have pulling back very orderly and might be setting the first higher low here. The fact that they are slowing down near a previous resistance point may be signifying that this line will hold as support. Stochastics is starting to move off of oversold status and MACD is in a leading divergence. This all looks pretty decent to me at this point, but a lot depends on what happens to the overall market.
Here is the daily chart which may be showing that a bottom may be in. It has retraced 61.8% of the previous leg up and tested the trendline that was resistance as it traded in a falling wedge type base. It looks like it may move a little lower in the coming days and retest that area as support, but if it stops there and then turns back up, then it may offer a great risk reward setup.
Good Luck,
Joey
Subscribe to:
Post Comments (Atom)


Re ASEI, This can be a volatile puppy; consider your trade size and current market conditions carefully. Better to scale in and out IMHO.
You are right MT, ASEI can be quite volatile. The ATR is like $1.50 with large spreads too. It is definitely not a daytrading stock.
Joey