Stock Chart Analysis NKE
NIKE, Inc. (Public, NYSE:NKE)
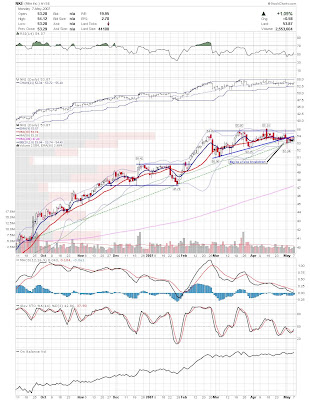
NKE has been threatening to roll over the past couple of weeks, but is somehow still sitting atop it's 50 day moving average. It has pulled back to a longer term rising trend line while falling out of a short term triangle. It appears that this has the potential to be a false breakdown which could lead to a rapid move in the opposite way. False breakdowns have good potential when caught, because a large group of fooled traders have to join the breakout buyers in pushing the stock higher.
Good Trading,
Joey
Subscribe to:
Post Comments (Atom)


0 comments
Post a Comment