I tried something new tonight in my stock scans for weekly swing setups. I downloaded the entire IBD 100 and looked at them in stockcharts candle glance. Then I jotted down what looked semi interesting. Then I looked at each one individually. These are the 5 I found the most interesting. There were a lot that looked tempting but may be overextended. I tried to look for stocks that had decent entries. There might be a possible clue here for the markets this week as well. GRP,HAL and INT are tied into oil in one way or another.
ITRI broke the downtrend and is in the process of testing the pivot point. Looks like possible resistance at Prior pivot high.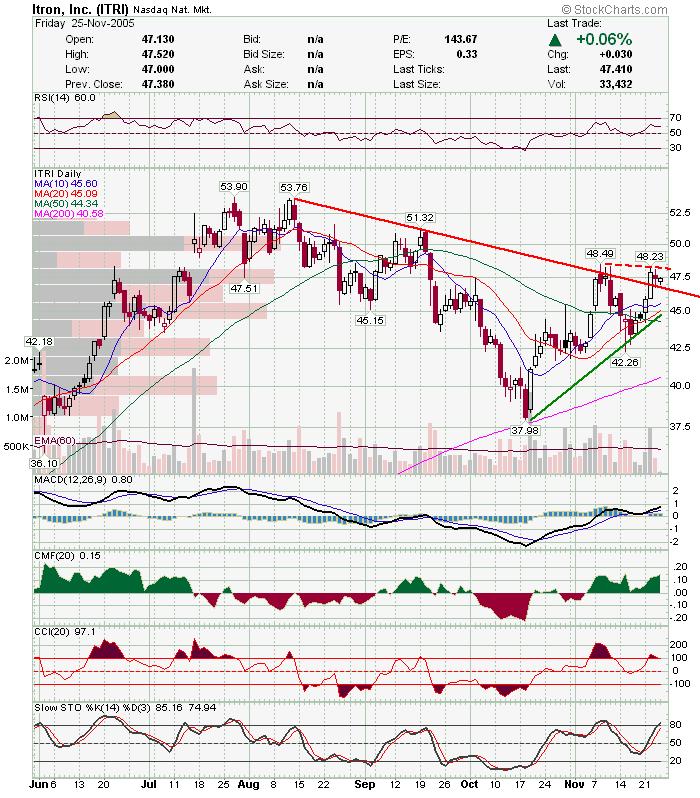 INT: This was probably my least favorite chart, but technically it is over the prior resistance line. A higher high would probably mean a retest of the high from a few days ago.
 HAL: I've never been a fan of HAL, but this chart looks pretty good. Not sure if it will pull back here, but it broke out of a double bottom base, and is testing the pivot point. If this follows through, the target is near a $10 move.
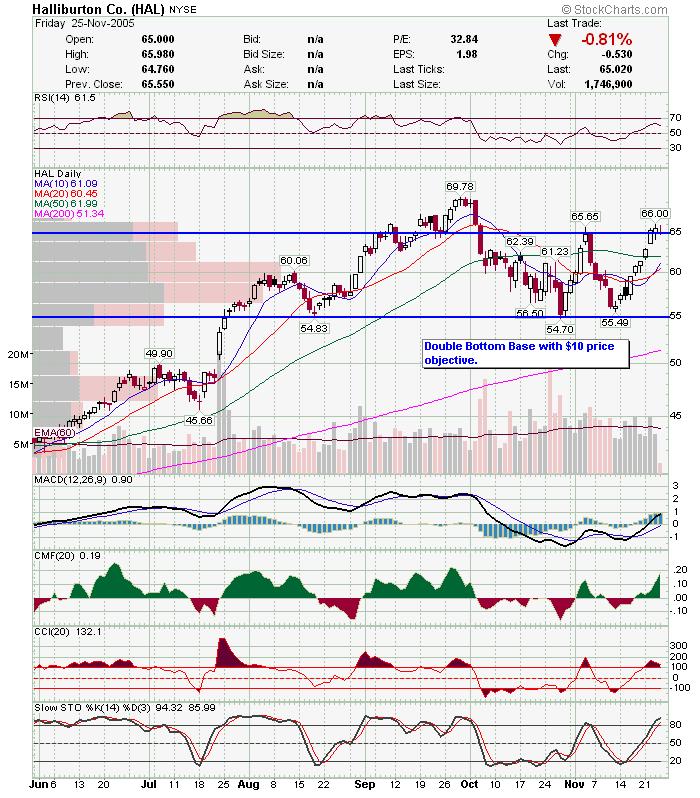
GRP: Nice contracting triangle here. If this makes a higher high tomorrow it would probably be the break of the downtrend line. MOT: At first glance this looks like it wants to retest the cup and handle pivot point, but last candle shows the bears couldn't bring it lower.
Subscribe to:
Post Comments (Atom)


0 comments
Post a Comment