First Chart: Nasdaq surprisingly gapped over resistance and closed. It started to reverse but held up. It may come back to test resistance and close gap, but I would think this to be the signal some were waiting for to confirm the "santa clause" rally and tech's leadership.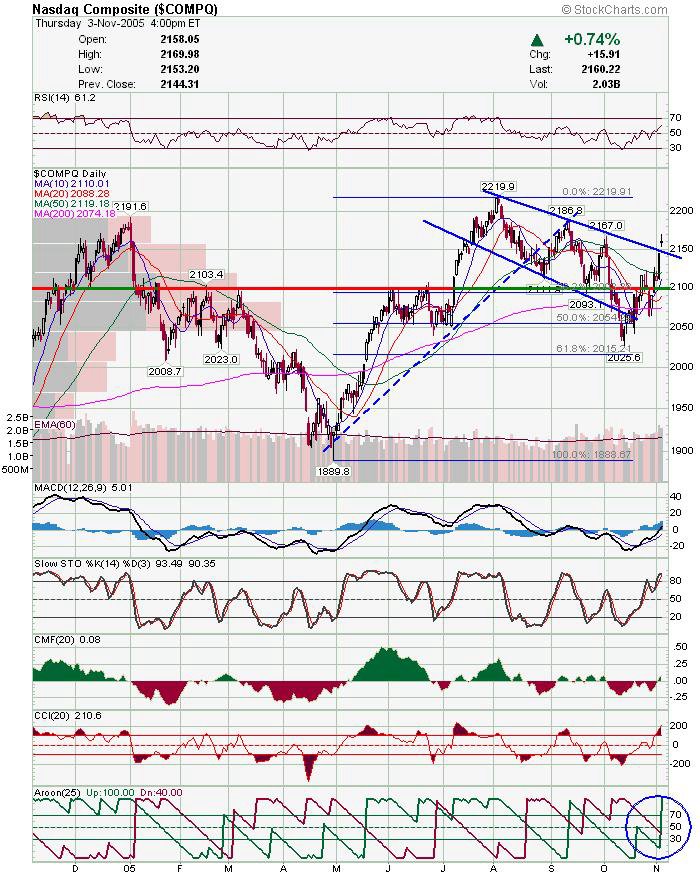 NGAS: I noticed this chart last night, and completely forgot about it today while trading QCOM and VPHM. My bad. Still looks good though.
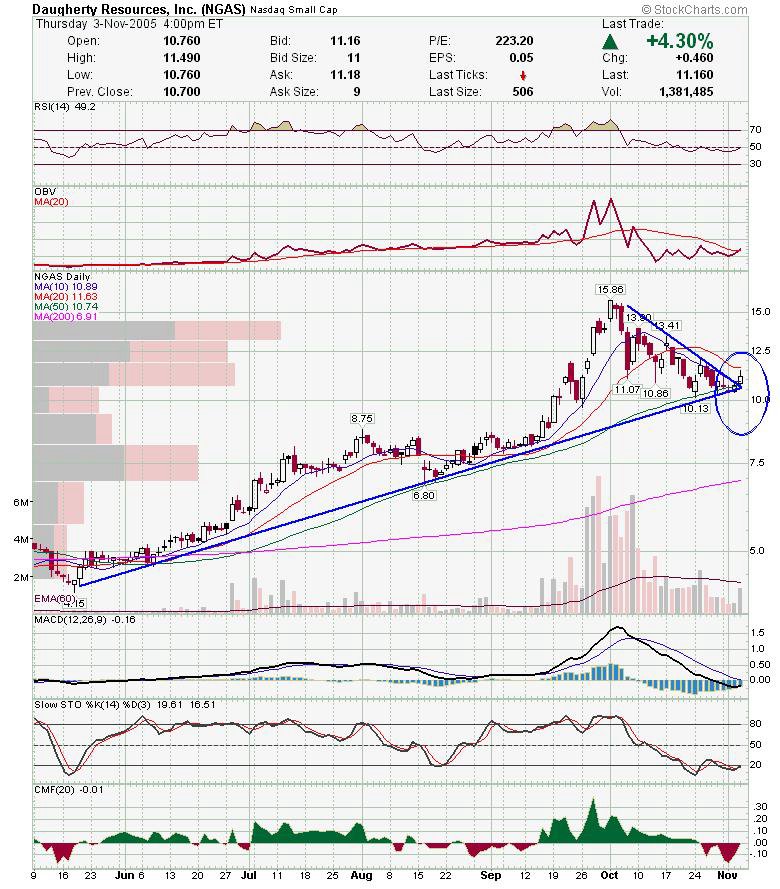 HOM: This looks like one that I can buy and stash away. I had an order at 5.80 today didn't get filled. I will probably buy tomorrow and hold as long as the trend line stay's intact.
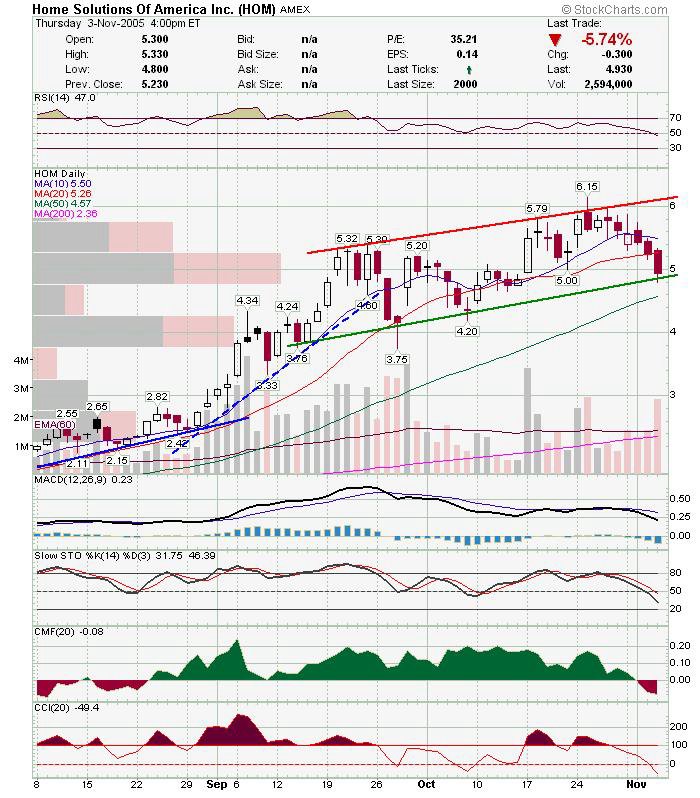 AIZ: This stock has been a slow and boring mover, but has steadily increased. Today, earnings kick started it, and it Rocketed through the existing trading channel. You know the old saying, broken resistance, becomes support.
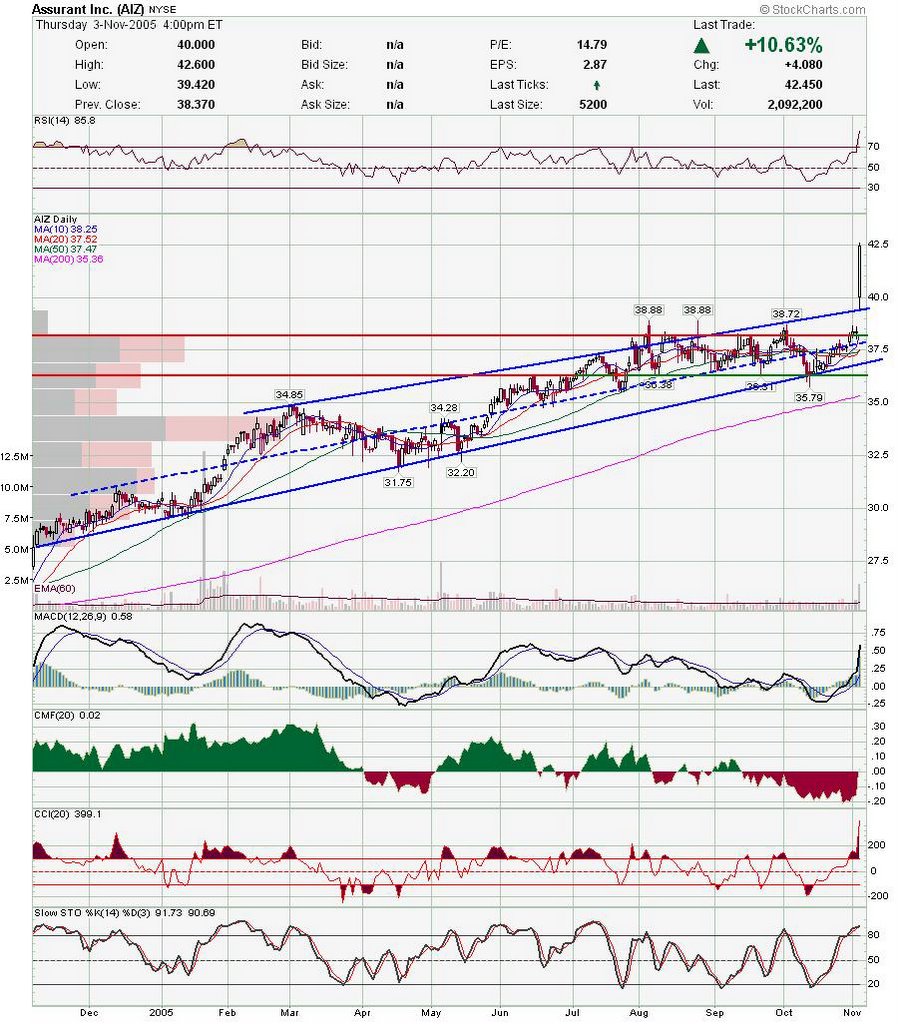
Subscribe to:
Post Comments (Atom)


Hey downtowntrader. Nice blog. Check out my site day trading future. It's got lots of info on day trading future.
Hey downtowntrader. Nice blog. Check out my site emini futures. It's got lots of info on emini futures.
Hey downtowntrader. Nice blog. Check out my site emini trading method. It's got lots of info on emini trading method.