This is in reference to the boom post below.
Boom tracks the xlb etf fairly well. The xlb looks like it may get a bounce at the 50 day sma (see chart below).
This is a boom chart with the xlb as an overlay.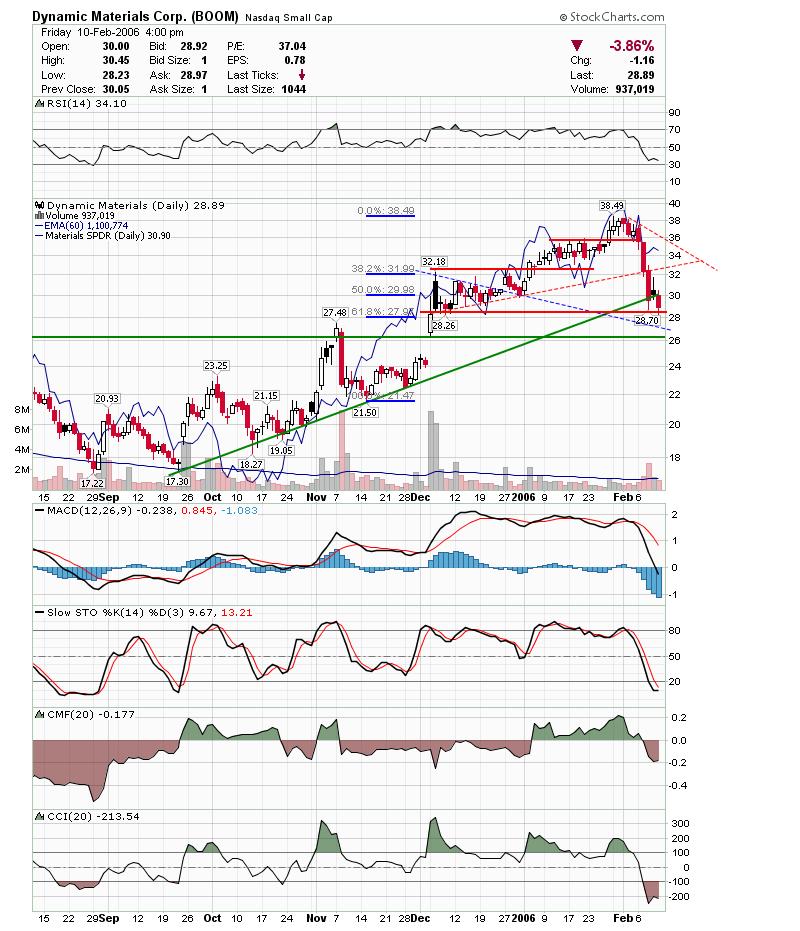 Here is the xlb daily chart.
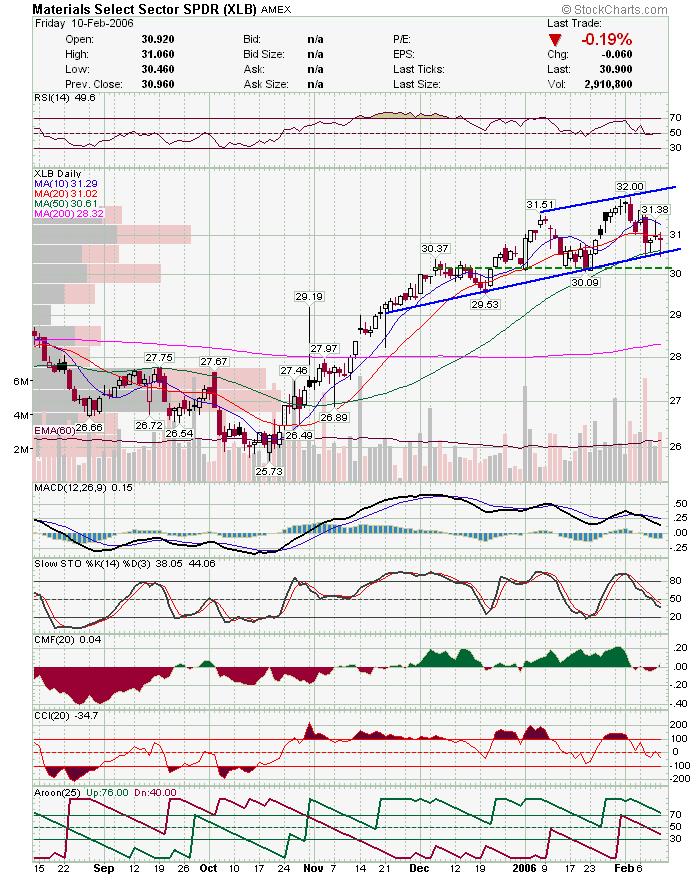 If xlb bounces watch for basic materials stocks to possibly get a lift. Keep an eye on ERS as well for a basic materials play.
Subscribe to:
Post Comments (Atom)


0 comments
Post a Comment