In reviewing the indices this weekend, they actually looked better then I expected. Small caps in particular look decent, although they are right at upper resistance. I have reduced my portfolio to about 50% long and I am sitting on cash waiting for a move to either side while daytrading almost exclusively. In looking at some ETF's, I found two sectors in particular that look poised to move if we get a rally. Banks and Retails. Here are the ETF's for both.
Bank holders broke out on strong volume and seems like it will hold support.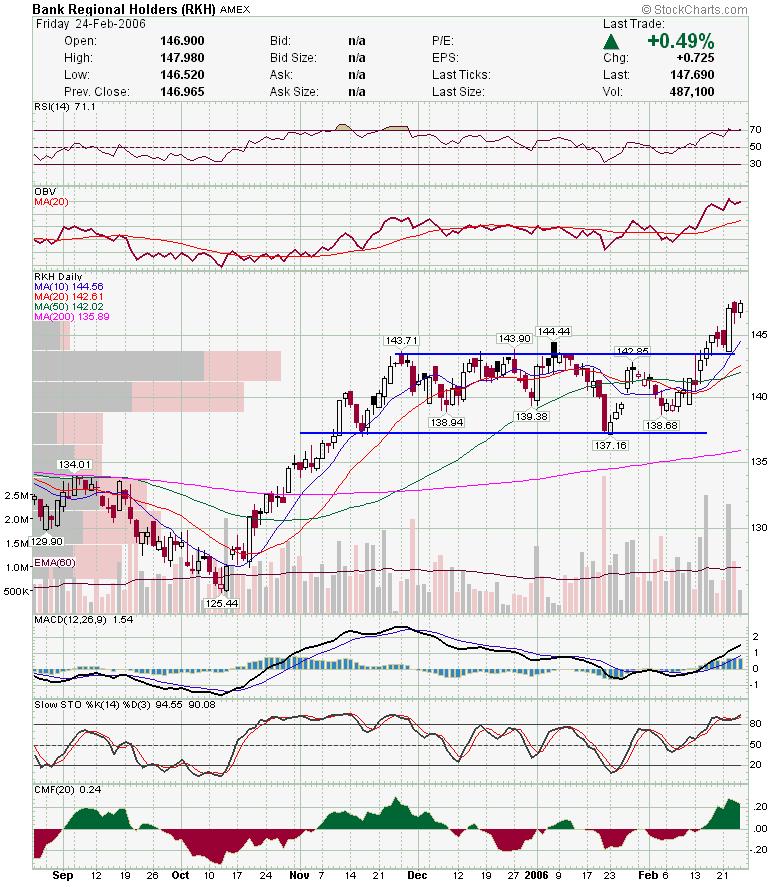 RTH pulled back and had a higher volume doji at the trendline and a fib retrace area. I note that the doji was on higher volume. Sometime high volume on a doji shows a turn, especially when it comes at a trendline or moving average, because it shows that one side tried to make a strong push in a direction and only ended up in a stalemate.
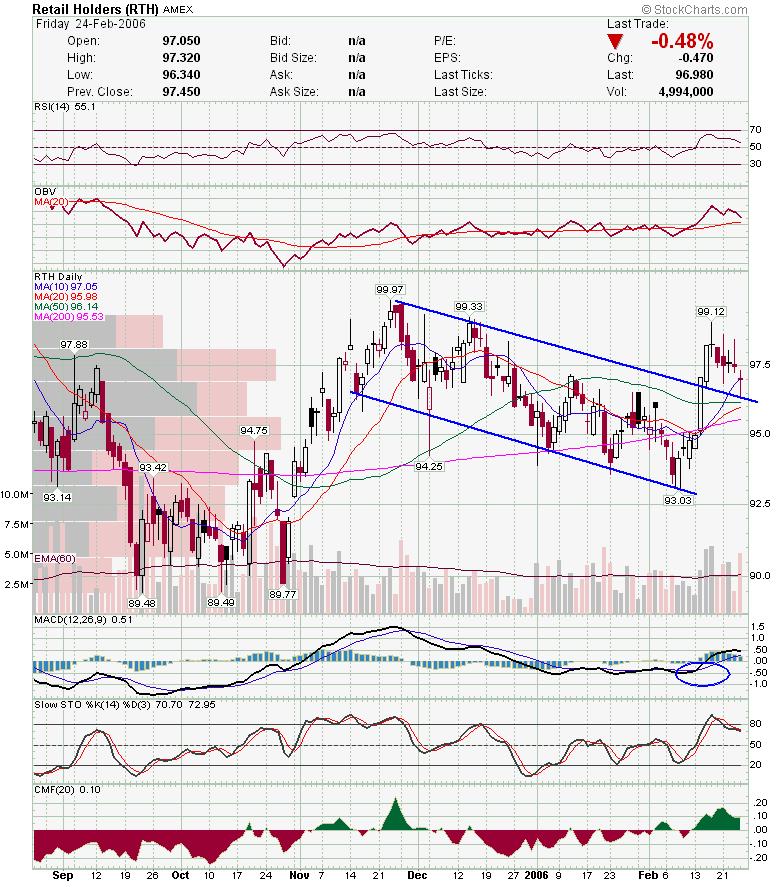 Nice move for WBIC here as it cleared the upper trendline.
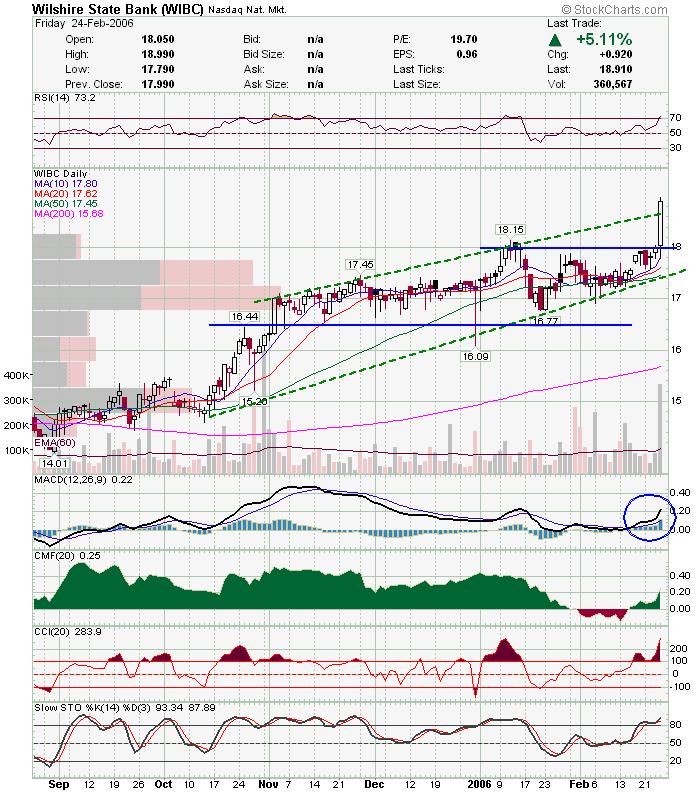 JPM looks really good as it moves to a 52 week high.
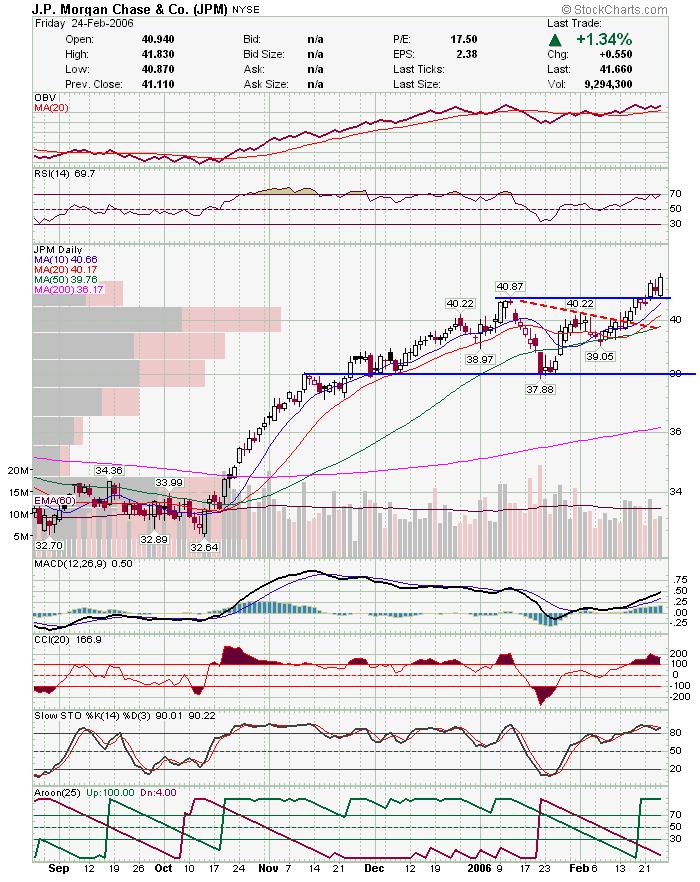 CHS is testing breakout support and formed a doji at the trendline. Wach for a higher high.
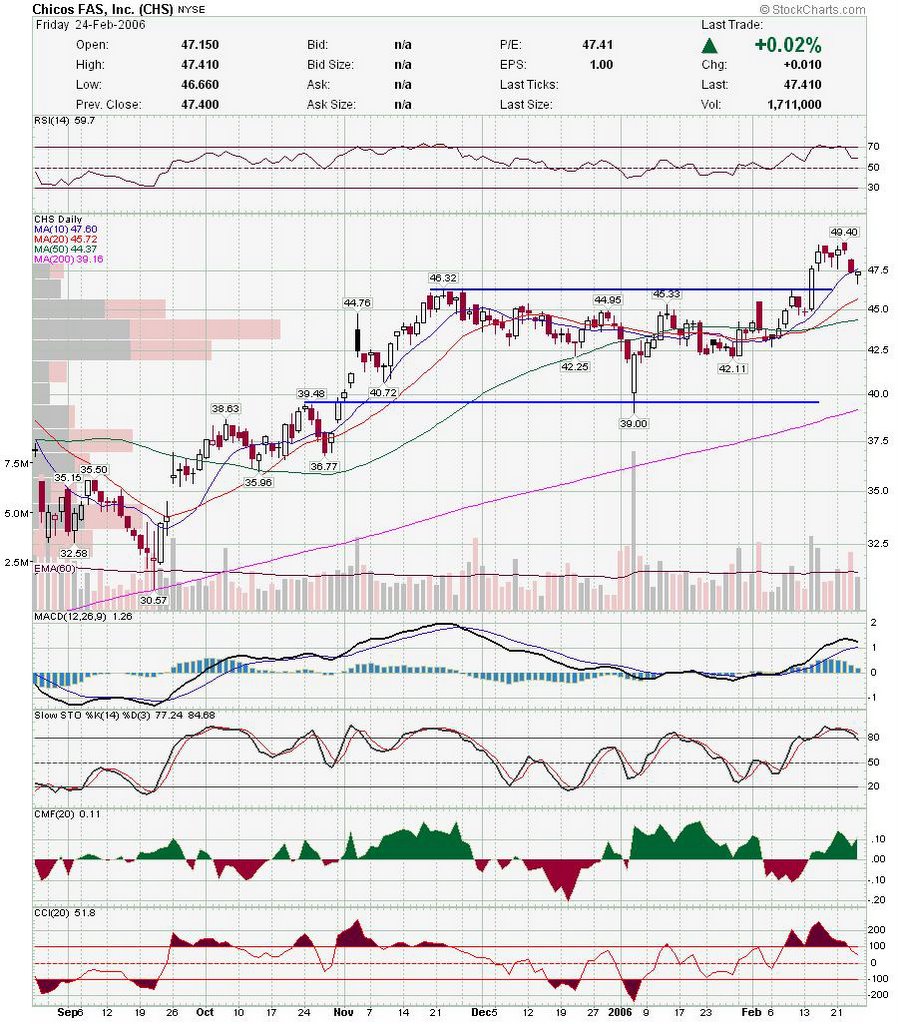 PNRA has formed a nice cup and handle but needs to clear pivot point. Risk takers can buy on break of handle resistance, but need to trade carefully.
 JCP is another retailer that has tested breakout support.
 COST chart reminds me of SBUX chart, although with a major difference. SBUX breakout was on huge volume, while COST initial breakout was merely a little above average volume.
 BBD looks very good as it test two trendlines.
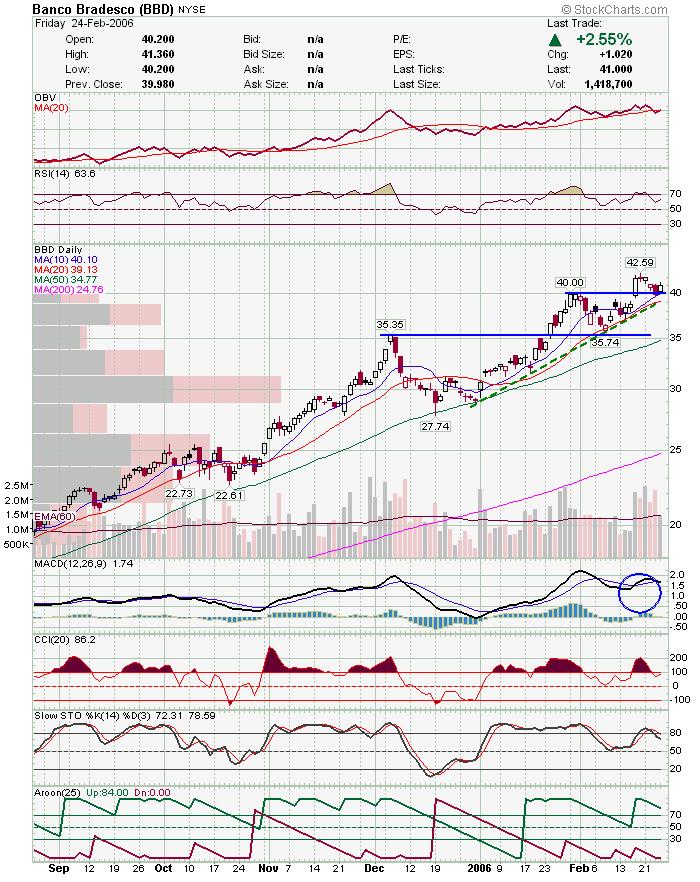 After looking at longer term OIH chart, I'm not too crazy about the near term prospects in this sector. It looks like the sector is in for a little more of a correction. However, CLB has shown some very good strength here.
 CONN looks like it is on the verge of falling apart. I would wait for a break of mid 36's.
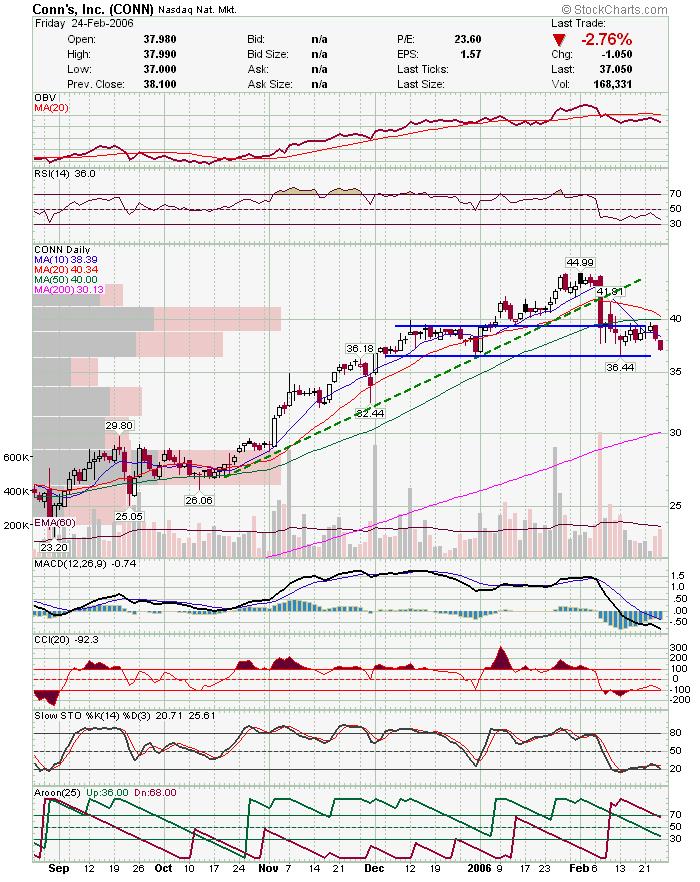 I mentioned on a couple of occasions that I thought FFIV looked like it was gonna move. They broke out here on good volume.
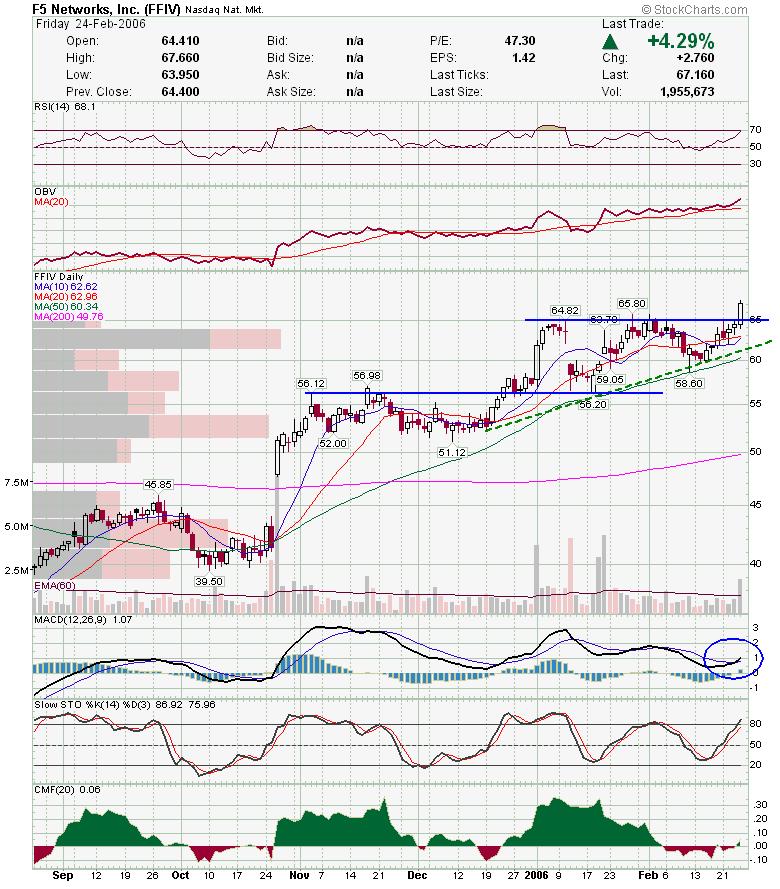 MFLX looks like it will bounce off the trendline here.
 OXPS is another one I have been highlighting frequently lately.
 Looks like a bounce off bottom of channel for ICE.
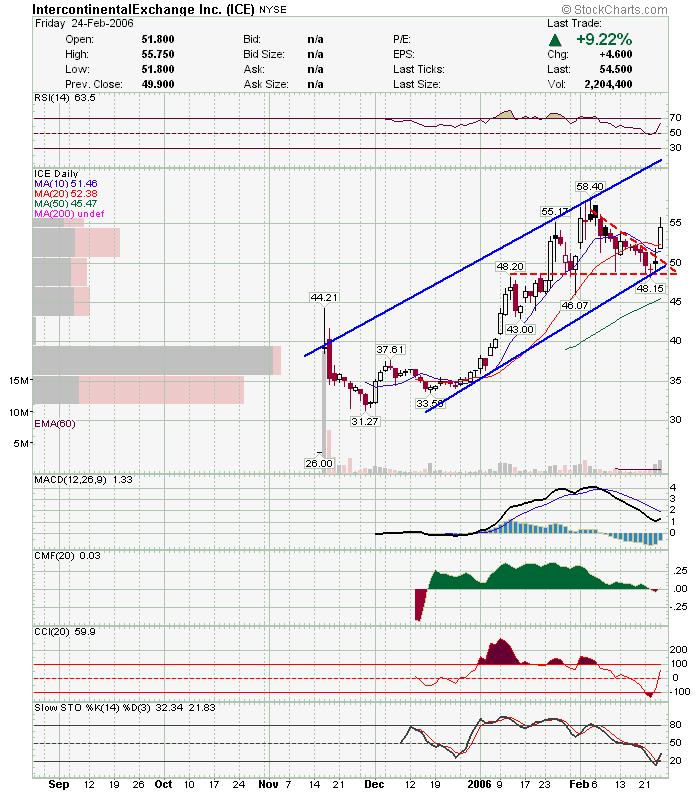 A reader had asked for a DESC chart on 2/9. I drew this chart saying I expected a trip to bottom of triangle, but to watch middle trendline. Look how nice it held the middle zone and then moved higher on strong volume. Still needs to clear upper resistance, but this is a good example of mid trendline support.
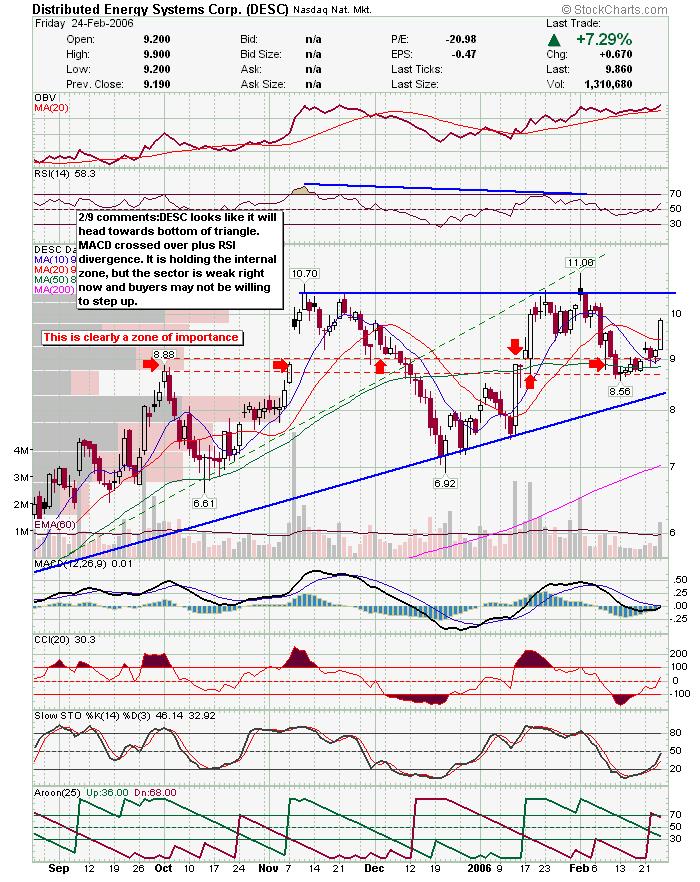
Good Luck,
DT
Subscribe to:
Post Comments (Atom)


0 comments
Post a Comment