I firmly believe that you should look at multiple timeframes regardless of the type of trader you are. I use 5 minute charts for day trading. 15 and 60 minute charts for daytrading and swing entries. I then use daily charts for swings and weekly charts to corroborate what I see on the daily. I then use monthly charts for most indices and commodoties to assess what stage of a trend we are in. Here is a sample of some weekly charts I keep.
I've recommended SLW on several occasions, and looking at the weekly chart it's no wonder why. It will need to correct at some point, but right now daily chart and silver index are pointing to breakout.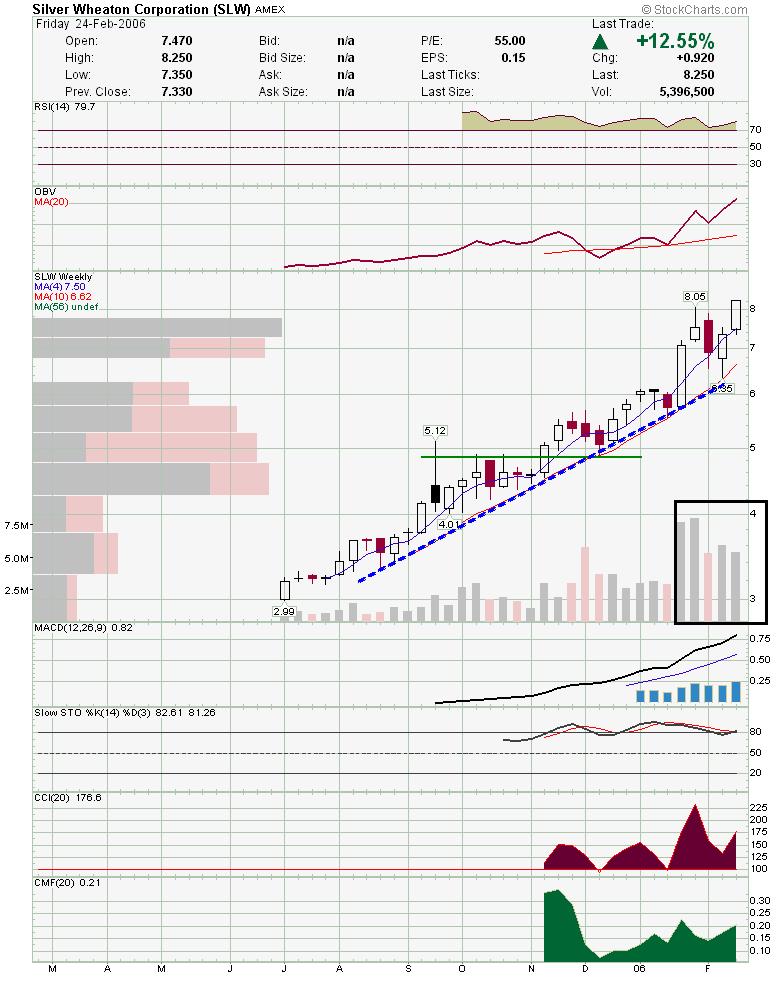 This is a pretty good exacmple where a weekly chart saved my ass. I was bottom fishing BCON but when the rising trendline was violated, it signaled that it was time to exit. When the horizontal failed, it signaled that it was time to short. This looks real ugly right now.
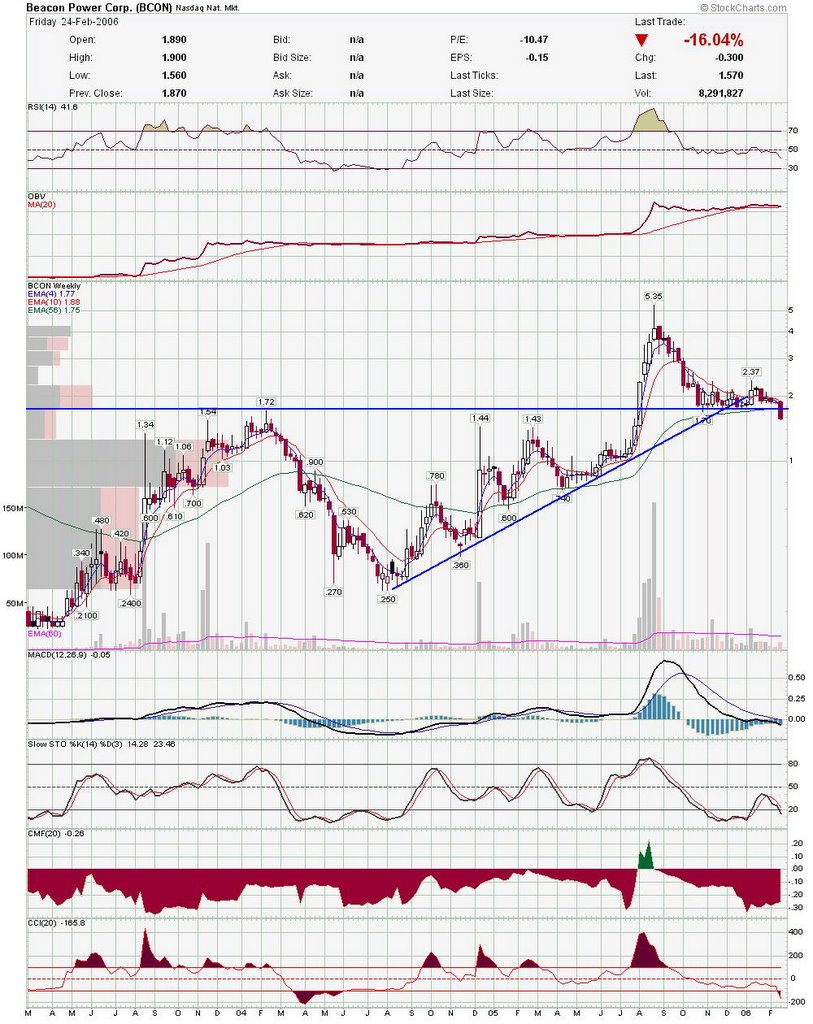 Gold stocks are looking good right now and the GG chart shows a nice increase in volume as the rend matures.
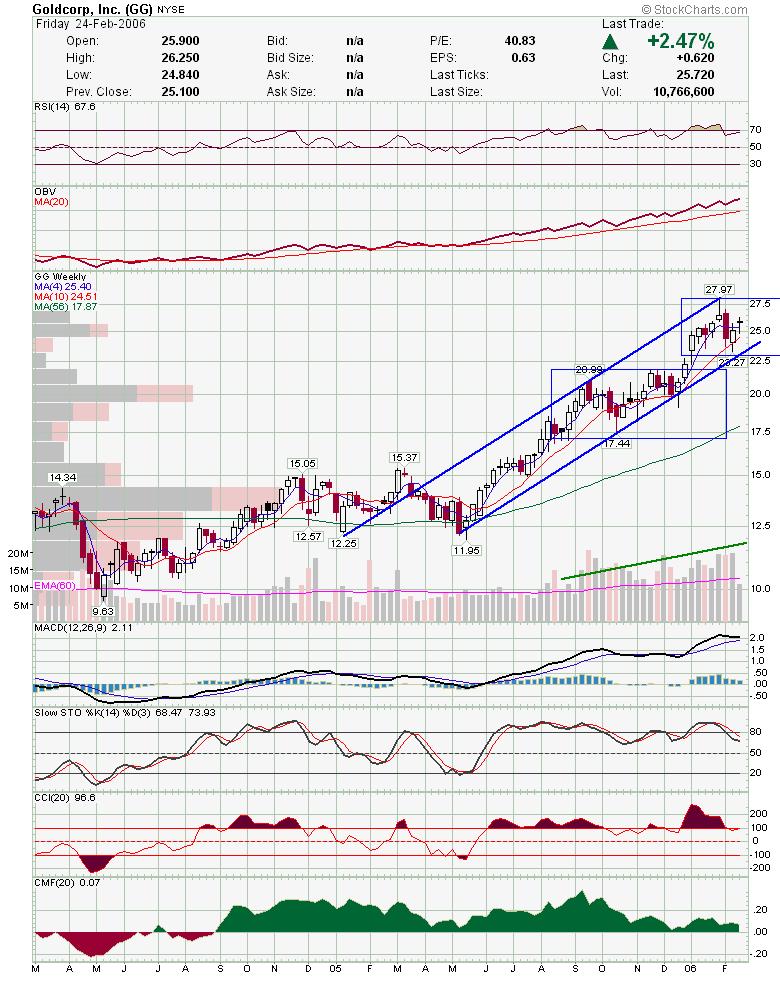 Here is an interesting one. CKCM broke support on the daily, but is still holding over the triangle on the weekly chart. You have to give priority to the longer time frame charts IMO.
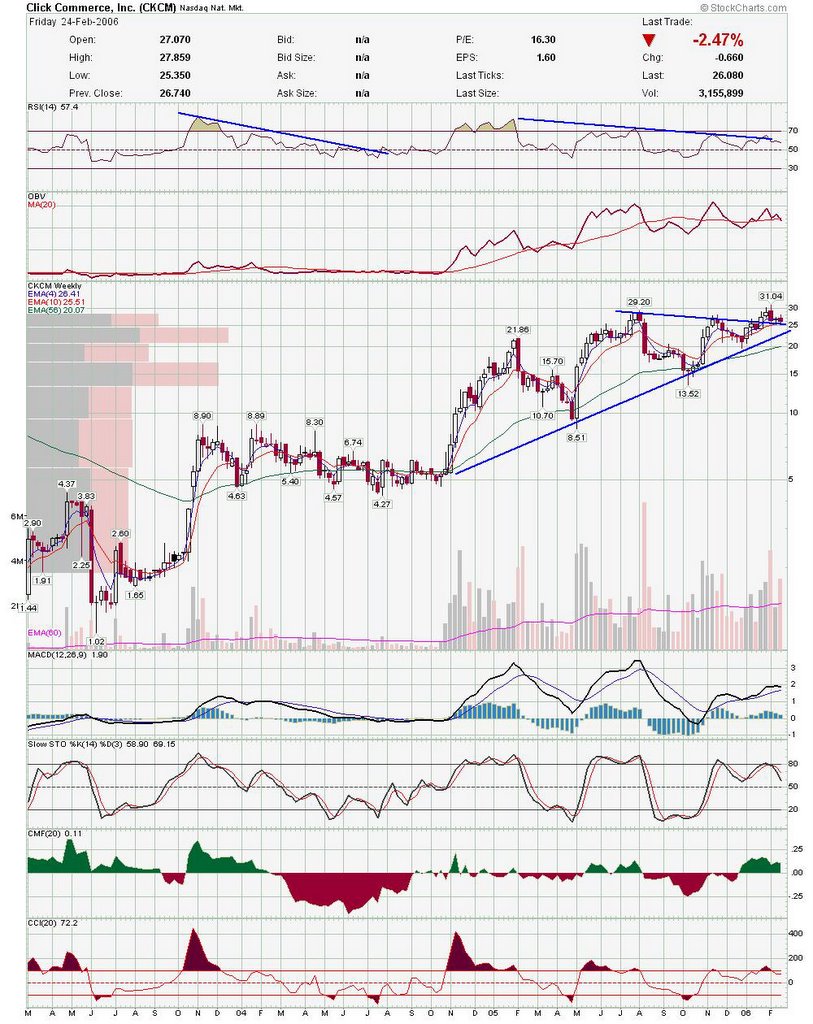
Another thing on weekly charts, I like to use the 10 week and 50 week SMA's and I pay attention to MACD and RSI mostly.
Good Trading,
DT
Subscribe to:
Post Comments (Atom)


0 comments
Post a Comment