My apologies for not getting this out sooner. I was having problems uploading earlier today, and I was swamped all afternoon. Here are some of my charts on the Nasdaq. In trying to gauge where we are we need to take a step back and look at the bigger picture.
Looking at the monthly chart, you can see that the Nasdaq has been trading sideways (or drifting up) for the past two years after the first move up from the .net crash. In the grand scheme of things we are near 4 year highs.
Here is the weekly chart for the past three years. The nasdaq has clearly broken a rising wedge which can only be classified as bullish. However, the red channel depicts a possible new trading range as the uptrend accelerates. The nasdaq is currently in the upper range of the channel and the MACD crossed down today which may be near term bearish. The Nas can drop over 100 points from here an still be in the rising channel. Here is my daily chart. This takes a closer look at the red channel in the weekly chart. There are clear channels within the overall trend, however, things get a little messy towards the end. The nasdaq was pulling back in a bullish pennant recently and broke above it, however, it is currently testing that pennant. In doing so, it may of formed a double top, or may be resolving into a triangle (shown in dotted purple). I can't predict what will happen as much as I wish I could, but market internals have been a little bearish and indicators are diverging. There is a chance we bounce between the blue and purple lines until the direction is decided.
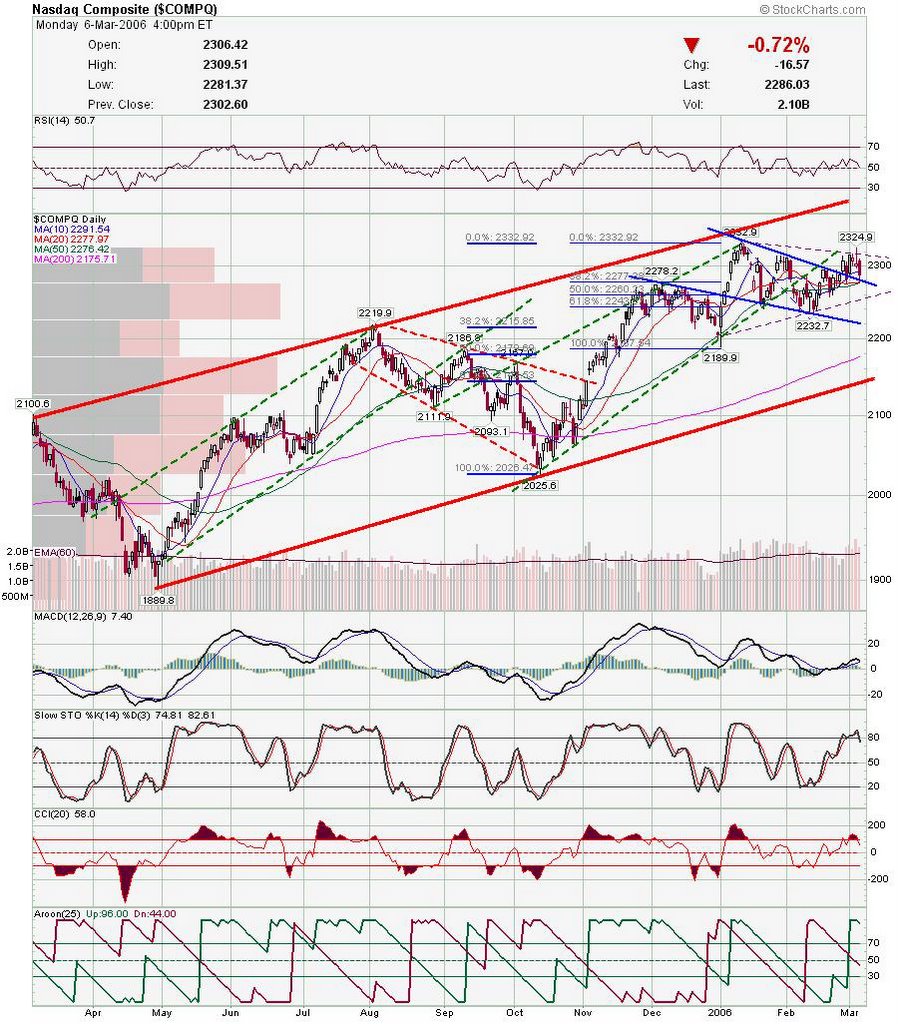 Here is the hourly chart. Rising channel is broken and Nas stopped at 200ema. Indicators are oversold, so it looks like Nas will get a technical bounce tomorrow.
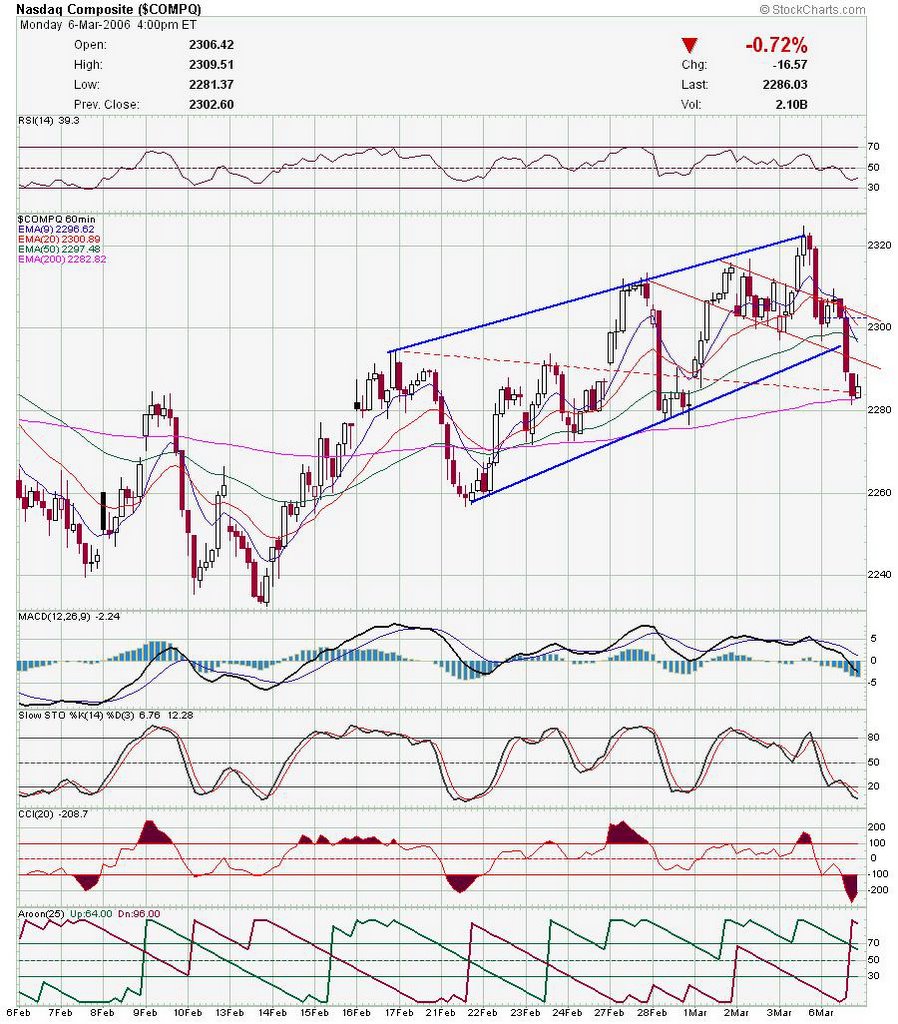 So, as Austin Powers would say "but what does it all mean?". I can't predict which way we are going, but there are clues to the near term direction. The weekly MACD crossover, signals a possible downtrend over the next few weeks. The daily is showing possible support, but plenty of resistance overhead, and the hourly is showing oversold conditions. My guess, and this is only a guess, is that we get a technical bounce soon, followed by more choppy action. I wish I could provide a more clear picture, but if it was that easy, I would be on a golf course in Hawai. Good Luck and I will post a few charts later.
DT
Subscribe to:
Post Comments (Atom)


0 comments
Post a Comment