I will be posting my nasdaq charts to give a better perspective of where we stand either later tonight or tomorrow morning. To sum it up though, we are trading above resistance on the weekly chart and wavering on the daily. I would expect more sideways action the next few days, but I think we are close to moving in one direction or the other.
One thing to mention real quick. I saw it mentioned on a board the other day that I listed so and so stock first on my list so it was one of my preferred plays. I just want to clear up, that the stocks are listed in no order whatsoever. I go through my charts and save them all into a folder as I go along. When I'm done I upload them all to the blogger in whatever order I happened to save them. It isn't until I review the blog that I decided which I am more likely to play. Also, one of the intentions of my blog is to post what is on my watchlist and how I use technical analysis to indentify high probability trades. Please keep in mind that several of my charts don't produce the action I was looking for and therefore I don't enter the position. Also, sometime I post a mix of charts so that I can have options available if the markets decide to surprise me.
Lot's of charts tonight with a good mix of both short and long.
PWEI sold off after earnings, but has come back strong and look at volume for past two days.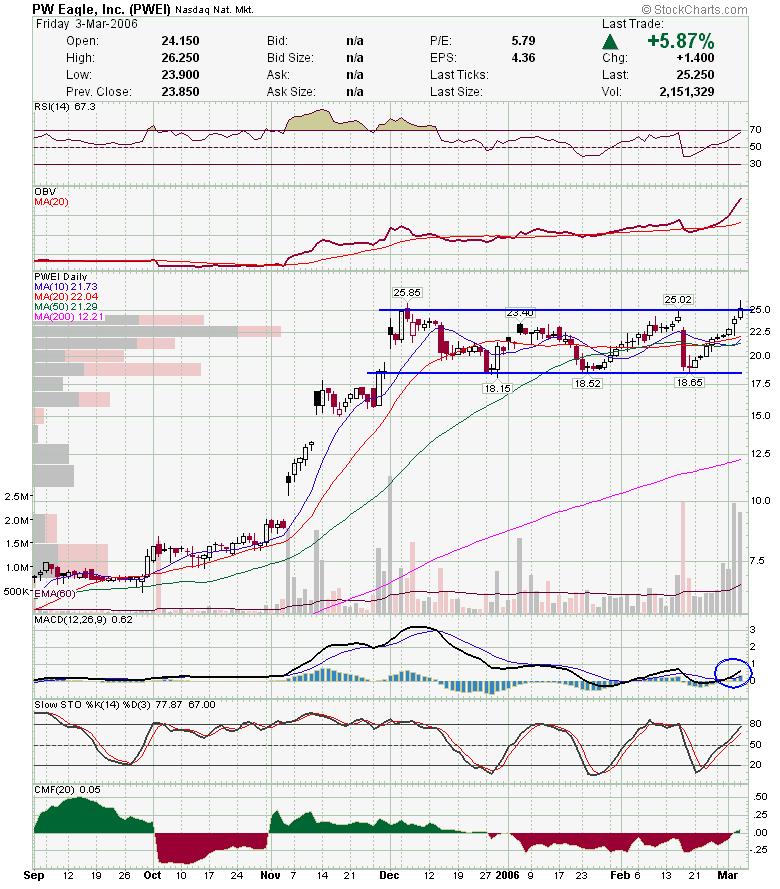 CWTR was mentioned last week and I still think it's a short. Set a tight stop as it is near it's high if you do short.
 DGIN looks like it may bounce off resistance line.
 FDG broke out of a contracting triangle and may be headed higher.
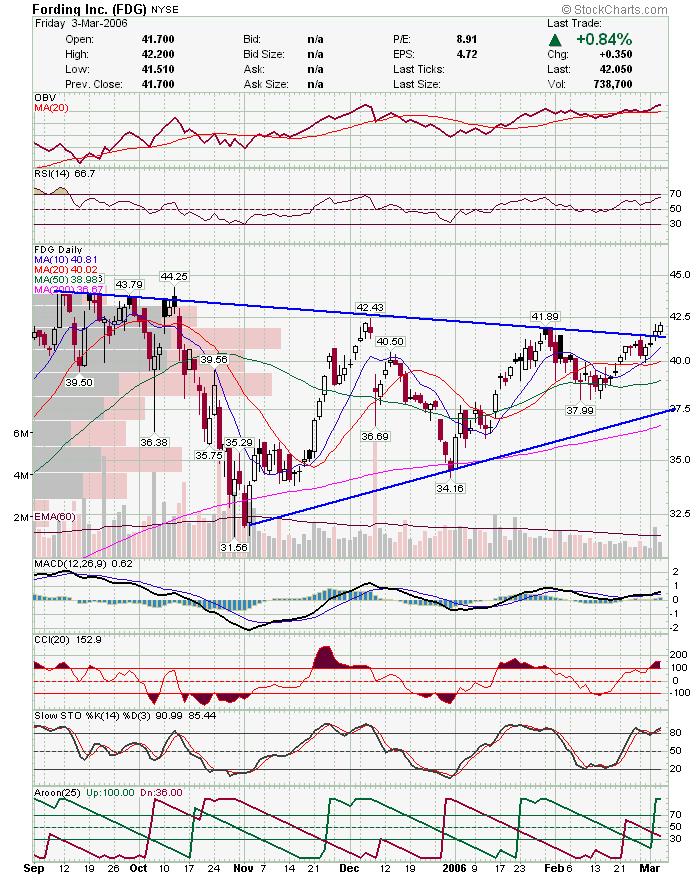 TTI looks good here and has room to run.
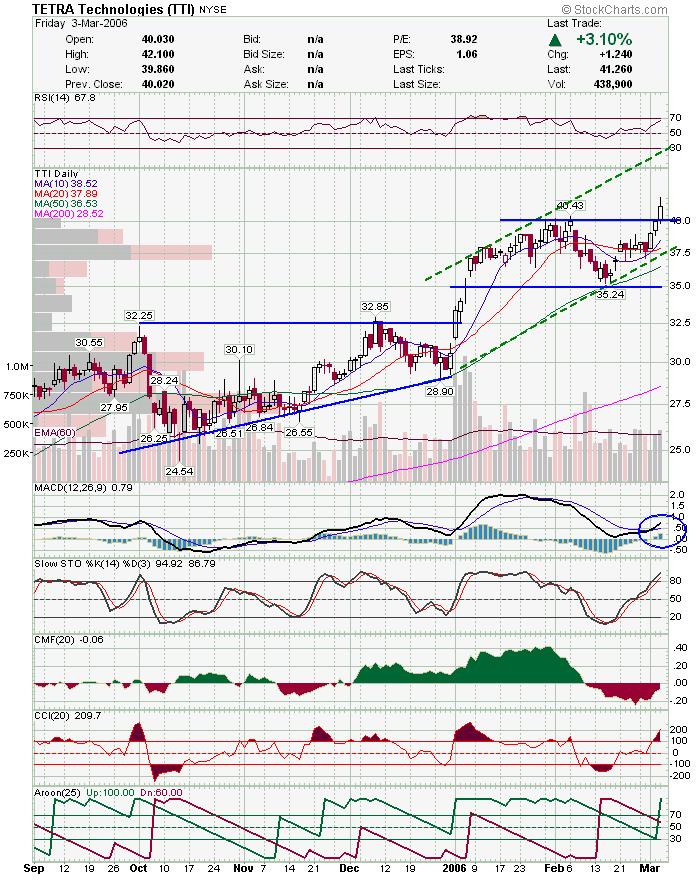 ATI looks similar to TTI and has blue skies above.
 DNDN has been fighting this downtrendline for a while. The trend is your friend.
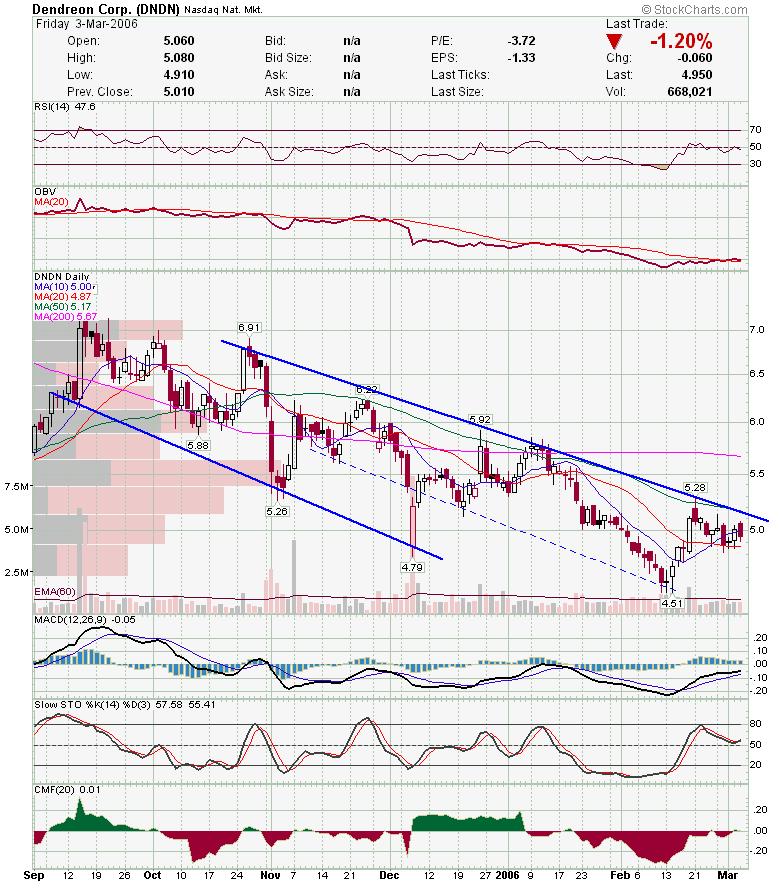 LUM may break down here.
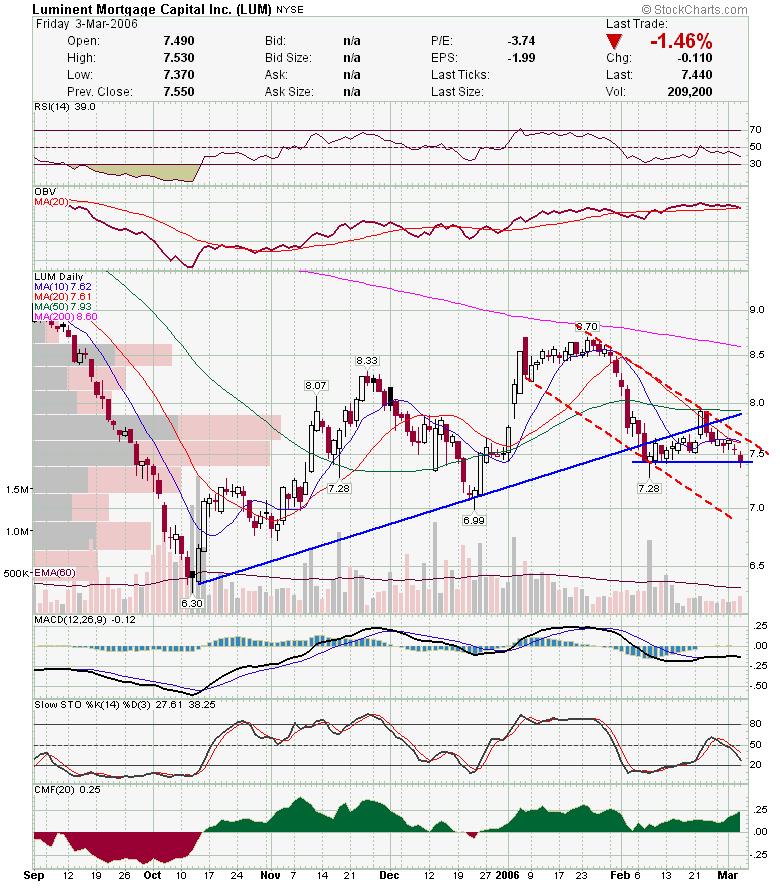 TRAD has been hugging it's channel lately. Watch for a move in either direction.
 CPWM has formed a nice ascending triangle, but looks like it will fall out of the bottom of the triangle. 200 sma is strong resistance.
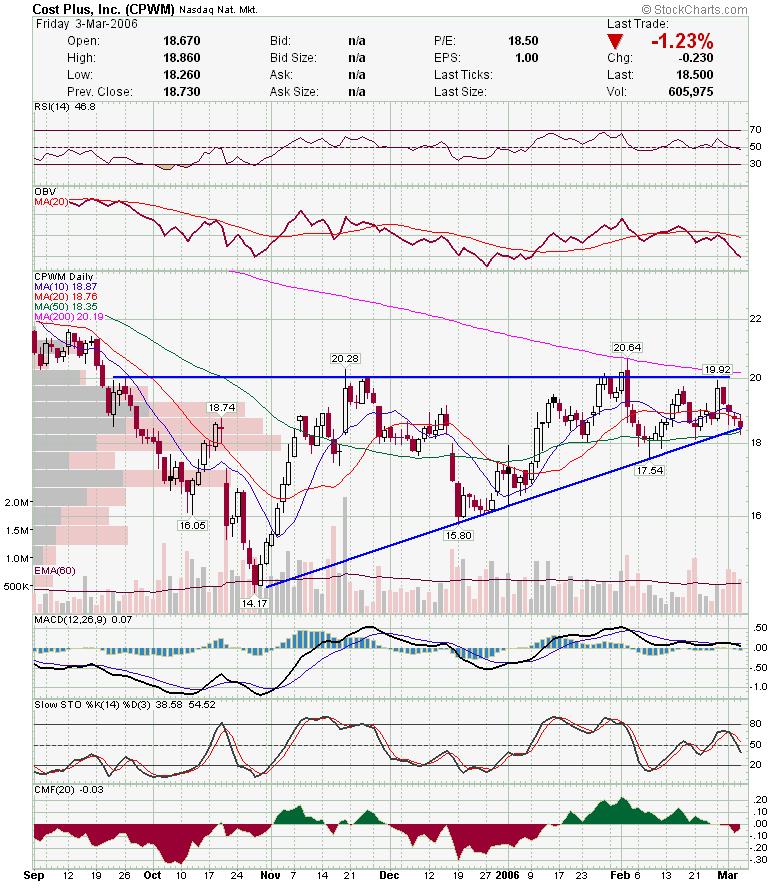 NILE is another possible short. It is up against gap resistance and had a long wick with the rest of the market Friday.
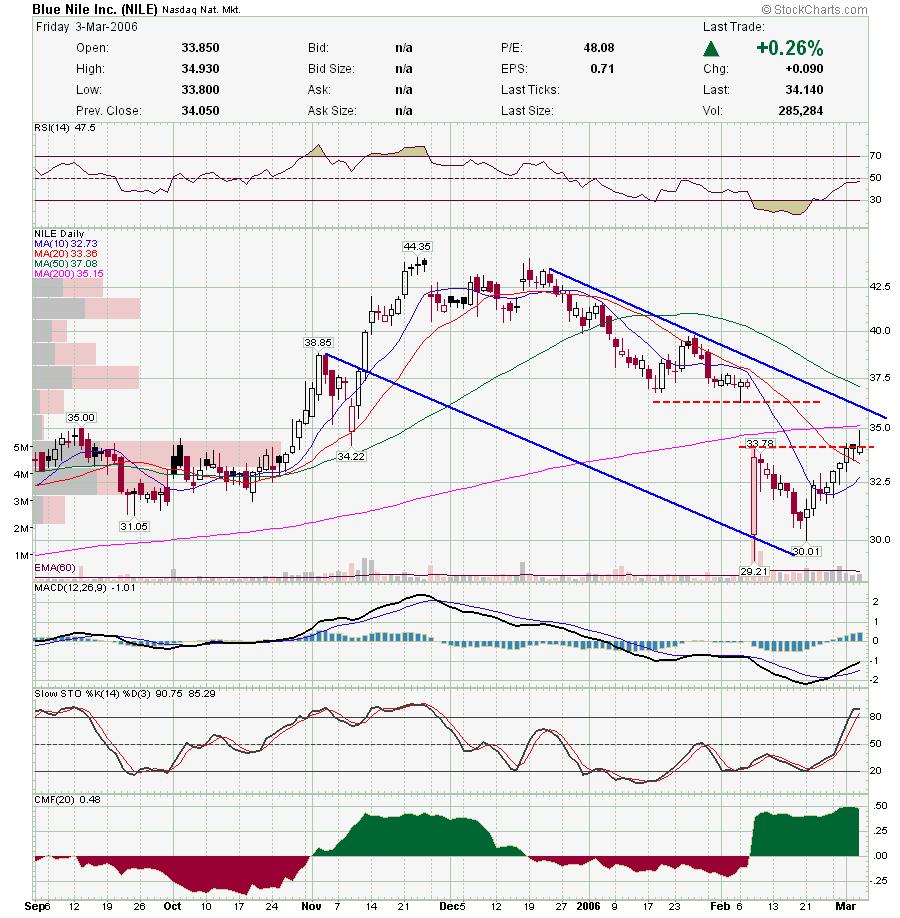 CTRN just broke a trendline so it looks like it is in trouble.
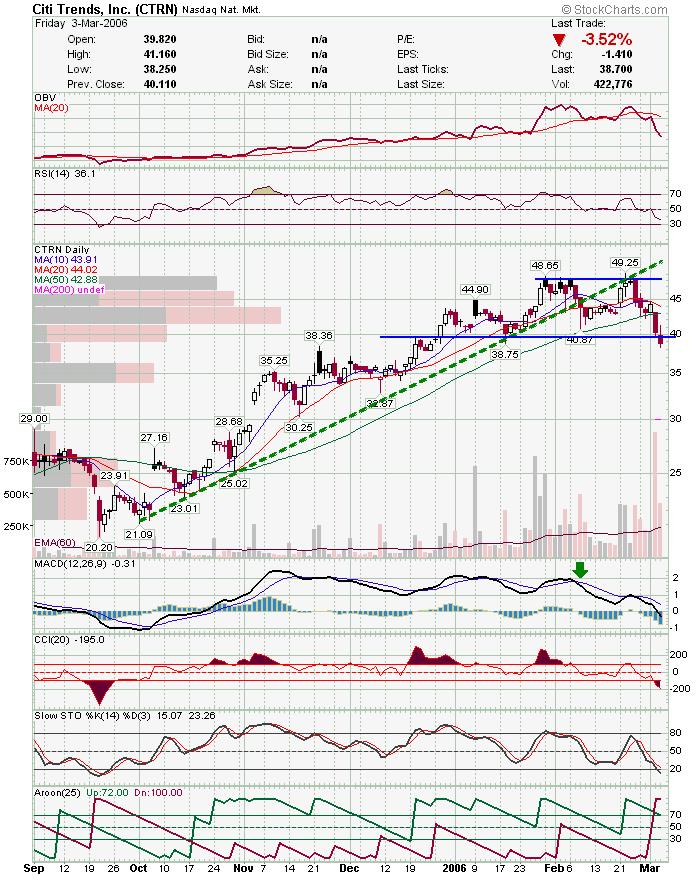 PEET has been a weak stock and looks like it may break down from the descending triangle.
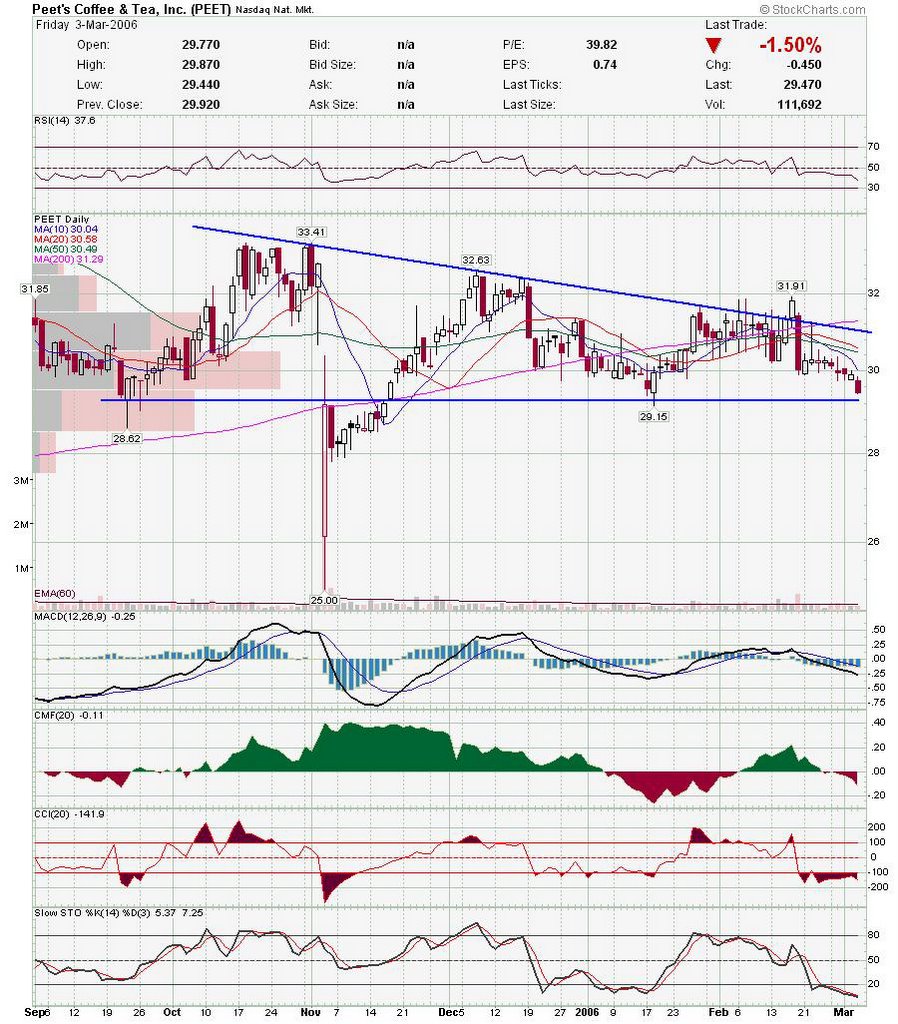 JCOM may still head to upper trendline, but it looks pretty weak here.
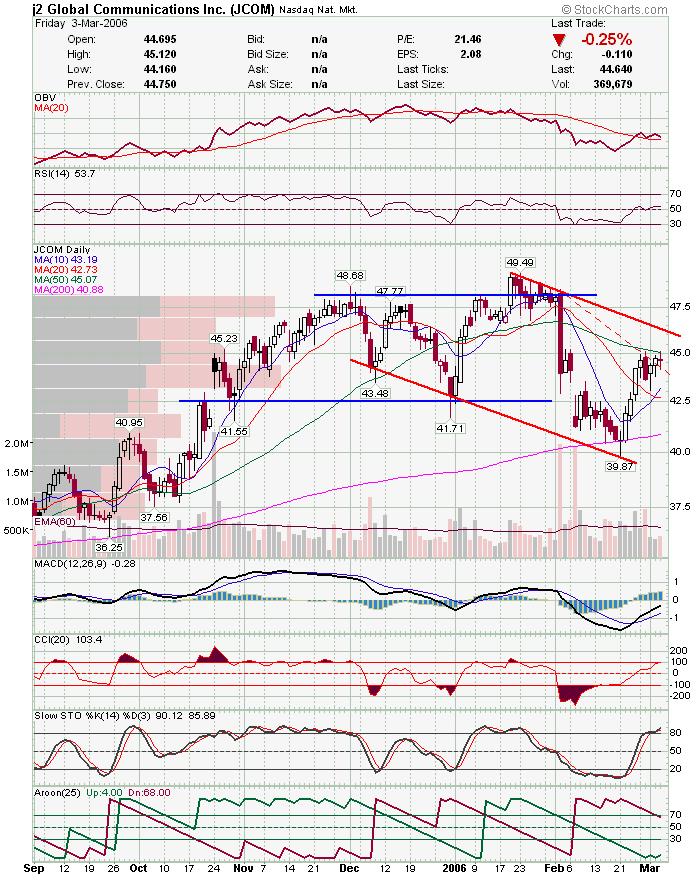 EZPW has held above the breakout area, so a move higher is more probable then a breakdown.
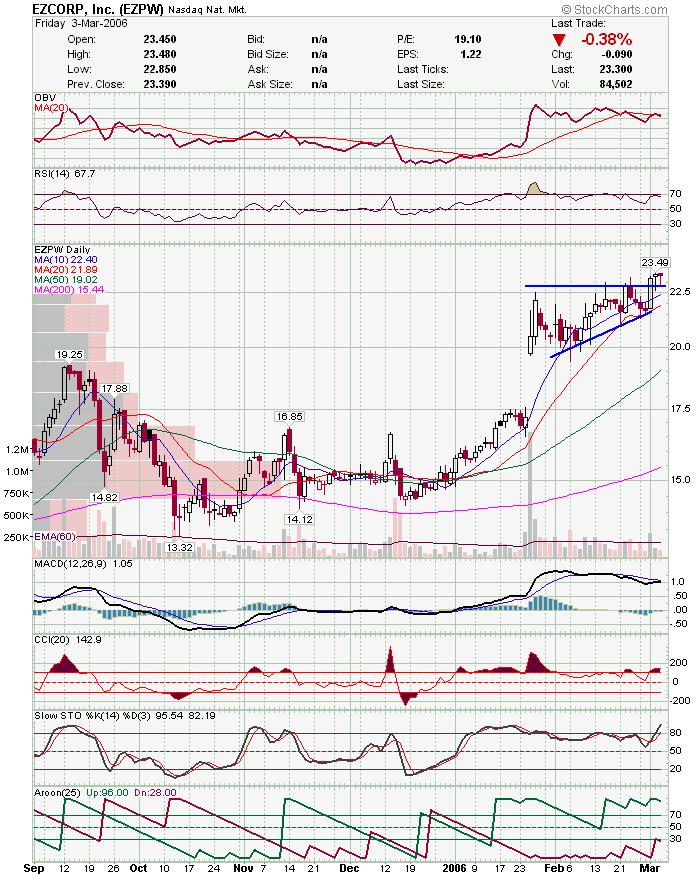 FCFS looks like it has more support then resistance here.
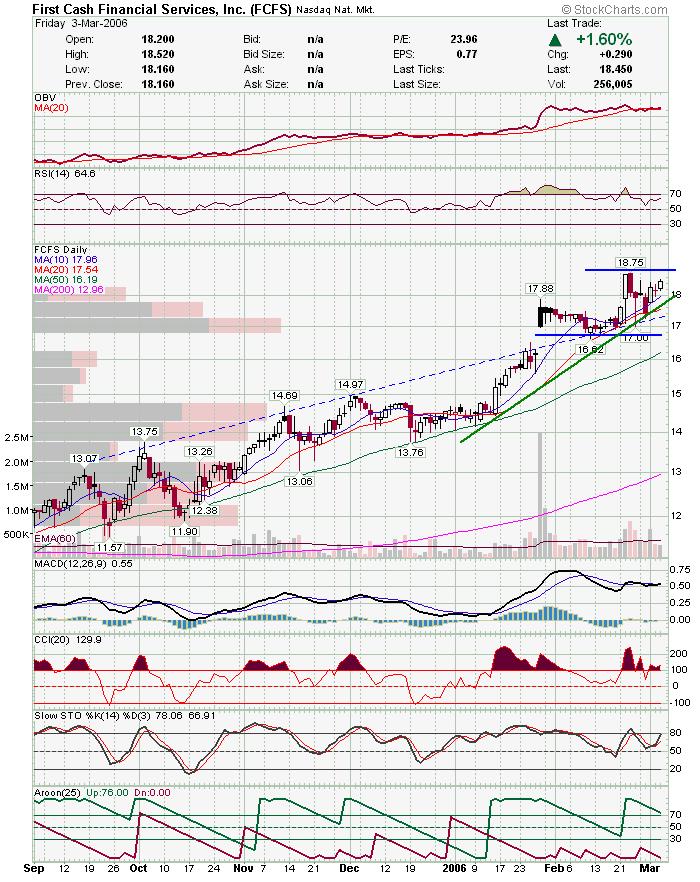 I looked at KEYS as a possible long the other day and it looks like it is broken. Watch for a lower low if you are gonna short it.
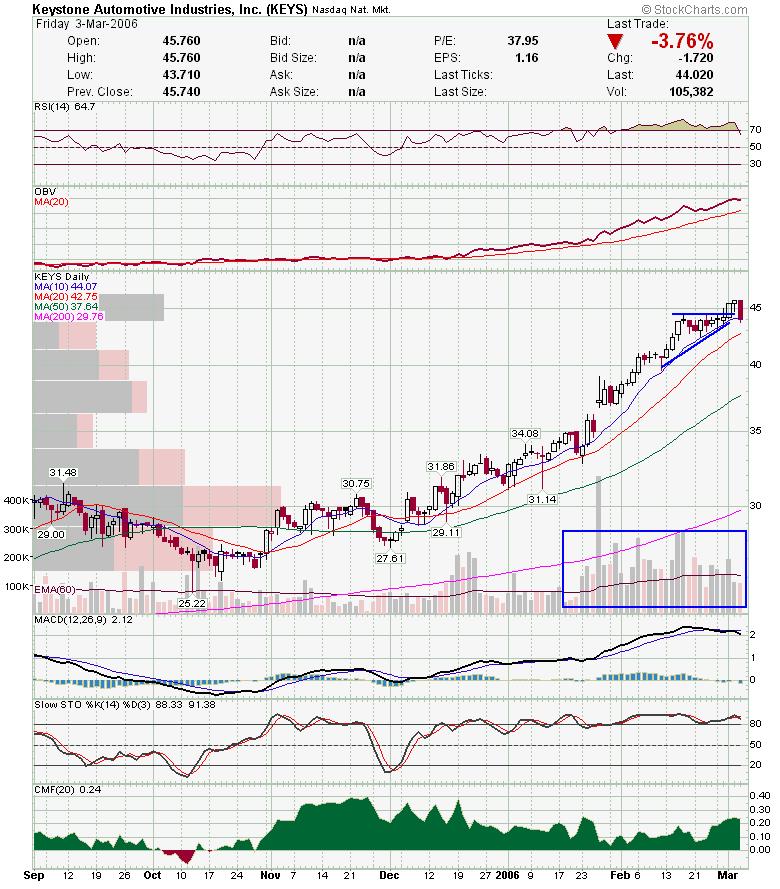 USG looks like it is gonna hold support and bounce to upper range.
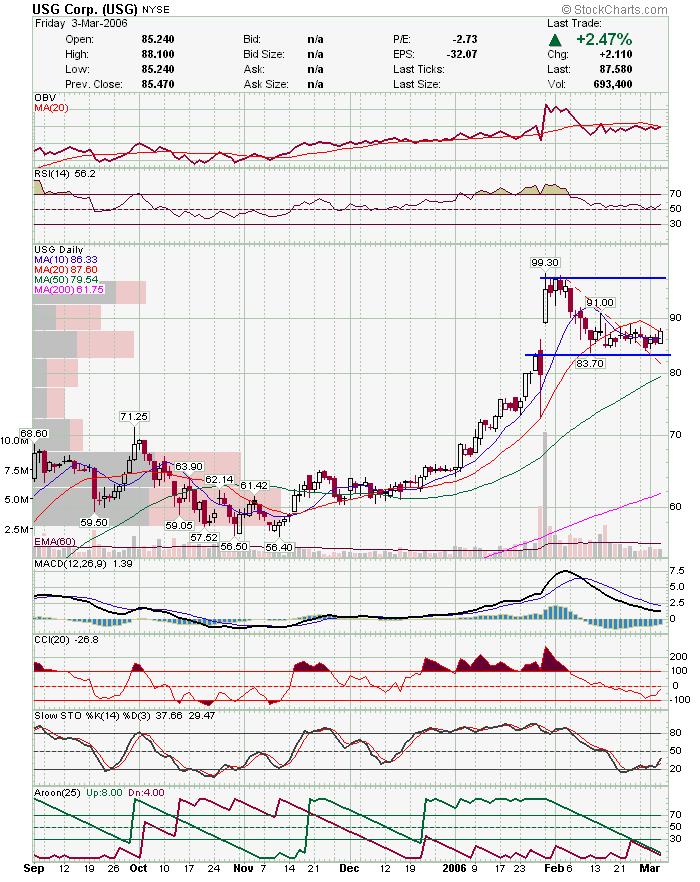 WSO is right at support, so watch to see if it bounces or breaks down.
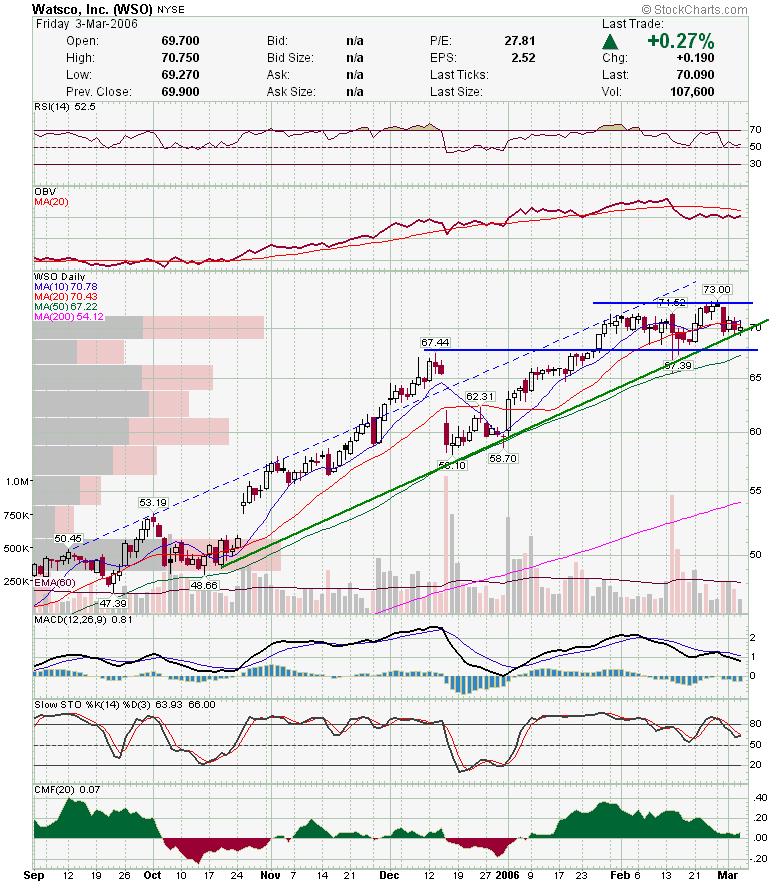 OXPS is running out of room and will probably make a move now. My guess would be higher.
 PMTI broke the downtrend but has to get over the redline before I would get excited. If it gets back into the horizontal channel, it may go back to top of range similar to CWTR's chart above.
 HOMS had a nice break of the triangle Friday.
 RATE is looking weak but has a nice clear channel defined. Also, looks like 35 is clear support.
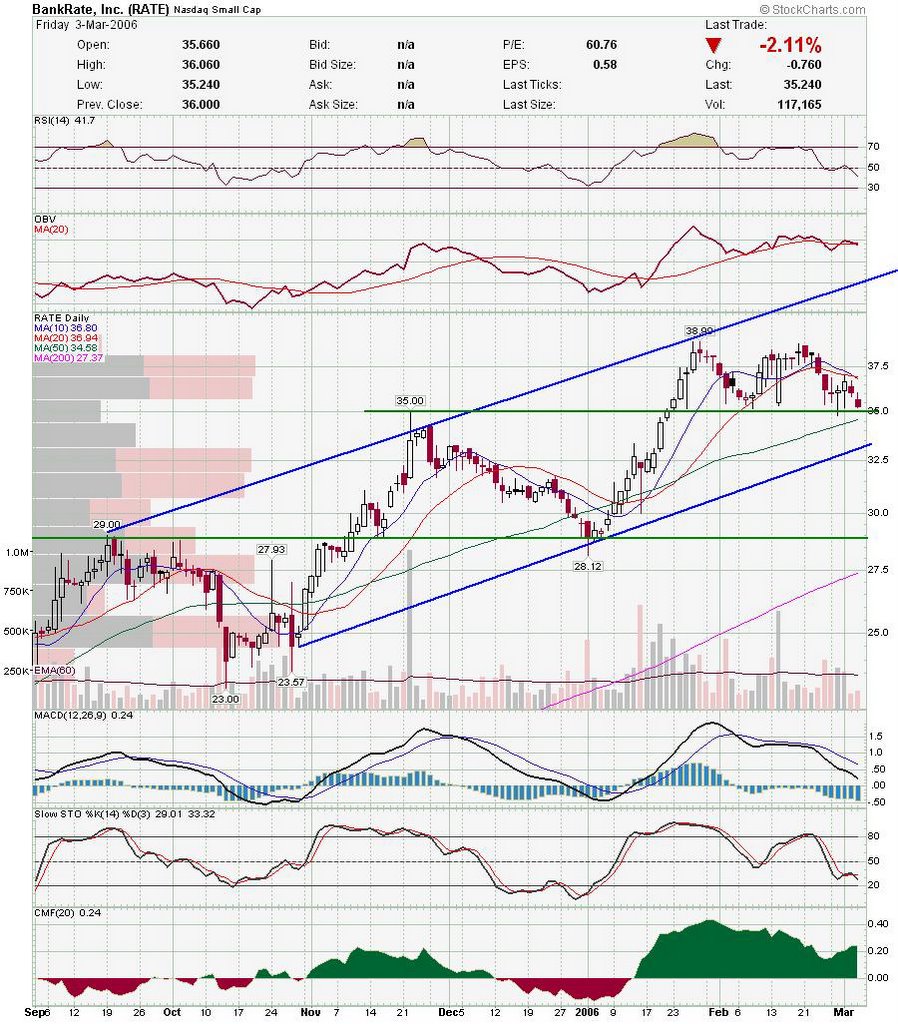
Good Luck and good trading,
DT
Subscribe to:
Post Comments (Atom)


0 comments
Post a Comment