There has been a lot of talk lately about weak internals and whether we are in the processs of topping out and ending the current bull market. I won't bother trying to make a call but I think it's a good time to check out the weekly charts on the major indices.
Nasdaq broke out of a rising wedge and managed to hold above the previous resistance trendline. It just recently broke out of a small triangle consolidation. This all looks bullish to me, but there are divergences on most indicators. You can argue that the past two years were a consolidation and that the move is just beginning.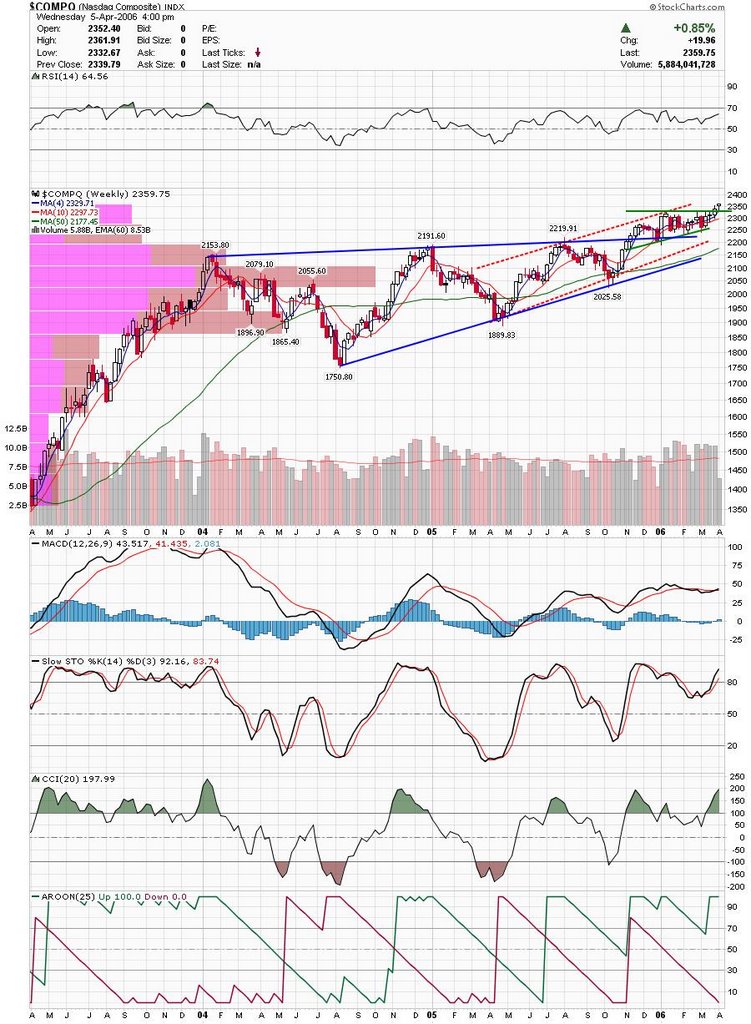 Dow has been gingerly moving sideways and has not broken out of the current channel. It actually reversed after touching the top last week and may be trying to get back up and test it again. I would say this chart looks more bearish to me unless the trendline is broken.
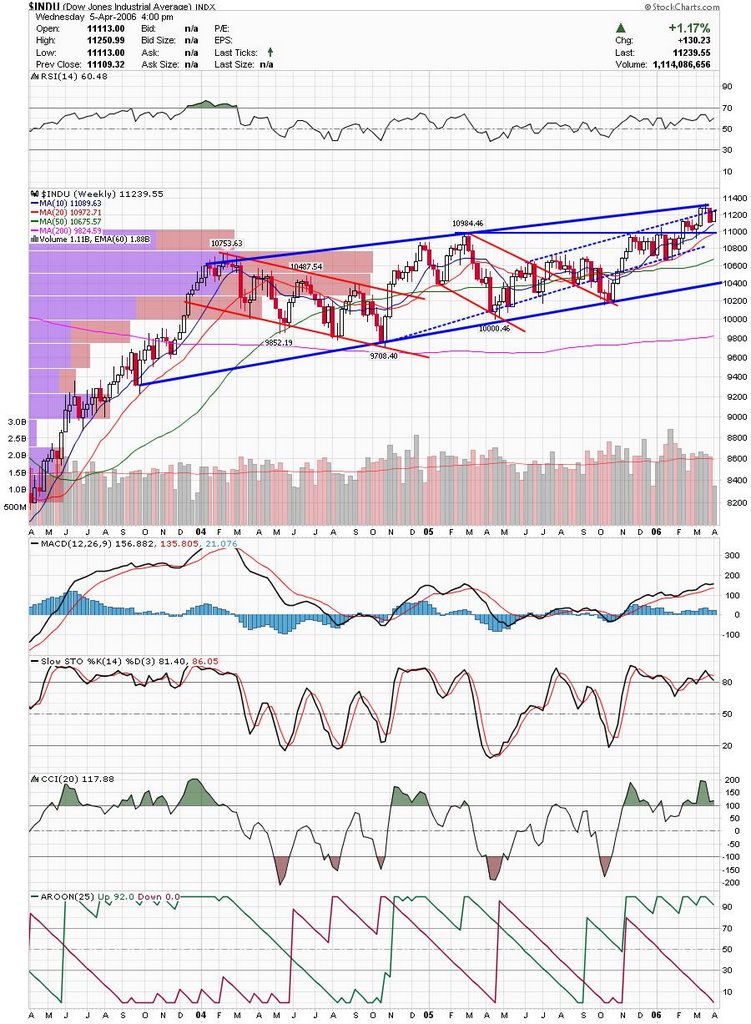 Russell has been a market leader with the Nasdaq. They broke a rising wedge and appear to be on an accelarating trendline. Looks bullish to me. Indicators don't look bad here either.
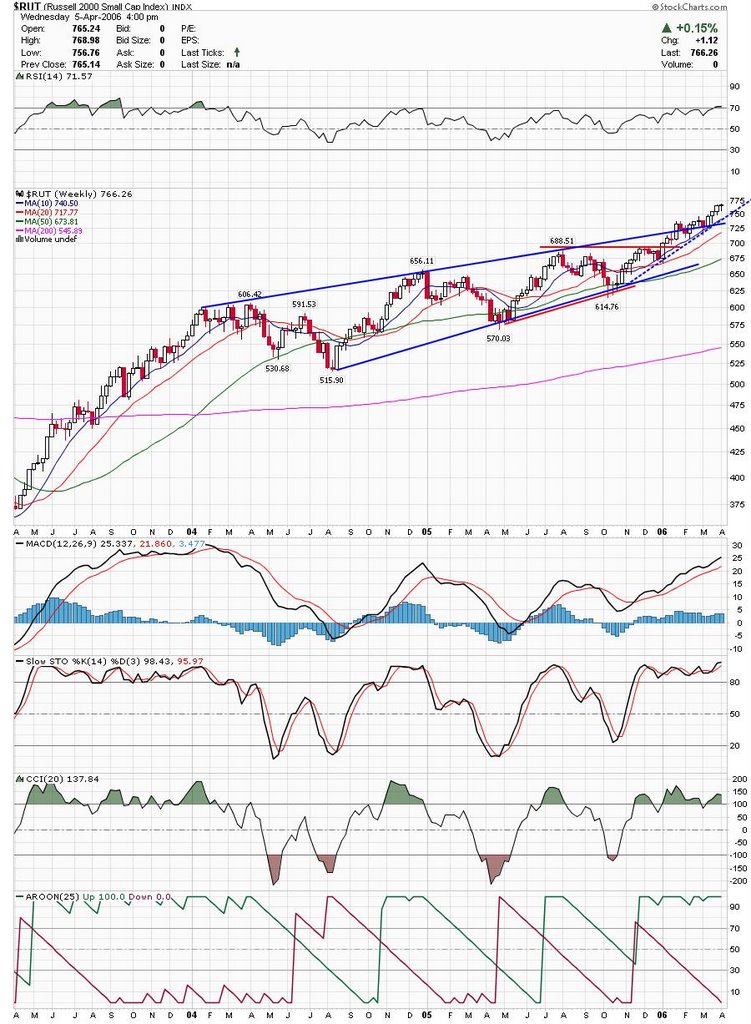 SP500 is sort of similar to Dow in that it is still in confines of channel. Unless it breaks the channel I see this as bearish, because a failure to break should lead to a trip to the lower end of the channel.
 SP600 looks more like a trend the a consolidation channel. There is still some room to the upside here and indicators look healthy.
The purpose of these charts is not to guess where we are going tomorrow, but to keep the overall perspective in mind. Hopefully these charts help you as they help me.
DT
I will post some stock charts later tonight.
Subscribe to:
Post Comments (Atom)


0 comments
Post a Comment