Sorry to get this post up so late, and it is incomplete at that. It seems that the Dow and Nasdaq can't move in the same direction. The DJIA is starting to break down as the Nasdaq firms up.
Here is a weekly chart of the DJIA. Notice the deteriorating participation in the rally. Here is the weekly for the nasdaq. Looks a lot better then it did a couple of weeks ago.
Here are some charts that I came up with tonight.
CLB has been a strong stock and may breakout here. FDG tried to bounce back but may be failing at 200sma here.
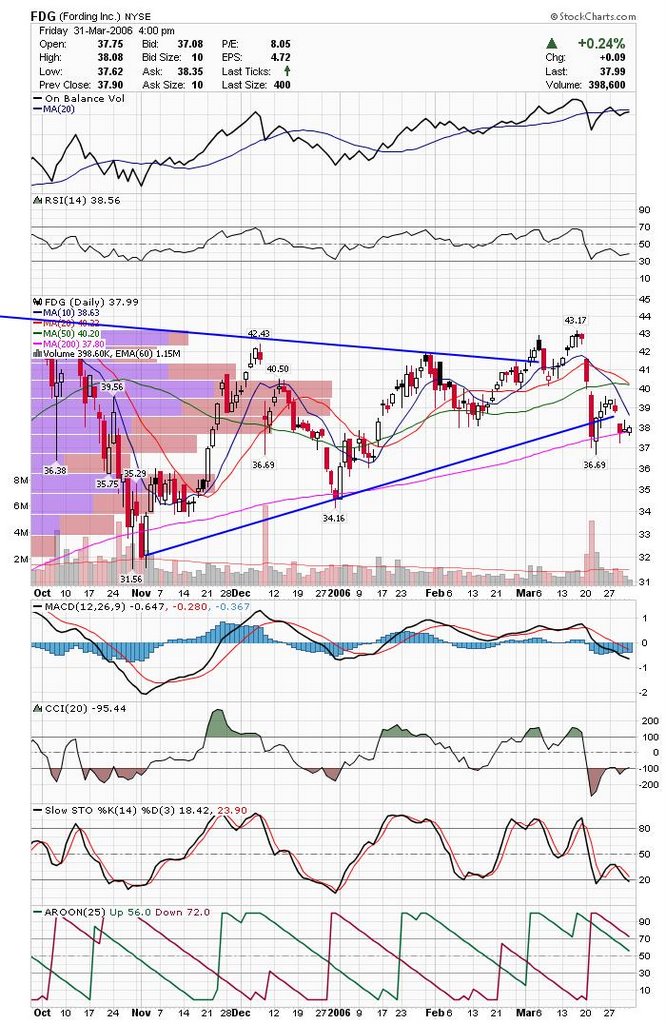 GIL fell out of the IBD100 and looks like it may be failing at the 50.
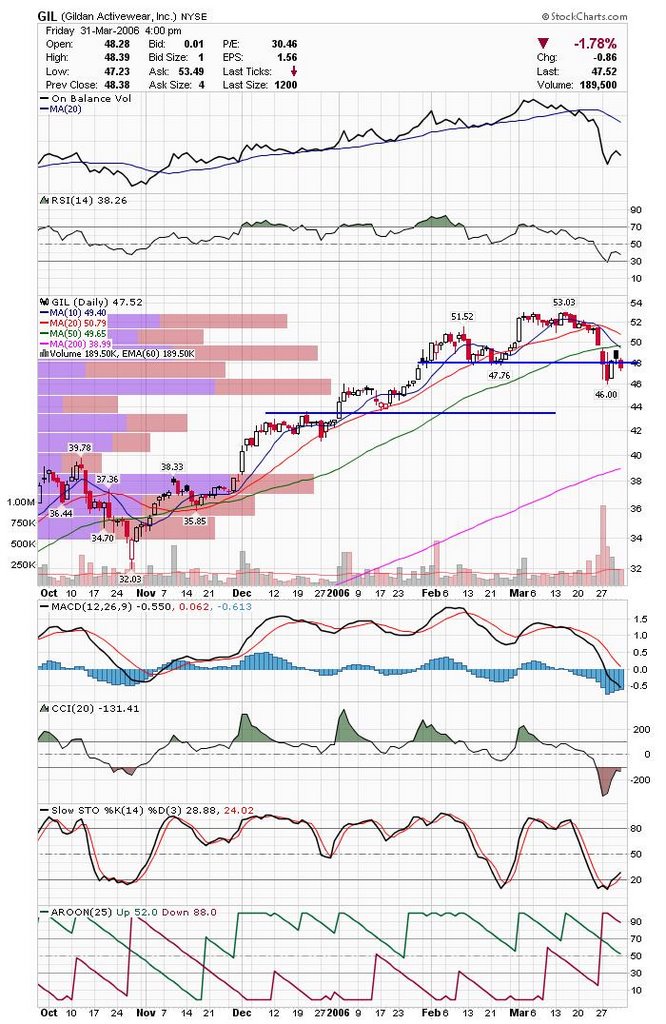 GRP has met up with stiff resistance. Looks like it will head down a little from here.
 IHS is an interesting chart. If it doesn't try and fill gap it will be extremely bullish.
 PAAS has come back down to test breakout area.
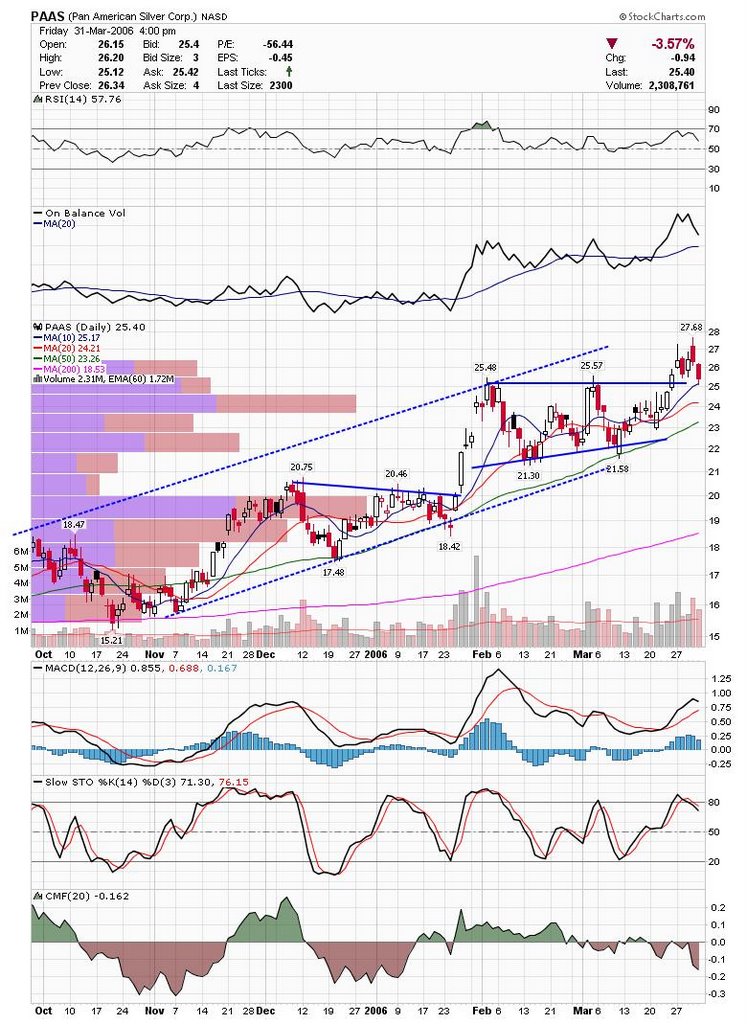 Most Gold stocks are looking good and TRE is close to a breakout.
 CMED made the IBD 100 again and looks to be testing the double bottom pivot point. If it holds, it should go up to test 50sma.
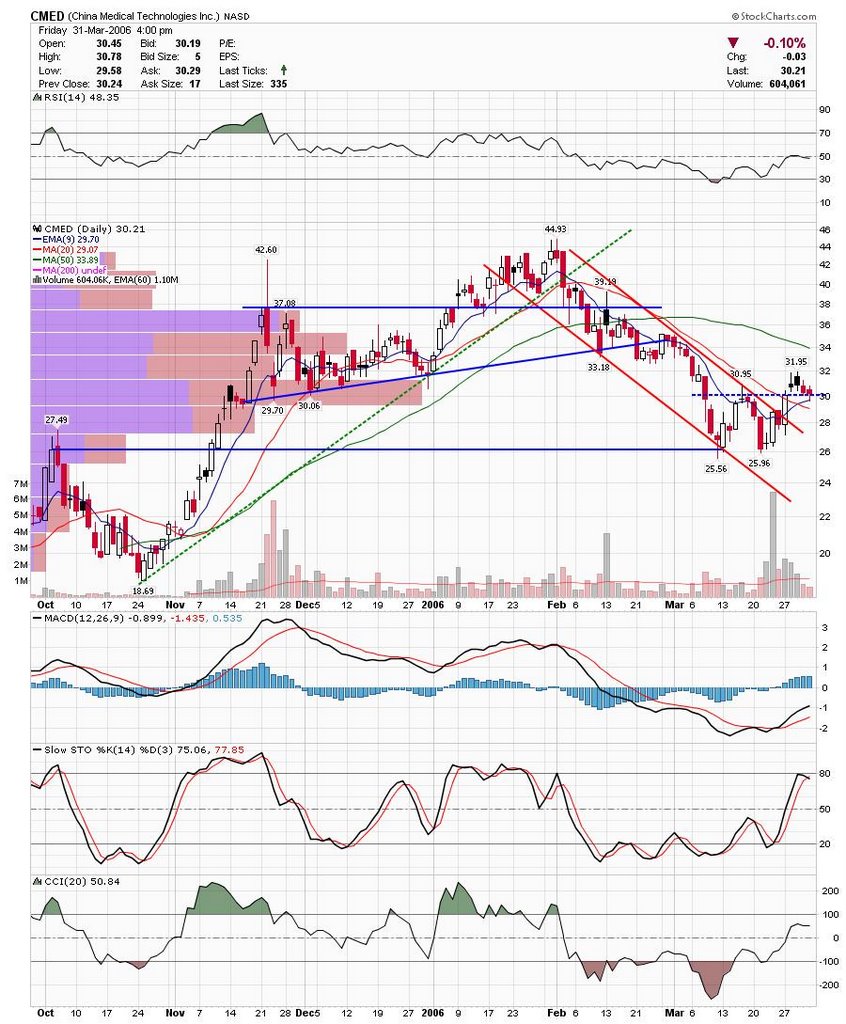 AMD has fallen pretty hard and is testing support. I would think institutions would support it here, but if it falls below the line.......
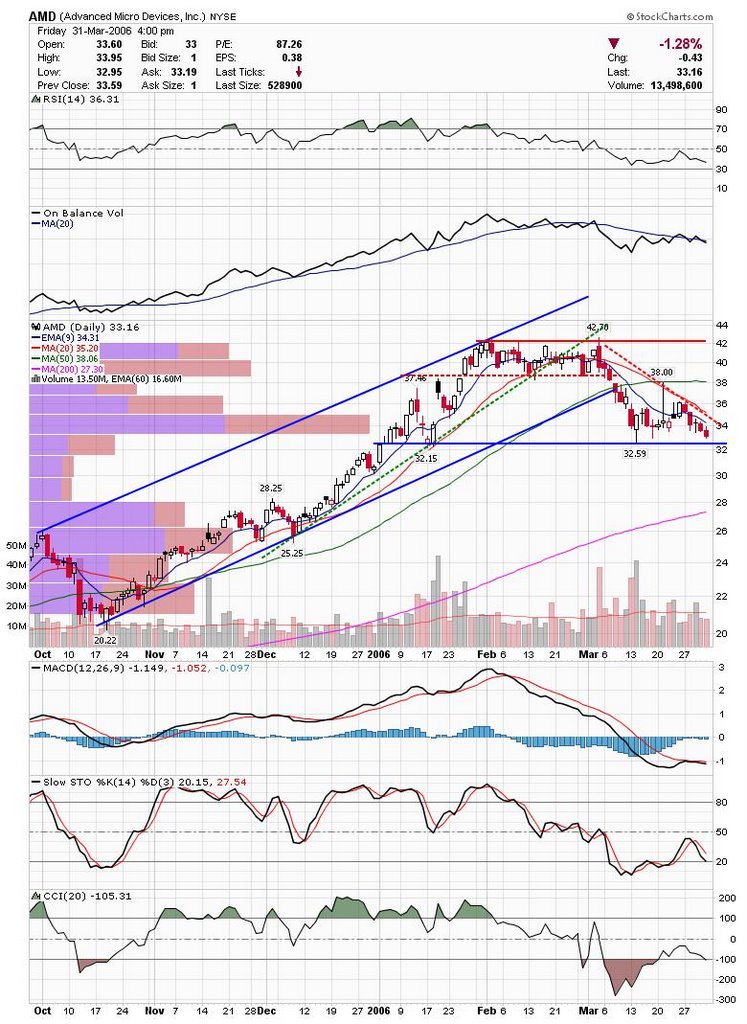 GRMN has been moving nicely and looks like it may get a bounce here.
 IIJI looks to be failing at the 200 sma and 50 may give it the death crossover.
 Sorry to make my post so brief tonight, but it has been a long day and it's late here on the East Coast. I have a bunch of chart I will try and post tomorrow morning before the market opens including IBD100 stocks and penny stock special IIP.
Also, A reader posted the following:
"Could you comment on SMSI and its 2 yr chart, it looks like a healthy breakout and key buy pt. Thanks!"
Scott K
Well, Scott, sorry I didn't have time to work up a chart, but I checked it out and SMSI looks good. I wouldn't be buyer here because it is a little extended, but I would expect it to hold 11.60ish from previous top if it pulls back.
Good Luck,
DT
Subscribe to:
Post Comments (Atom)


DT Trader,
Thank you for a look at SMSI earlier in the week. Could you draw up a chart analysis for it when you have a chance. Fundementals are very strong and I believe the TA shows healthy consolidation of recent gains; but would like your opinion please.
Scott K