It is still too early to tell how much of a bounce we will get in the indices, but it definitely looks like "bounce" is the most we will get. If this was the first leg of a correction, then the next leg should provide some nice shorts. There are still some long plays worth considering for short term traders though since the indices are just climbing out of oversold levels. The ideal situation would have the indices attempting a rally over the next week or so, and then rolling over. However, I think most people are expecting this type of scenario and the markets have a way of punishing the herd.
Here are a few interesting charts.
BLK looks like it will continue to correct. The question is does it hit the upper trendline or does it fail here at the twenty day moving average.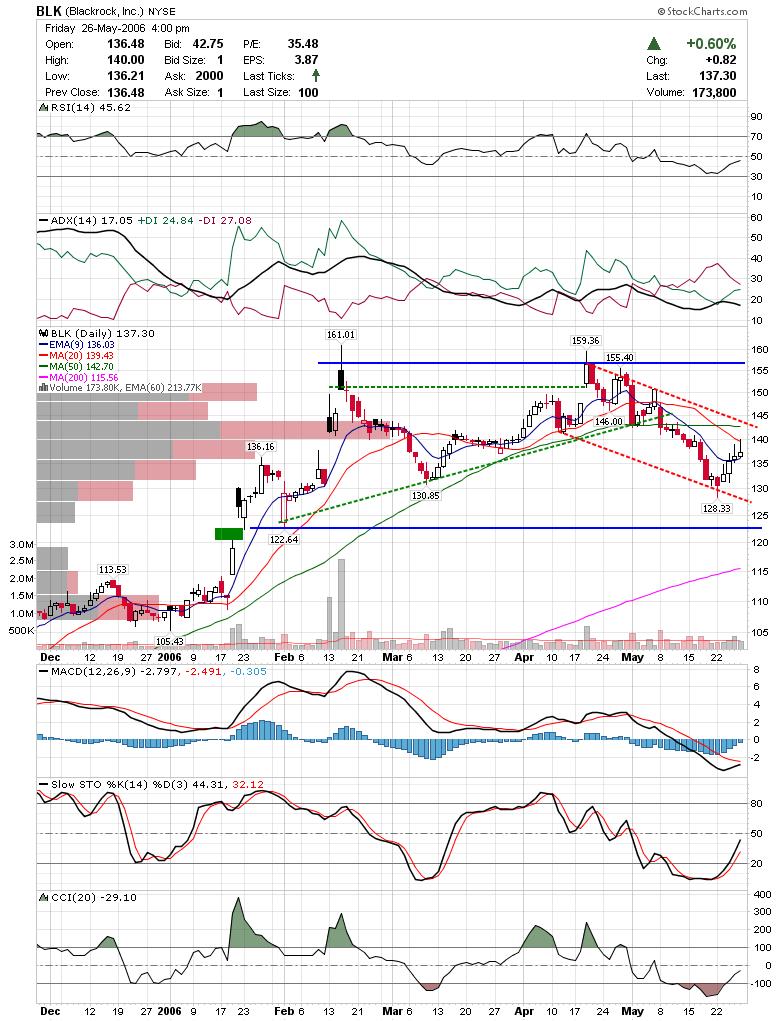
CLB may be getting support at the fifty SMA and trendline.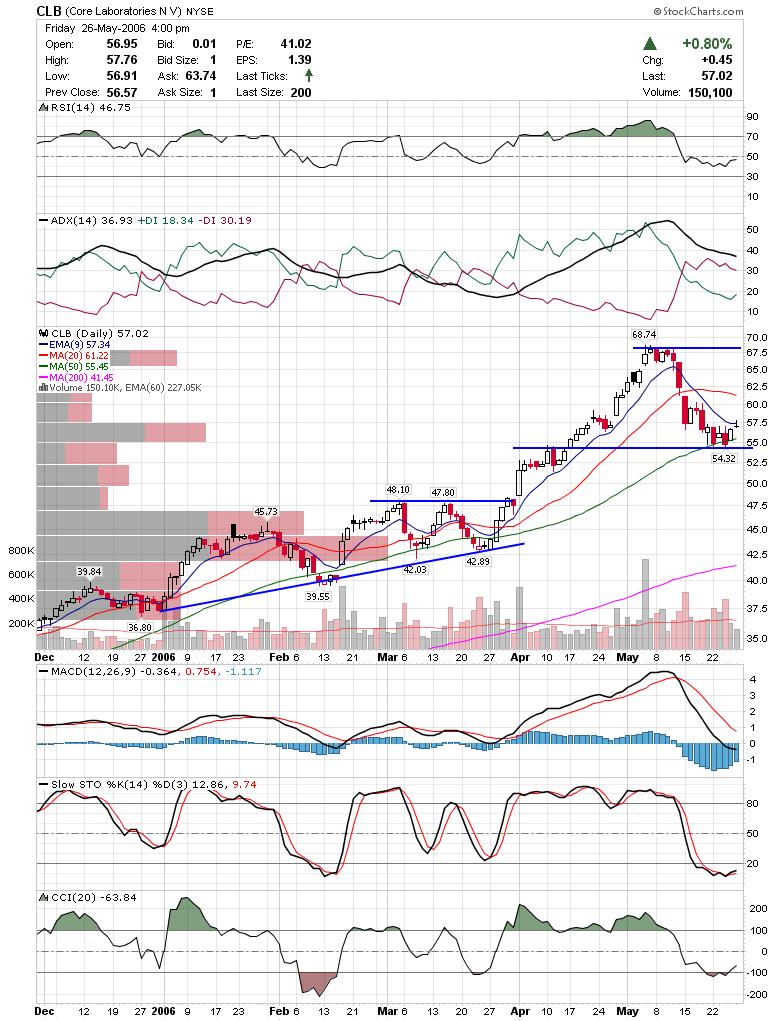 MED has been showing strength and made a new 52 week high Friday.
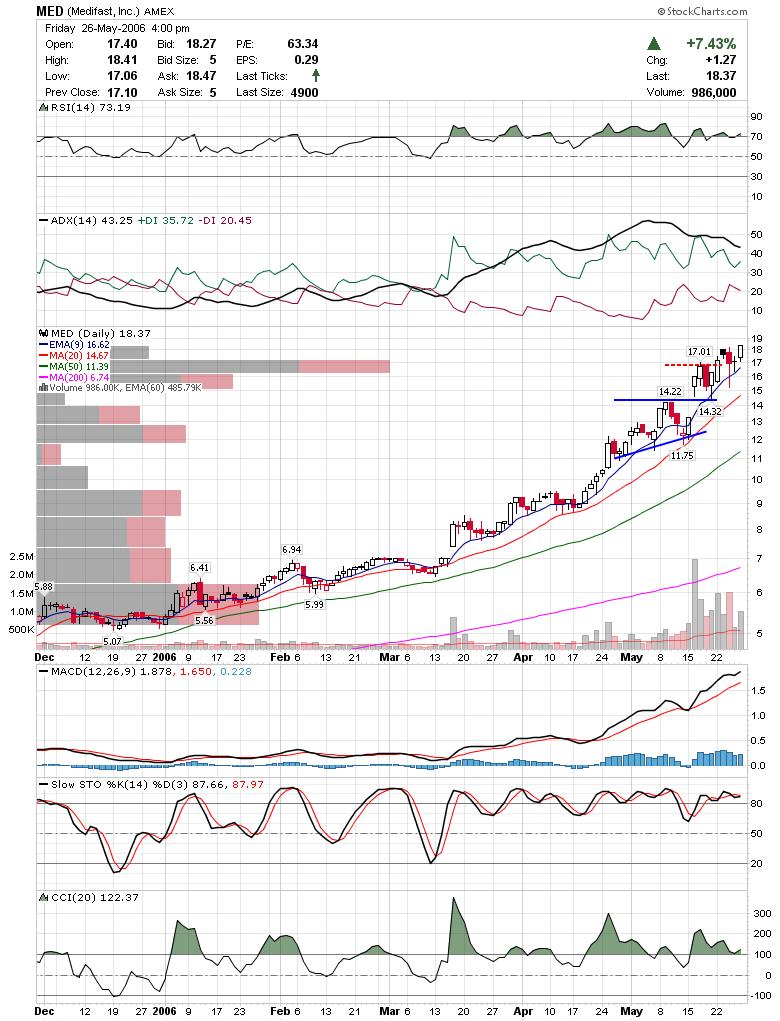 GDI looks like it will make a run at the upper trendline near 82.
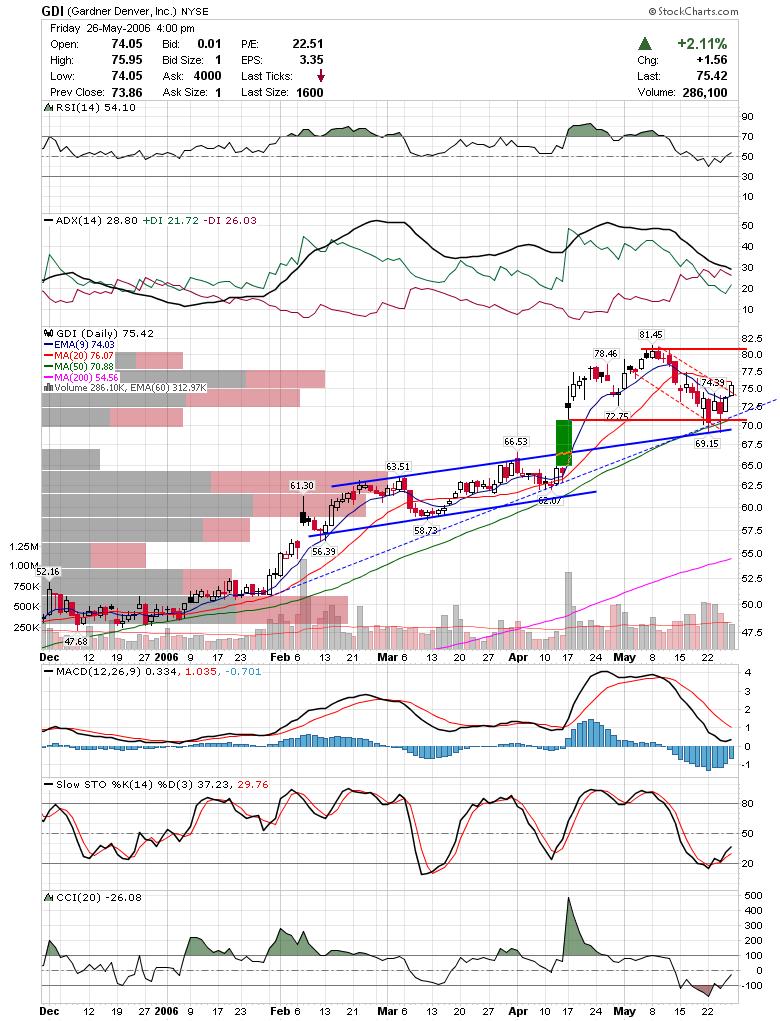 HITT pulled back to double support at the previous breakout area and the ascending trendline. They had a nice move Friday confirming support.
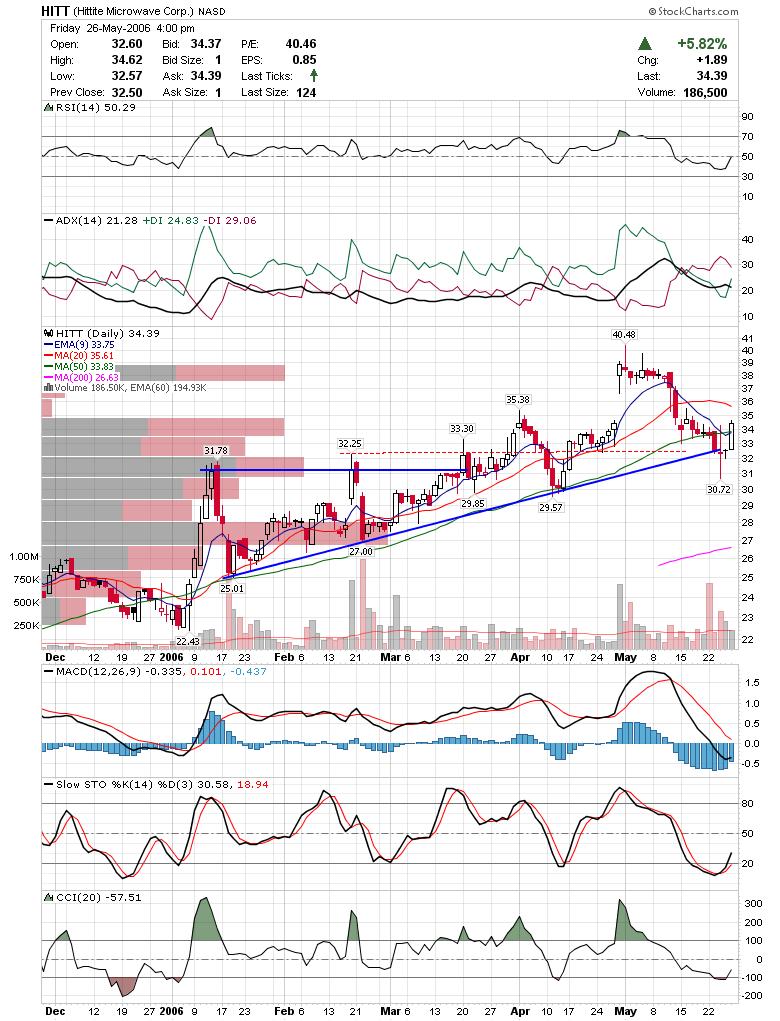 IBCA made a push to the top of an ascending triangle and pulled back a little. They still look like they cleared the line though. While there is still some resistance to contend with, most indicators are confirming this move.
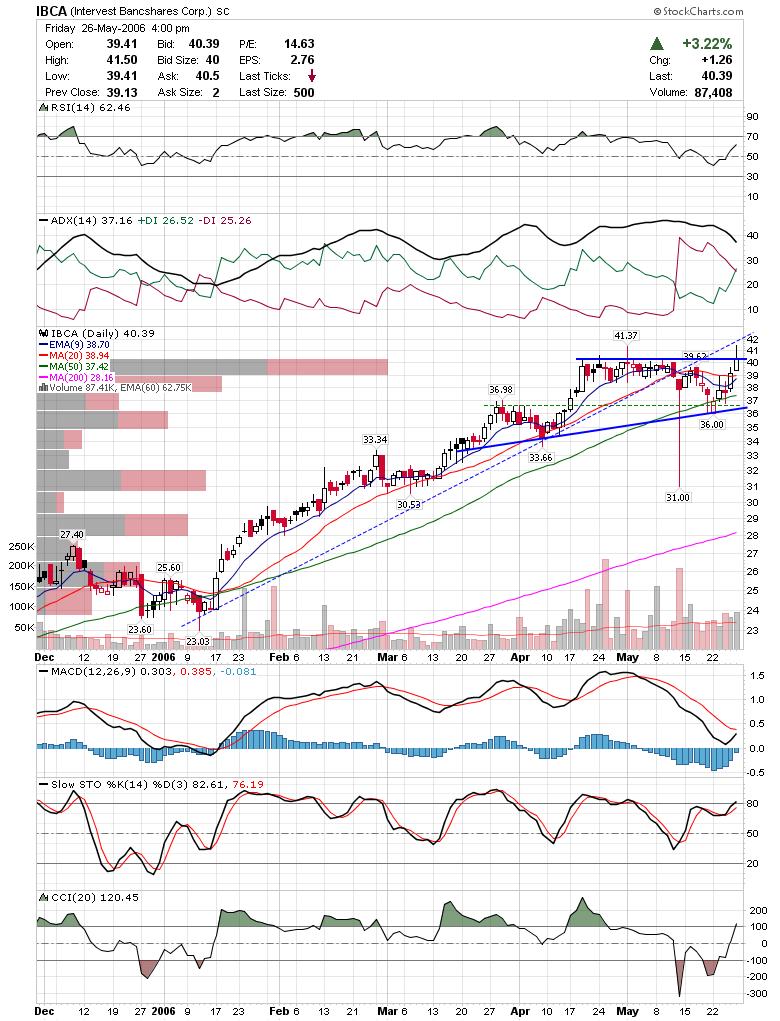 BUD is one of the short plays that came up on a trade ideas scan I was messing around with. While BUD actually looks like it will be a pretty good performer in the intermediate term, it looks like it is headed lower in the short term. Here is a chart of BUD breaking flag support and possible support areas below.
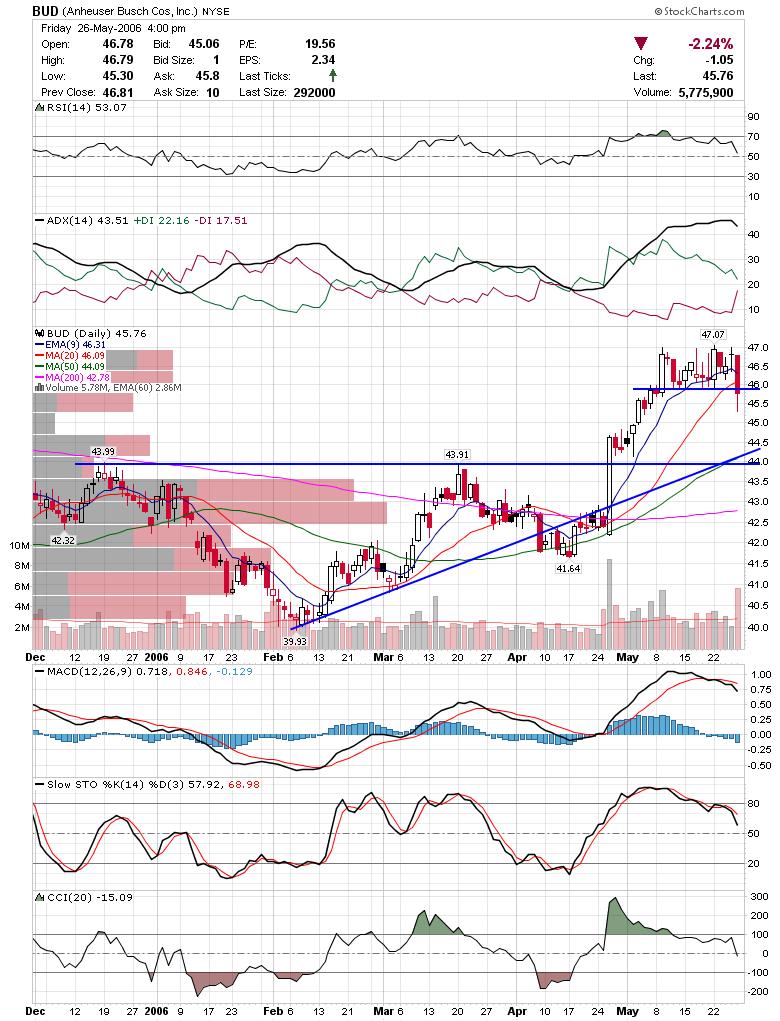 Here is the weekly chart showing some pretty stiff resistance at 47. Notice the long wicks on the previous three weekly candles.
 STLD has more resistance above then support below. I am watching to see if it breaks lower here or if it will attempt to make a push to the upper dotted red trendline.
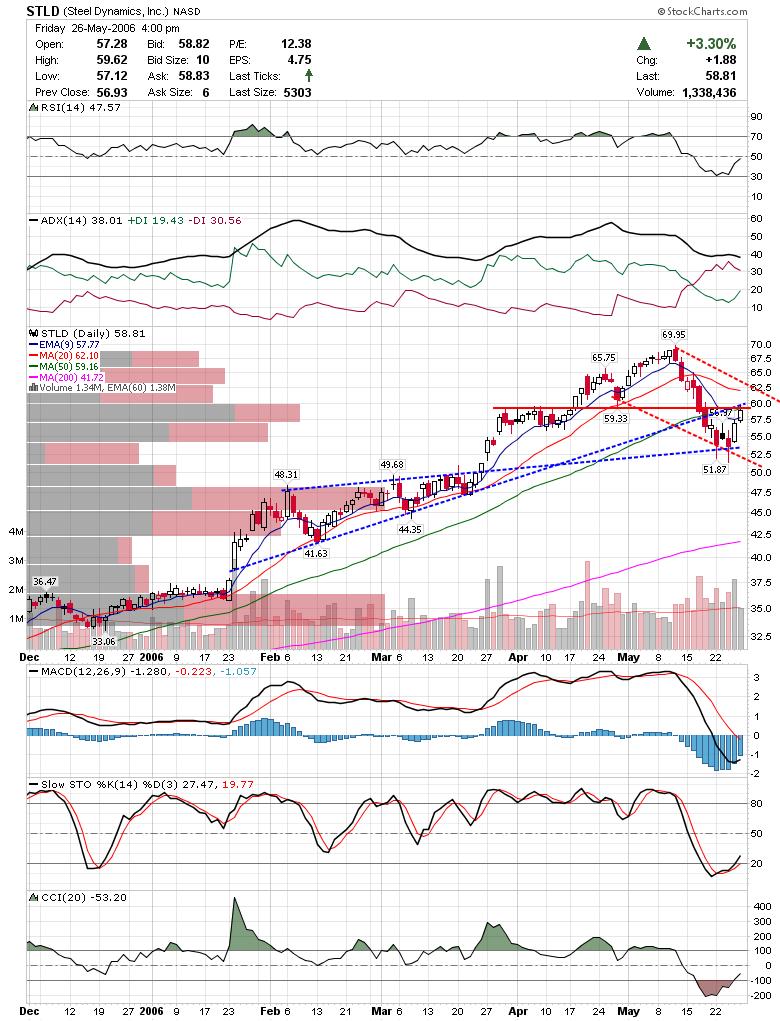 MNST is one I am watching to see if it makes it up to previous support in the coming days. The idea is to wait for it to breakdown near resistance.
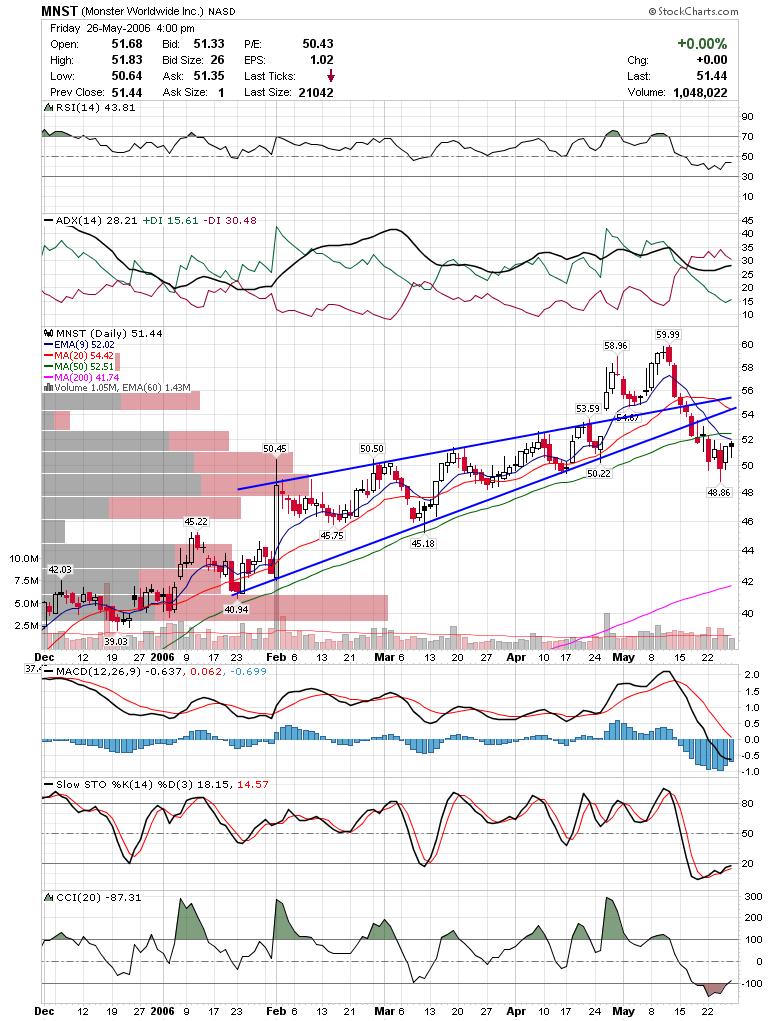 LNCR made a new 52 week low Friday and looks like it may really break down here. This also looks good on a weekly chart showing the last few years.
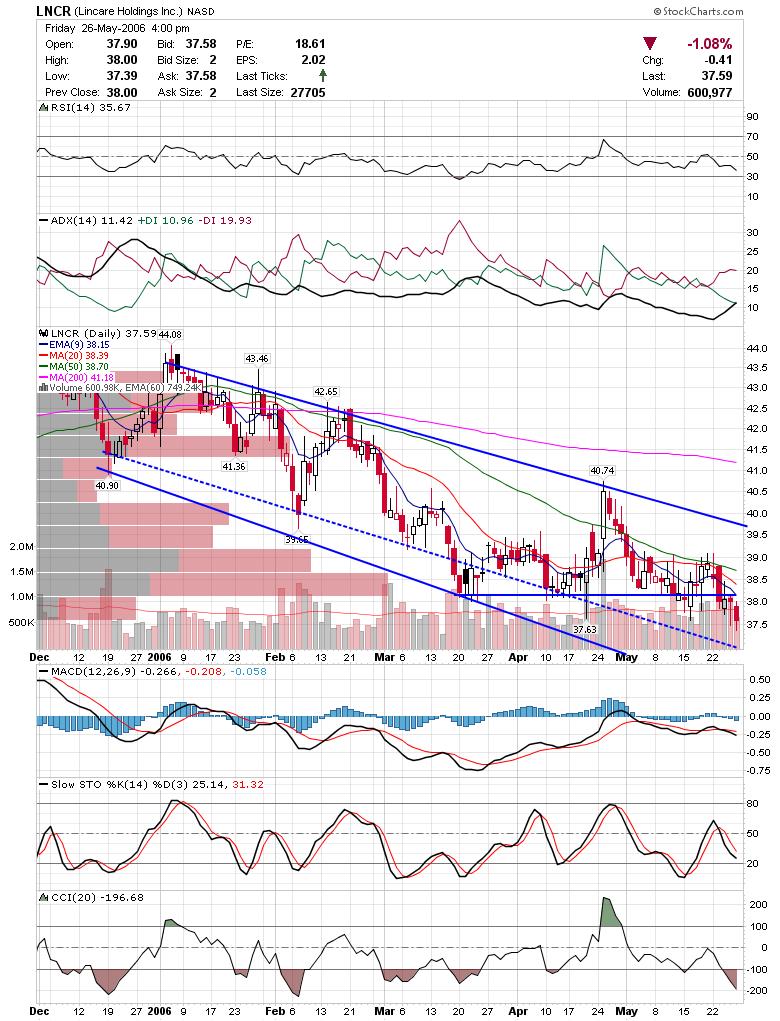
Good Luck,
DT
Subscribe to:
Post Comments (Atom)


0 comments
Post a Comment