The Nasdaq actually breached the October lows today but managed to reverse by the end of day. I would wager to say that if todays low is breached in the next few days then it will be the start of a nasty downturn.
Here is a chart of the Nasdaq showing positive divirgences on RSI and MACD. A rally to the declining sma's would not damage the bearish charts and would alleviate some of the oversold conditions. Here is a chart of the SP500. Nice candle today confirming support. This level was confirmed as support on the last downturn, so it makes the candle more significant. While I'm not crazy enough to call it, it looks like there is a possibility that the SP500 could form a reverse head and shoulders as marked on the chart. This would be an interesting development if the pattern came to fruition as the short covering would be frenzied (maybe fed pause ;).
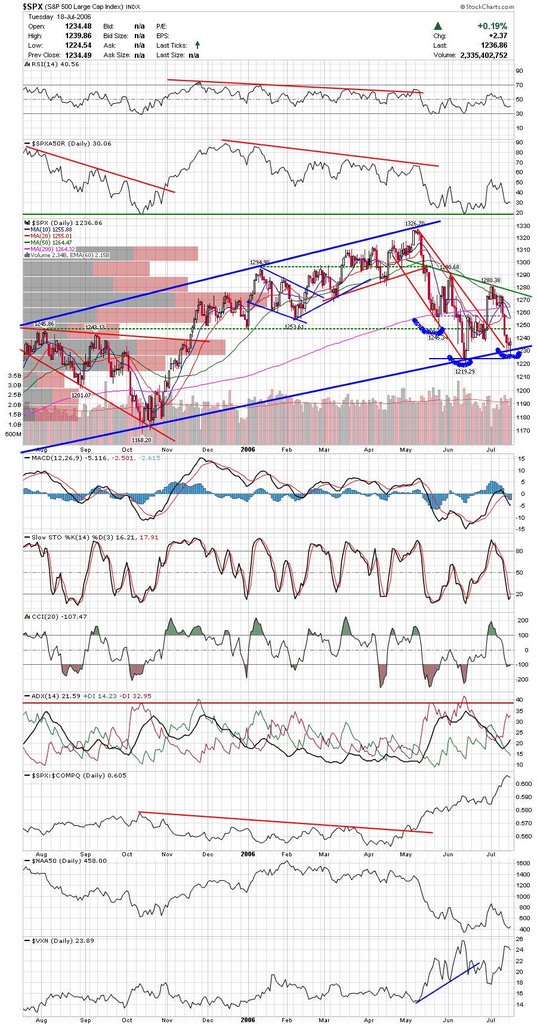 Here is a chart of the very oversold $sox. May get a bounce here on a previous trendline. I couldn't find any charts of semi's I liked, so if anyone has suggestions feel free to leave a comment.
 Here is a chart of MED continuing to drift towards the 50sma. They had a decent day today and could follow through tomorrow.
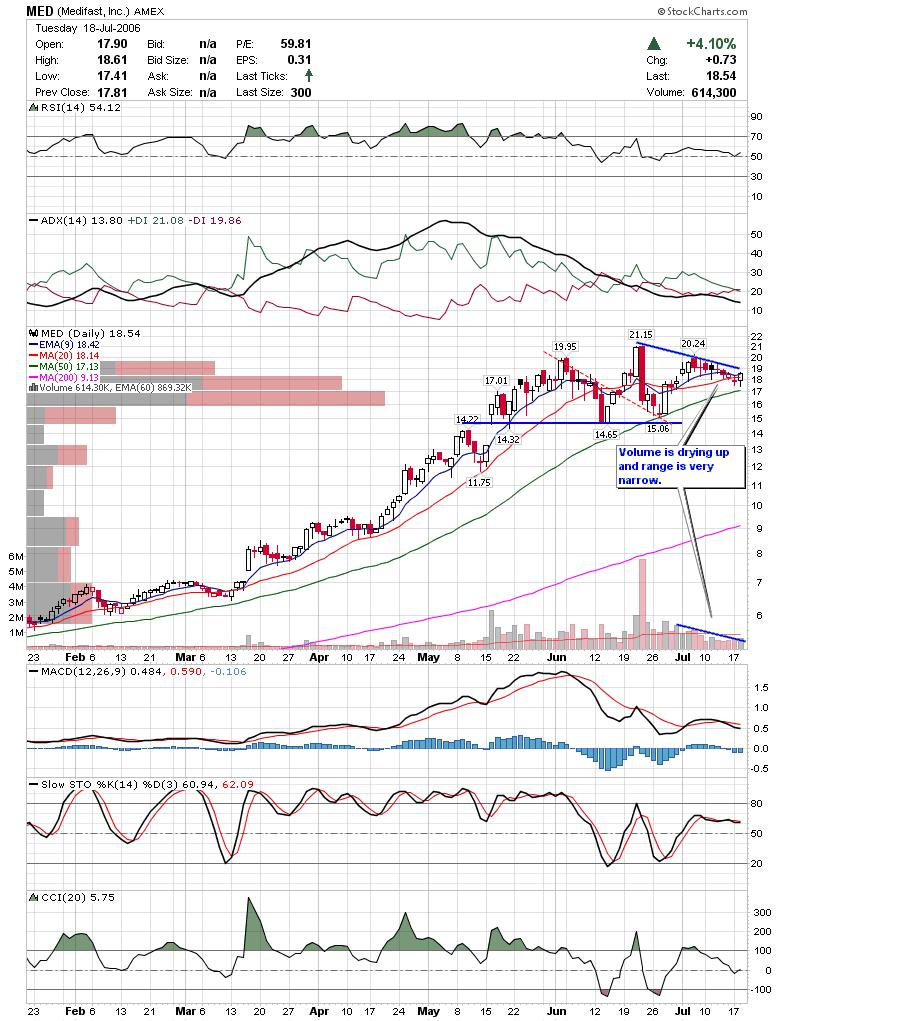 BWP may get a bounce off the trendline here which could turn into a triangle breakout. I don't care for low volume stocks, but this one trades well.
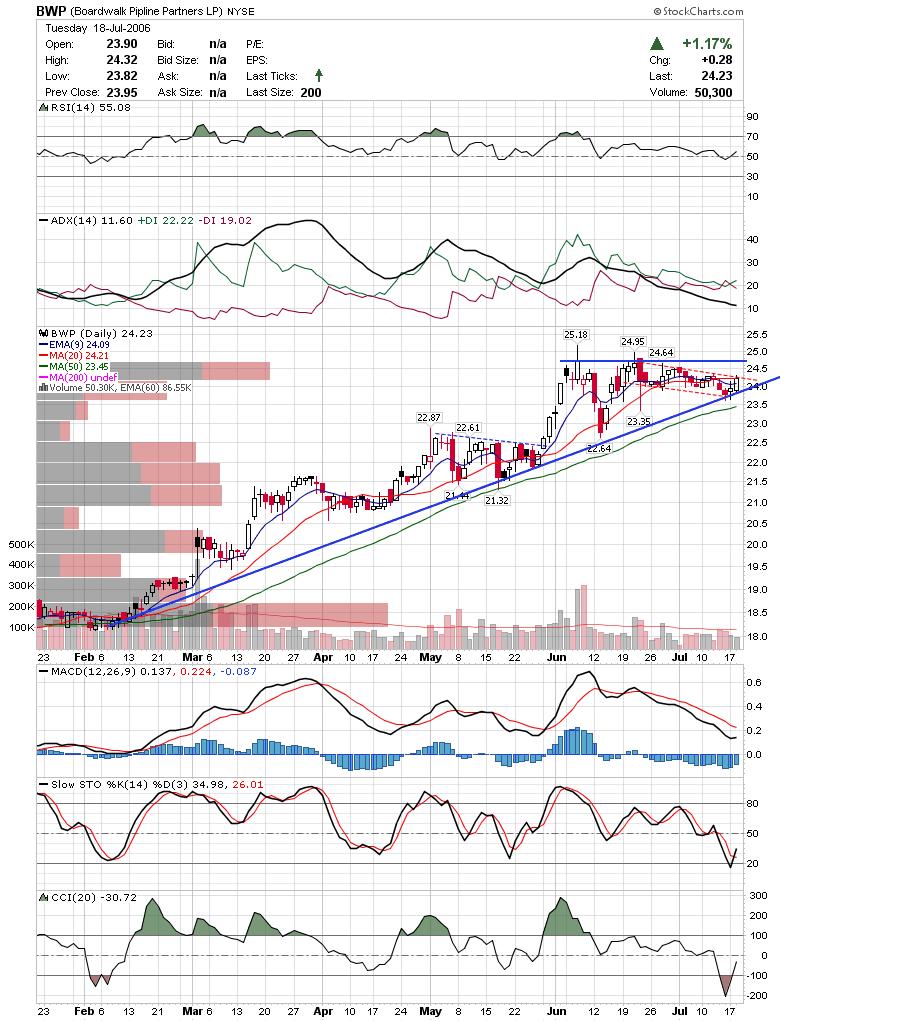 ODFL pulled back to the 50sma and could find support here.
 Here is an updated chart on CSH which was highlighted earlier this week. This looks like a solid breakout.
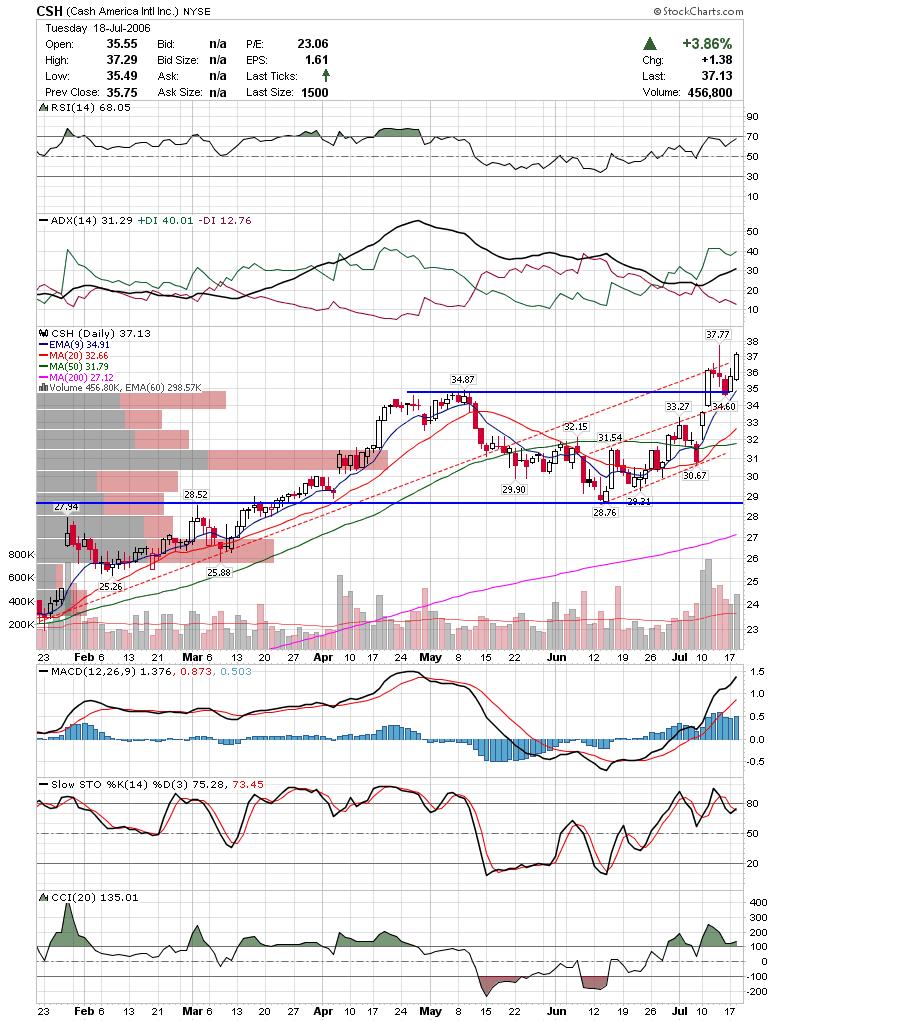 NTRI came back to test support and had a bullish engulfing pattern today. They could be headed for a test of the 52week high if they can clear the small cup and handle base from the past month and a half.
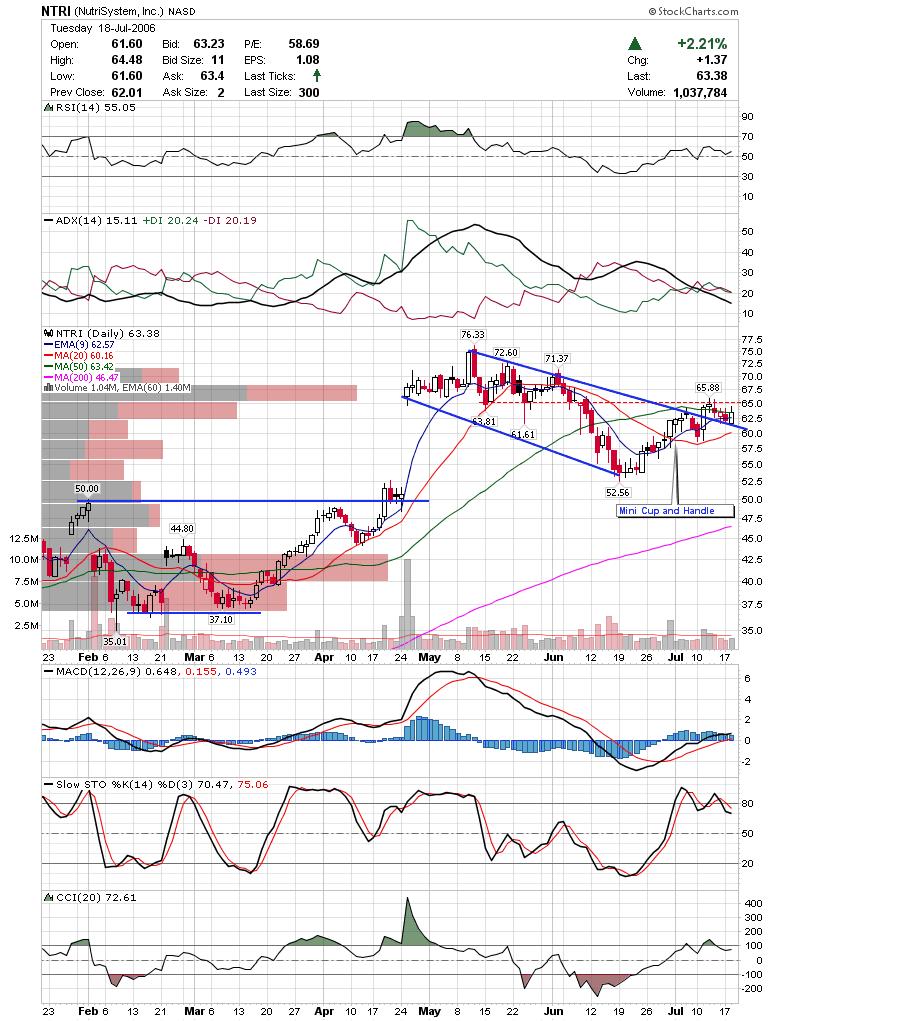
Good Luck,
DT
Subscribe to:
Post Comments (Atom)


Your charts do not come up as readable when you click on them. You may want to try stockcharts.com
Cheers
Anon: you have to zoom in on them, But Ive never had a problem.
DTT:
It's very hard to say what's going to happen to the semis.
On Wed we have the following earnings:
INTC, LRCX, MOT, NVLS, QCOM, RMBS, AAPL
other techs: UIS, LOGI, JNPR
It'll be interesting to see what happens.
RMBS continues to break down, MXIM is at a yearly low, KLAC continues to break down, LRCX is forming a H&S that will validate if they disappoint with earnings, XLNX and ALTR are near 52 week lows, AMAT set a new yearly low today, as did MRVL.
http://stockcharts.com/c-sc/sc?s=LRCX&p=D&yr=0&mn=7&dy=0&i=p85876996108&a=80670099&r=523
http://stockcharts.com/c-sc/sc?s=KLAC&p=D&yr=0&mn=10&dy=0&i=p15183961498&a=80509300&r=2263
BRCM, NOK, AMD, FSL, GOOG, MSFT, PMCS, VRSN all report on thurs. If nothing else, the next 2 days will be interesting to watch.
Thanks for the charts Dave. Things will definitely be interesting to watch over the next few days with earnings and options expiration all happening.
DT