Oil closed lower today inspite of all the turmoil in the Mid East. There are some interesting patterns developing on the Oil Charts showing a possible top nearby. Although it looks like there will be some weakness near term, keep in mind that Energy and Energy related stocks have been the strongest sector and remain comfortably in long term uptrends.
Here is a chart of the Oil contract. An evening star candle pattern formed today which is a reversal pattern. A common misconception is to interpret candle reversal patterns as signals that the trend will actually reverse to the opposite trend. In practice, it is far more common that the trend will pause and then either continue or reverse. I would look at this pattern to suggest that oil will pullback or consolidate. One possible target is to the previous trendline breakout area highlighted by the blue arrow below. Keeping in mind that Oil just broke to new highs, it is interesting to note that the Oil Services ETF OIH, failed to make a higher pivot high along with the commodity. In fact, it looks like it is tracing a possible head and shoulders top. It is too early to determine if the pattern will complete, but it sure looks like it will at least test the neckline.
 Here is a chart of the XLE Energy Select spdr. Note the same possible Head and Shoulders top along with a lower high and lower low. What is interesting to note is that I don't believe that it is normal for commodities to top so close to stocks. This poses lot's of different scenarios depending on how this plays out.
 There are some interesting charts in the energy sector with possible short setups although at this point I would take the charts above more as a warning to protect profits or to wait on initiating new positions in the sector.
Here are a couple of charts on individual stocks.
Here is a chart of LVS pulling back to a rising trendline. If the market cooperates, this could be a decent entry.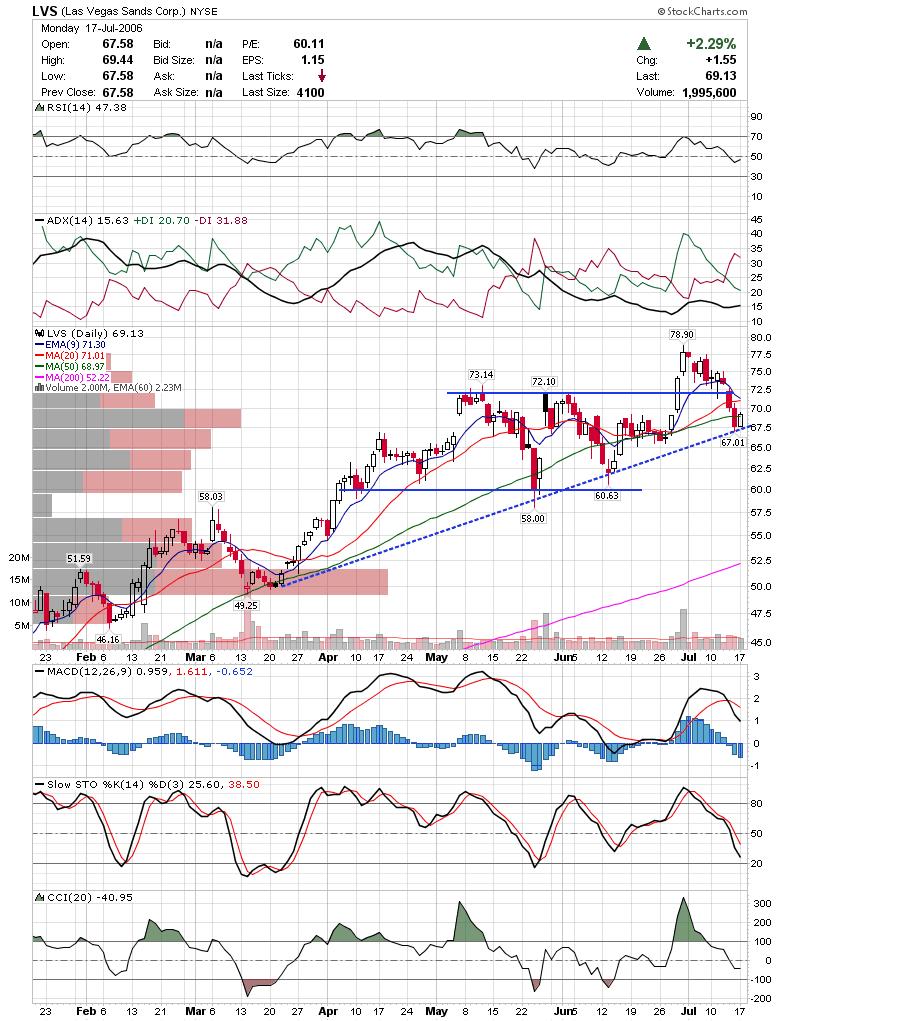 Here is a chart of VOL showing strong buying in the 44 area.
Keep an eye on recent picks, BIDU, IBCA, CSH, and TZOO. BIDU and IBCA had nice days today in particular.
Also, check out The Bulltrader for a promotion they are having to celebrate their one year anniversary. Congratulations Johns and company.
Good Luck and good trading,
DT
Subscribe to:
Post Comments (Atom)


0 comments
Post a Comment