The Russell index is now the next index to break down after the Nasdaq. The Dow and SP500 are barely clinging to support and it looks like we are now in a bear market. While it looks like there will be continued weakness in the long run, we may experience an upturn this week. There are a few reasons for this. First, it is difficult to break through support in an oversold state. Second, this is options expiration week and the past few options expirations have trended opposite the underlying trend as the max pain theory takes effect.
Here is a Dow Industrials monthly chart showing several things. First is a possible top at a previous high. Second, look at the Dow/Nasdaq and Dow/Russell ratios towards the bottom. The Dow is outperforming both which shows that market participants are rotating to "safer" instruments. This is bearish for the markets in general as investors are more apt to take risks in bull markets.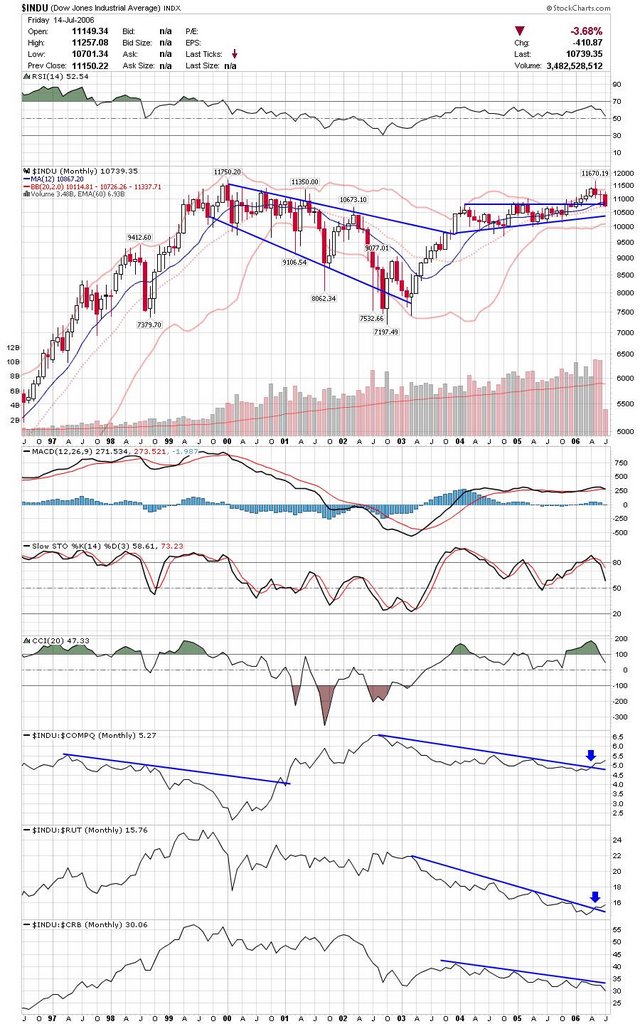 Here is a chart of the afore mentioned Russell Index. This is the weekly chart showing a break down out of the rising wedge after an upside breakout failure a couple months earlier.
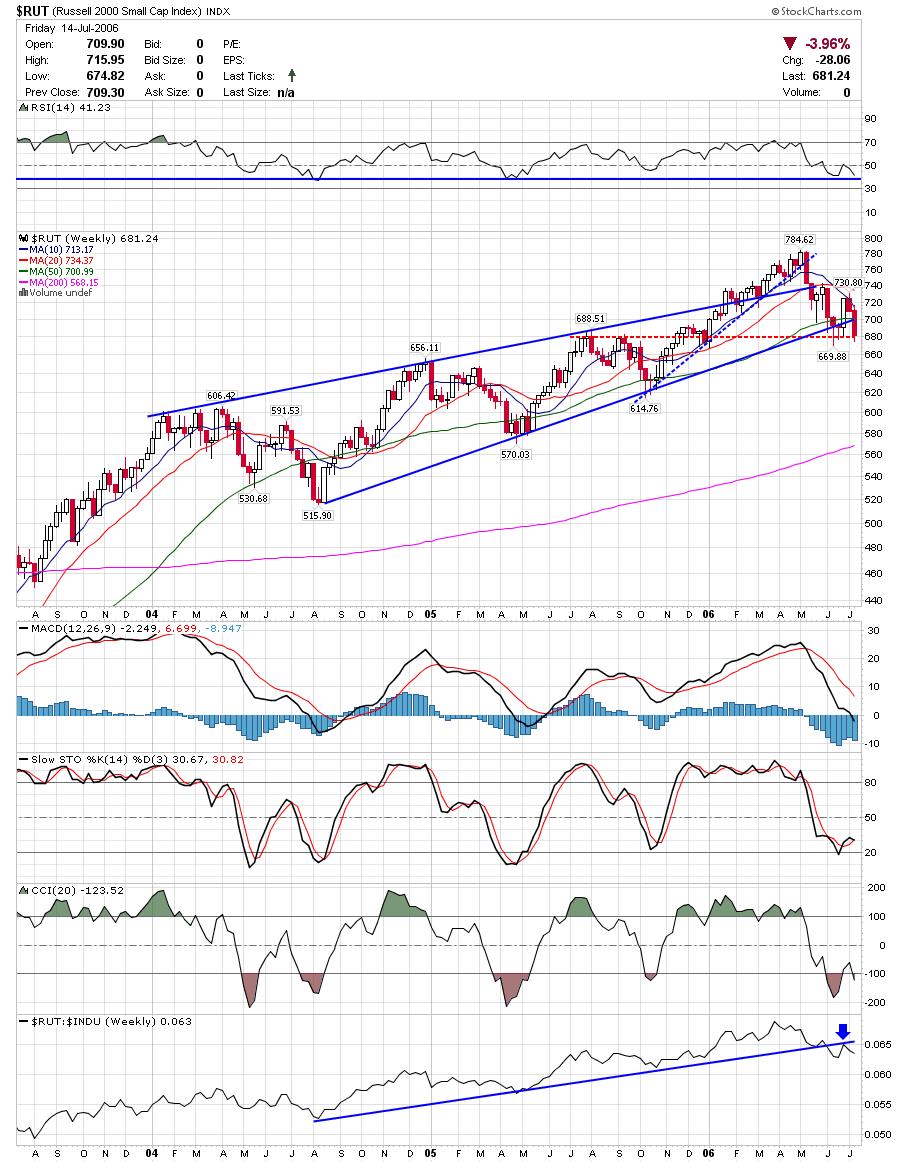 Here are a few charts. All of these are long charts because I believe that is where the reward is again, at least for the next few days.
ARGN refused to go down the past few days and is finding support along a rising trendline and MA's.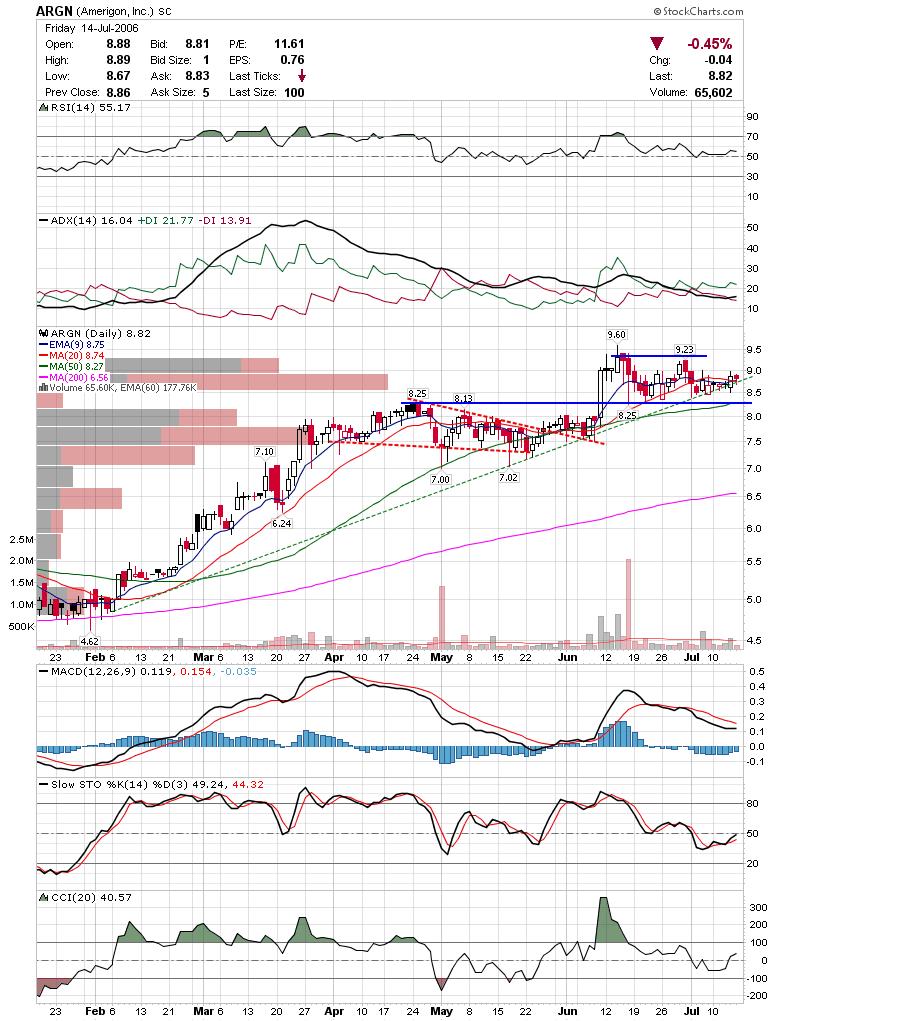 OMNI may find support near the rising trendline and 20sma.
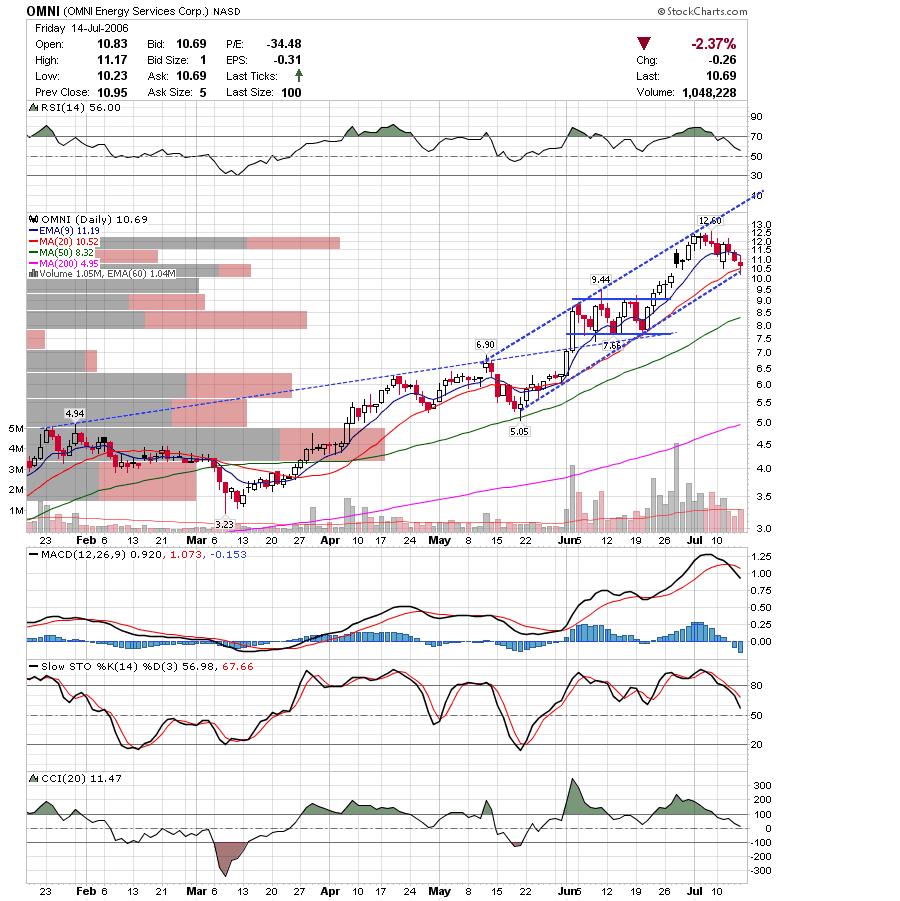 BTU is testing the downtrendline it cleared for potential support. It is wedged between the 50sma and horizontal trendline support right now.
 CSH looks like it may find support at the rising dotted red trendline.
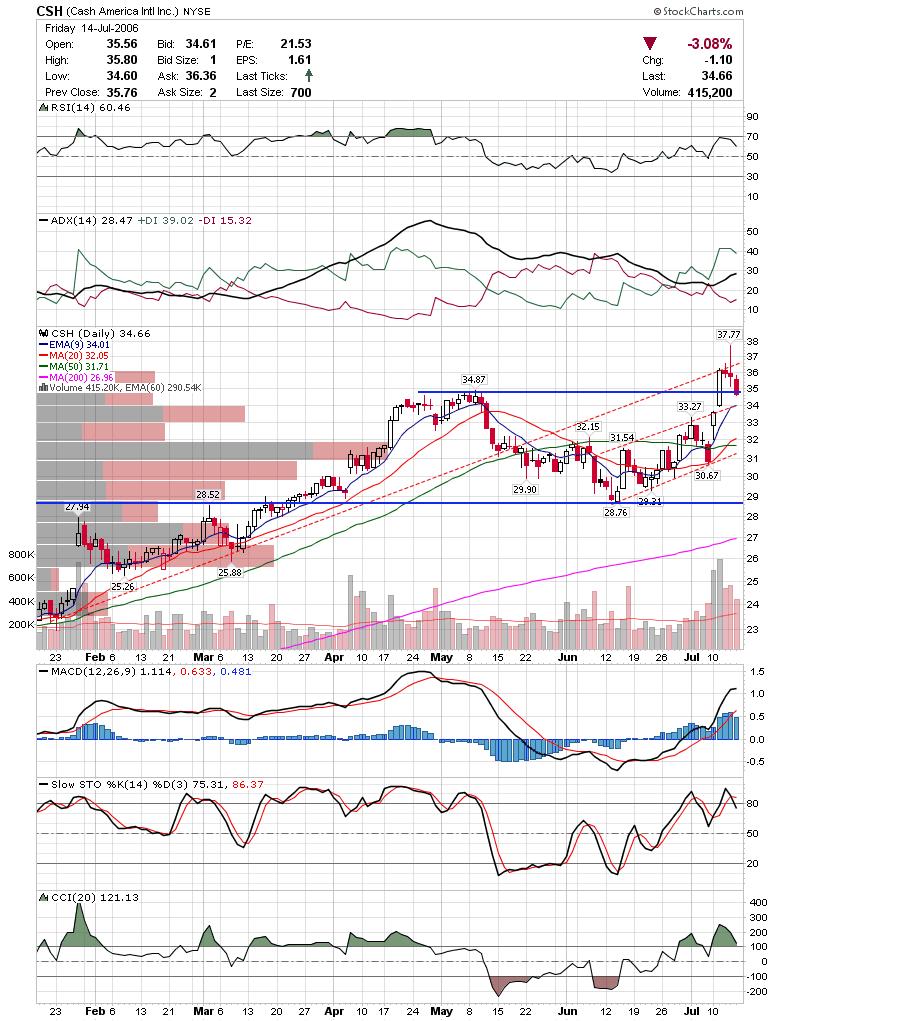 FMD is finding support at the previous rising trendline after the nasty breakdown the past two weeks. This is a decent chart to watch to see if it breaks under the blue line for a very nice short, or if it can get back over the red rectangle.
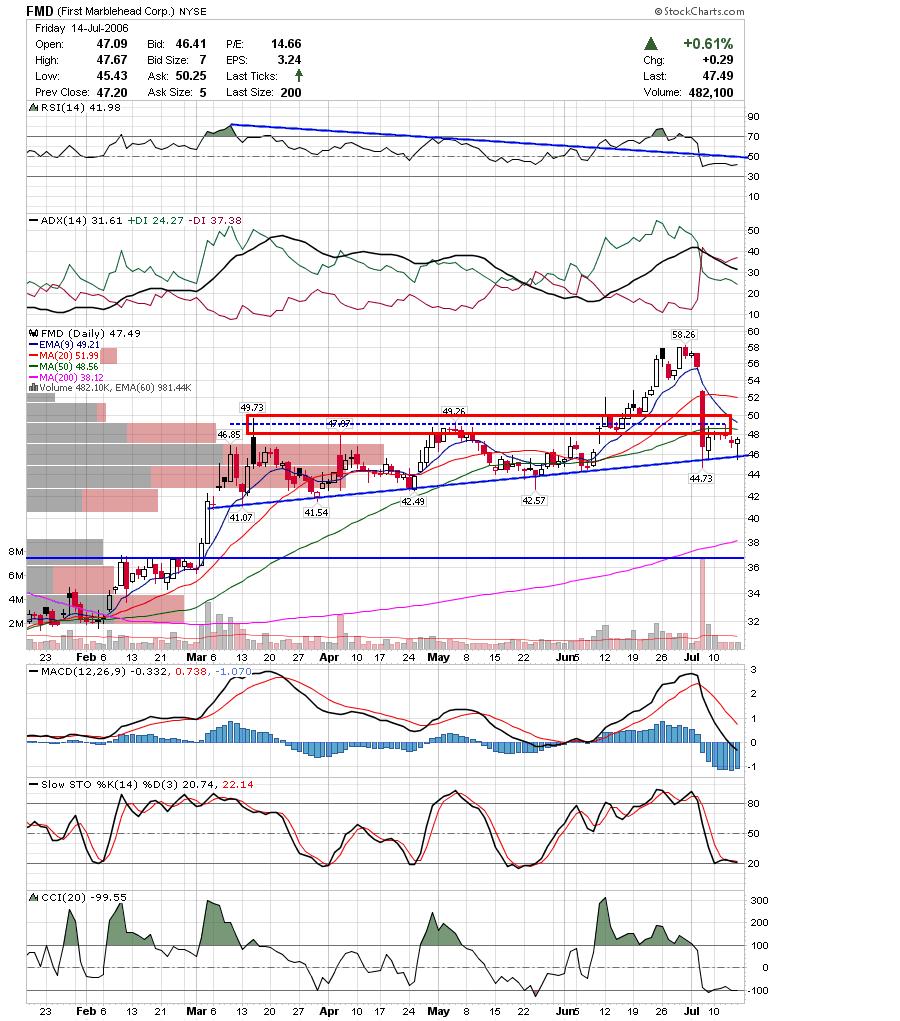 HLTH is holding over the horizontal trendline which was the previous breakout area.
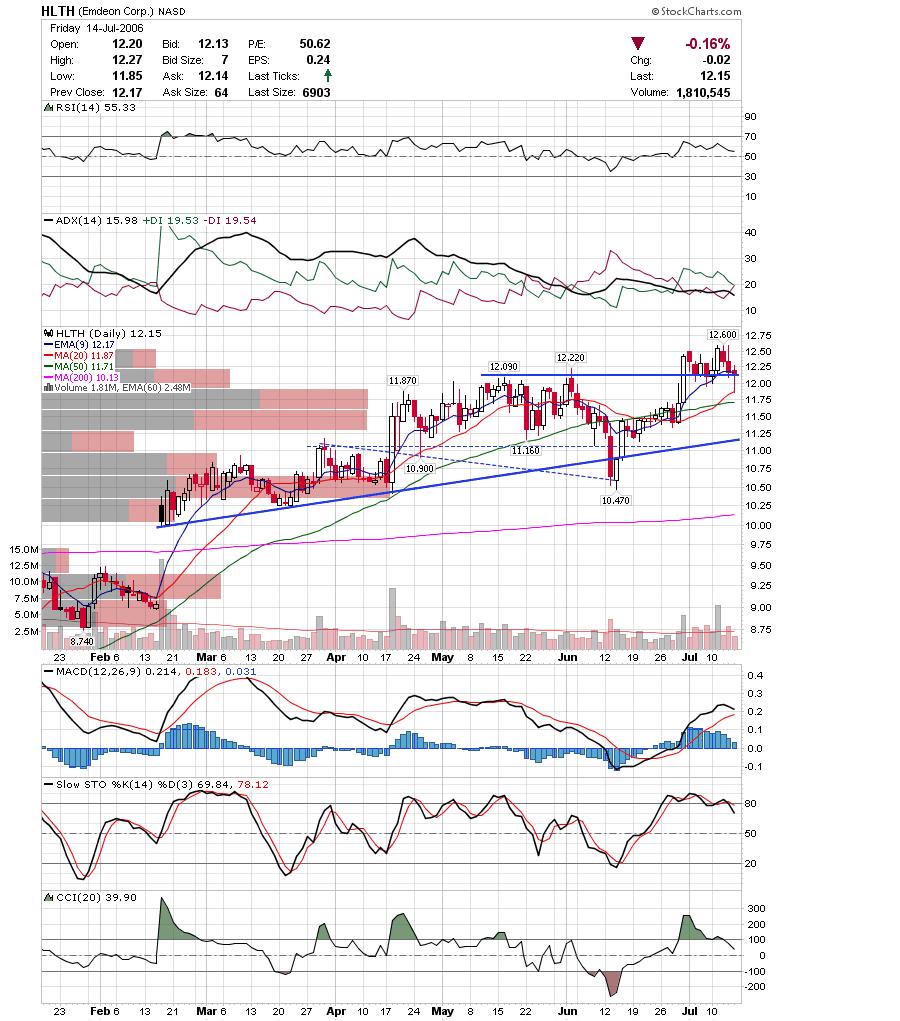 IBCA was an anomaly last friday heading higher as the market was breaking down. They are close to breaking out of this solid base.
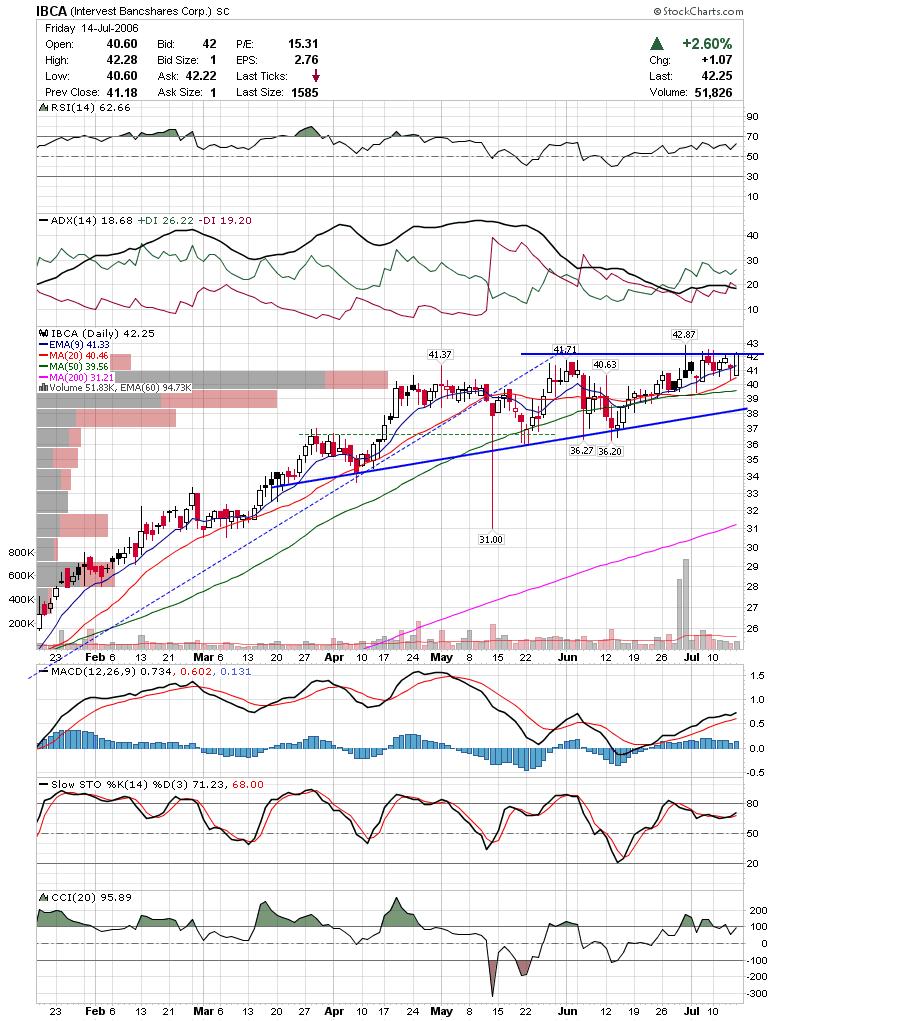 MED isn't giving me a clear chart pattern to work with, but the price action and volume are giving clues that a big move is in store. Look at how narrow a range and how light the volume has gotten over the past few days. Keep an eye on it to see which way it breaks.
 SII has been trading this range for the past year and is near the top again. It may need dip one more time if it is gonna breakout, but it is worth watching to see if it attempts it now.
 TZOO has been acting bullish and is reporting earnings soon.
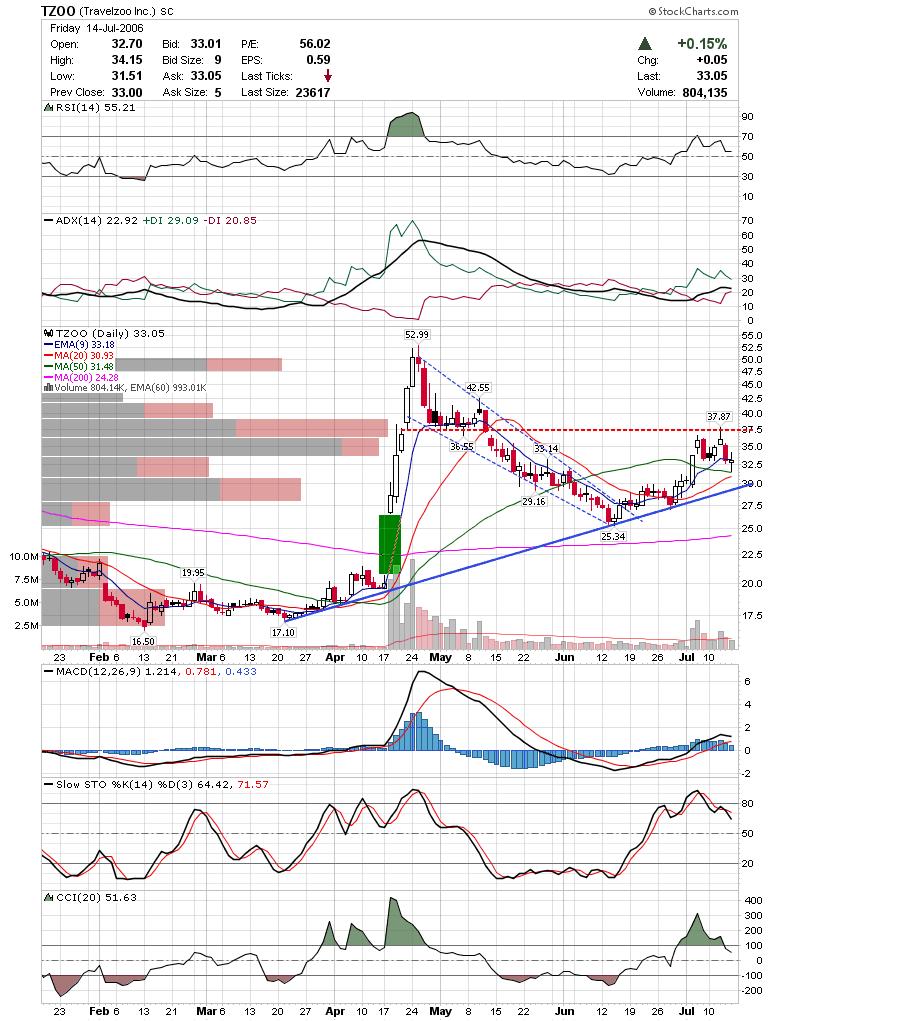
Also, keep an eye on BIDU as they were strong last friday as the market was weak. I should have some BIDU charts in the archives.
Good Luck,
DT
Subscribe to:
Post Comments (Atom)


0 comments
Post a Comment